Transcription
Munich Personal RePEc ArchiveFree Business Intelligence – An Easy andReliable AlternativeTARNAVEANU, DIANA and MUNTEAN, MIHAELAWest University of Timisoara, Faculty of Economics and BusinessAdministration, Department of Business Information Systems20 May 2012Online at https://mpra.ub.uni-muenchen.de/41184/MPRA Paper No. 41184, posted 21 Jul 2013 13:46 UTC
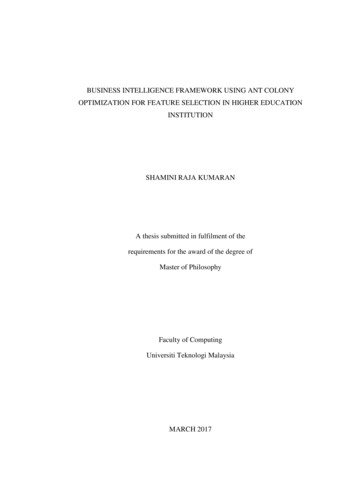
Free Business Intelligence – An Easy and Reliable AlternativeTÂRNĂVEANU DIANAdiana.tarnaveanu@feaa.uvt.roMUNTEAN I. MIHAELAmihaela.muntean@feaa.uvt.roBusiness Information Systems DepartmentWest University of Timişoara, Faculty of Economics and Business Administration16, H. Pestalozzi St., 300115, TimişoaraROMANIAAbstract: Business Intelligence (BI) represents the ability to look into the core of a business, in order tofundament the most effective and profitable decisions. An operational BI system sustains daily activitiesthrough the following functionalities: real-time informing, secured access to information, easy to use analysis.This change is a natural response of a passing to a new organizational culture of management based onmeasurable objectives. An operational BI system assumes tracking down trends, problems and other factors assoon as they act, allowing employers to solve them in real time. Implementing such a system assumes theexistence of an organizational culture where the employee is not longer an executor but a decision factor.Because the well-known systems are extremely expensive, we focused on finding a free BI software with thesame capabilities. We present a case of implementing a BI example using Tableau Public – a free datavisualization software. We believe that the future lies in cloud BI with the same strong capabilities.Key-Words: business intelligence, data warehouses, data analysis, decision-making1 State of ArtBusiness Intelligence is a concept used in Romaniaoften in the last 10 years. BI software is aninformation system that extract, consolidate, processand transform data into information and transmitthem to the decisional factors within theorganization, in the form of reports, analysis andperformance synthetic indicators. The informationsupport the decision processes and can extend thecapabilities of the firm.1.1 General ConsiderationsAccording to 2012 Gartner report [19], the trends tokeep an eye on are: consumerization and the tablet,the infinite data center, IT consumption, contextawareness, hybrid clouds, fabric data centers, ITcomplexity, patterns and analytics, the virtualenterprise and social networking.It is necessary to have a business analysiscomparative tool, because only optimizingperformance we can survive and remain a vitalcompetitor in a changing market, constantly takingadvantage of the raisin opportunities, risking andbeing flexible at new multiple demands. Having as amain goal productivity and profitability, BIinitiatives have some invisible advantages, such as:reduction of destructive influence of power games;the disposal of ungrounded, subjective and supradimensional fervor, and decisional enthusiasm;limiting over-exposure of ego in managerialcommunity and avoiding decisional jams. BI canprovide static reports like tables/charts, visualanalysis, performance management throughmonitoring of some synthetic alprocessing, dashboards, etc.At the global level, the market of BusinessIntelligence has an upward trend. International DataCorporation (IDC), at the second part of last year,estimated that between 2009 and 2013 this tendencywill continue [15].Fig. 1 – Gartner’s magic quadrant forBI platforms [source: 28]
The Magic Quadrant for Business IntelligencePlatforms [21] presents a global view of Gartner'sopinion of the main software vendors that should beconsidered by organizations seeking to developbusiness intelligence (BI) applications – Fig. 1.In Romania, small steps were made in this direction.From the firms that adopted Business Intelligencesystems, 24% implemented it 2-3 years ago, 14% inthe last 5-6 years, and 5% over 7 years. As for thevendors, business-intelligence.ro [26] conducts astudy, and based on their preliminary answers, wecan notice that Microsoft, SAP, IMB and Oracle arefighting for the supreme position, but we can alsonotice that some Open Source software tend tooutgrow them – Fig. 2.Fig. 2 – BI Vendor Awareness in Romania[source: 26]We consider all implementations should start withcreating a BICC. The Business IntelligenceCompetency Center (BICC) is essential to anenterprise's BI strategy. It can effectively addresscritical challenges such as staffing, planning andresource acquisition [25].Fig. 3 – BI Competency Centre[source: 25]The role of BICC is to develop the overallstrategic plan and priorities, define andimplement the requirements and help theorganization to interpret and apply the insight tomake business decisions – Fig. 3. The BICCshould be a cross-organizational group thatencompasses people skilled in Business, IT andAnalytics.1.2 Open source BIToday's BI architecture typically consists of a datawarehouse (or one or more data marts), whichconsolidates data from several operationaldatabases, and serves a variety of front-endquerying, reporting, and analytic tools. The goal isto facilitate the design and implementation ofoptimal flows to meet business requirements.We explored the market of BI solutions, and wefound the following free or Open Source solutions:1. Google Chart Tools – a perfect way tovisualize data on a website. From simpleline charts to complex hierarchical treemaps exposed as JavaScript classes,Google Chart Tools provides many charttypes, allowing customization [38];2. Many Eyes, an experiment designed byIBM Research and the IBM Cognossoftware group. The heart of this site is acollection of data visualizations. ManyEyes allows viewing data sets and creating,viewing and discussing visualizations. Allthe visualizations on Many Eyes have anattached discussion [37];3. Indicee – propose a complex service that isnot free after a limit. One of the mostcommon uses of the Indicee Platform APIis to provide developers with the ability toembed world class analytics into theirapplication and provide their customerswith reporting and dashboards. Indicee’scloud-based approach allows building dataover time [36];4. Tableau Software –creates interactivegraphs, dashboards, maps and tables fromvirtually any data and embeds them on awebsite or blog in minutes. If the userdecides to keep the results to himself or forthe company, than he will have to choosethe fully functional version. Otherwise, theresults are saved and displayed on a galleryon the web [39];5. The Pentaho BI Project is an ongoingeffort by the Open Source community toprovide organizations with best-in-classsolutions for their enterprise BI needs. Itencompassesthefollowingmajorapplication areas: reporting, analysis,dashboards, data mining, BI Platform [35];
6. Jasper Soft – a single easy-to-useenvironment designed with the nontechnical user in mind for delivering insightagainst data stored in relational, OLAP, andBig Data environments [34];7. Actuate BIRT – provide a wide range ofoptions for building rich informationapplications. In addition to the free opensource Business Intelligence tools, Actuatehas created a suite of commercial BIRTproducts, which adds to the open source BIindustry’s standard, widely adopted BIRTtools a variety of value-added products thatelevate the already superior BIRTdevelopment environment to a new plateau[31];8. Spago BI – an open source, complete andflexible BI suite: robust, secure, scalable,industry-grade OS BI suite with 17analytical areas, 21 engines; uniquesolutions, not only usual reporting andcharting tools: Geo, QbE, Dossier, KPIs,Interactive Dashboards, real-time BI [33];9. Palo BI – Palo Suite combines all coreapplications – OLAP Server, Palo Web,Palo ETL Server and Palo for Excel – intoone comprehensive and customizableBusiness Intelligence platform. Theplatform is completely based on OpenSource products representing a high-endBusiness Intelligence solution which isavailable entirely free of any license fees[32];10. Jedox – Jedox Suite offers capabilities forplanning,reporting,analysisanddashboarding. Jedox Suite is designed toenhance the user’s familiar Excel workingenvironment with specific BusinessIntelligence functionalities. The Excel addin interface combines ry Jedox functions [40].2 Developing an Open Source BIsolutionIt is estimated that today more than 60% ofcompanies and governments worldwide use someform of open source software, either as a knownresource or as a resource embedded in otherapplications, many of which are vendor supplied.Some of the most common industry applications ofopen source software are banking and financial BIsolutions, federal government business intelligence,education performance management and essionals [29].2.1 Establishing the future measuresWe decided to analyze an insurance company basedon these measures: M1 – analyzing the objects insured and thesum of money payed in counties, cities andzip codes; M2 – analyzing the objects insured bydifferent client types and the sum of moneypayed in counties and different years;M3 – analyzing the agents and the sum ofmoney payed with different types ofpayment, depending on the object insured,on different years.2.2 Analyzing data sourcesWe considered a database created on MicrosoftAccess 2007, containing data about an insurancecompany – Fig. 4.Fig. 4 – Insurances DatabaseClients can be private individuals companiescharacterized by a unique number, first name andlast name/firm’s name, address and phone number.They can sign different types of contracts (assets,life insurance and so on). Insurances are closed byagents characterized by a unique internal number,first name and last name. The insurance contract ischaracterized by an unique number, insurance date,insured object, period (in months) and insuredvalue. Both types of clients can pay with cash, creditor check, receiving receipts. Each documentcontains a unique number (imprinted on thedocument), payment date, and the amount of moneypaid. When damage happens, clients receivecompensations. In order to do that, an official reporthas to be signed. This report is characterized by aunique number, date and description of the causethat generated the damage.
2.3Implementation aspectsWith regards to the business requirements andas a result of a complex data analysis, the datamodel will ground the logical design of the datawarehouse. Facts and dimensions, building amultidimensional approach (Fig. 5, Fig. 8 andFig. 10) will be established. Tableau Softwareopen source BI software was chosen forimplementation (Fig. 6). Visualizations offermanagers the necessary support in real-timedecision-making processes (Fig. 7, Fig. 9 andFig. 11).a single page, usually tied together throughinteractivity. Dashboards increase the analyticalpower of the visualization by allowing multipleperspectives on the dataset in the same location –Fig. 7.Fig. 7 – Dashboard 1 (Measure M1)Fig. 5 – Measure M1We used a snowflake data schema with a hierarchy– Fig. 5, in order to construct the table – Fig. 6. Weselected the dimension hierarchy county with cityand zip code and the dimension ins object (insuredobject), and for the measure pay value (payedvalue) we selected SUM.In the first visualization, we can see the sum ofmoney payed on each county, city and zip-code. Thesecond visualization displays the sum of money ongeographical zone, displayed on a map.For the second measure we choose a basic starscheme – Fig. 8. The dimensions were county, yearfrom payment date, client type and insured object,and the measure sum of payed value.Fig. 8 – Measure M2Fig. 6 – Tableau Public Dimensions and MeasuresWe created two sheets, one for each type ofvisualization, and a Dashboard to display the resultsin two different ways: a bar version and ageographical approach. A Tableau dashboard is acollection of several related visualizations shown onOn a dashboard we displayed both the table and thestacked bars type of chart – Fig. 9. On the legenddisplayed in the right hand up corner, we can seewith different colors the months of payment. On thesame chart we can see the values payed for the twotypes of clients, on cities, and on the object insured.
4 ConclusionsFig. 9 – Dashboard 2(Measure M2)For the third measure we used another starschema – Fig. 11.ObjectDimensionAg nameDimensionPKPKins objectag ins objectyear pay dateag nametype paysum(pay value)Year pay dateType PayDimensionPKtype payFig. 10 – Measure M3For the last measure we chose dimensions: insuredobject, agent name, type of payment and year fromthe payment date, and the measure sum of payedmoney.Fig. 11 – Dashboard 3 – Indicator I3We obtain a complete analysis on each agent, basedon the type of payment, object insured and date.In our opinion, free BI is a good alternative fortraditional, expensive solutions. Technologies suchas Java and Flash make it possible to access, analyzeand interpret data, the results being publish directlyon the web, using online communities specificsharing facilities. Tableau Software is for anyonewho likes to post content to the web, being atremendous advancement for online publishers.Journalists like Scott Austin at the Wall StreetJournal, Ramon Martinez at the Pan AmericanHealth Organization, bloggers like Tim Ellis atSeattle Bubble, advocates like Patrick Montjouridesat UNESCO, professors like Robert Kosara at UNCCharlotte and his students, The Guardian Datablog,Data Driven Consulting and Seattle Times use anOpen Source BI, obtaining interactive visualizationswhich provide insight into their data. Open sourcesolutions are now becoming serious alternatives toproprietary software with ever increasing opensource projects providing a wide variety of tools fordata warehousing and full BI suites.References:[1] Airinei D., Homocianu D. – Data Visualizationin Business Intelligence, Proceedings of the11th WSEAS Int. Conf. on Mathematics andComputers in Business and EconomicsMCBE'10, pp. 164-167[2] Butuza A., Hauer I., Muntean C., Popa A. –Increasing the Business Performance usingBusiness Intelligence, Analele Universităţii“Eftimie Murgu” Reşiţa, anul XVIII, nr.3,2011, pp. 67-72[3] Ghilic-Micu B., Stoica M, Mircea M. – How toSucceed in Business Intelligence Initiative: ACase Study for Acquisition in Romania PublicInstitutions, WSEAS Transactions on Businessand Economics, Issues 6, Volume 5, June 2008,pp.298-309[4] [2] Ghilic-Micu B., Stoica M, Mircea M. – Aframework for measuring the impact of BIsolution, 9th WSEAS Int. Conf. onMATHEMATICS & COMPUTERS INBUSINESS AND ECONOMICS (MCBE '08),Bucharest, 2008, pp. 68-73[5] Hart M., Esat F., Rocha M., Khatieb Z. –Introducing Students to Business Intelligence:Acceptance and Perceptions of OLAPSoftware, Issues in Informing Science andInformation Technology, Volume 4, 2007,pp.105-123[6] Mukles, Z. – Business Intelligence: Its Ins andOuts, Technology Evaluation Centers, 2009,http://www.technologyevaluation.com/research
503/[7] Muntean M., Bologa A-R, Bologa R., Florea A.– Business Intelligence Systems in Support ofUniversity Strategy, Recent Researches inEducational Technologies, Proceedings of the7th WSEAS/IASME International Conferenceon Educational Technologies, EDUTE ’11,pp.118-123[8] Muntean M., Brândaş C. – e, Economy Informatics, 1-4/2007,pp.100-104[9] Muntean M., Cabau, L. G. – BusinessIntelligence Approach In A uni-muenchen.de/29914/,MPRA Paper No. 29914, posted 28. March2011 / 19:42[10] Muntean M., Târnăveanu D., Paul A. – BIApproachforBusinessPerformance,Proceedings of the 5th WSEAS InternationalConference on Economy and ManagementTransformation (Volume II), Timişoara, 2010,pp. 792-797[11] Olsen H. D., Bryant P.-D. – g Student Knowledge in DatabaseCourses, Review of Business InformationSystems – First Quarter 2012, Volume 16,No.1, pp.1-14[12] Radulescu Zoie C., Radulescu M., Vlad V.Motelica D.M. – A Multidimensional DataModel and OLAP Analysis for Soil PhysicalCharacteristics, 9th WSEAS Int. Conf. onMATHEMATICS & COMPUTERS INBUSINESS AND ECONOMICS (MCBE '08),Bucharest, 2008, pp.25-29[13] Radut C., Albici M., Teselios D., Valcu A. –Designing a Data Warehouse. Case Study: SC“AMBIENT” SA, International Conference ofScientific Paper, AFASES 2011, Brasov,http://www.afahc.ro/afases/AFASES 2011/Mathematics/Radut Albici Teselios Valcu.pdf,pp.641-645[14] Shrivastava A., Lanjewar U. – A Frame Workfor Behavioral Business Intelligence based onTrust Driven Decision Process Model,InternationalJournalofComputerApplications (0975-8887), Volume 33, No. 5,November, 2011, pp. 47-57[15] Târnăveanu D., Muntean M. – A BusinessIntelligence Virtual Competency Communityof Practice Proposal, IADIS InternationalConferences: Web Based Communities 2011,Collaborative Technologies 2011 and InternetApplications and Research 2011, Rome, Italy,pp.249-252[16] Voicu M.C. – Algorithms used to obtainaggregated value sets from relational databases,Algorithms used to obtain aggregated valuesets from relational databases, 9th WSEAS Int.Conf. on MATHEMATICS & COMPUTERSIN BUSINESS AND ECONOMICS (MCBE'08), Bucharest, 2008, pp.209-221[17] Thomsen C., Pedersen T.B. – Building a du.uy/inco/grupos/csi/esp/Cursos/cursos 6.pdf, pp.43-50[18] Voicu M., Mircea G.- Constructing andExploiting Hypercubes in order to ObtainAggregated Values – WSEAS Transactions onInformation Science and Applications, Issue10, Volume 3, October 2006, pp. 2008-2015[19] http://my.gartner.com/portal/server.pt?open 512&objID 202&mode 2&PageID 5553&ref webinar-rss&resId 1889218&ref g reghm[20] resentations/free/98-david-ayers.pdf[21] http://my.gartner.com/portal/server.pt?open 512&objID 260&mode 2&PageID 3460702&id 1915014&ref g sitelink[22] http://scn.sap.com/docs/DOC-18678[23] http://www.business-intelligence.ro/?p 93[24] http://www.locussolution.com/bisolutions.html[25] http://scn.sap.com/docs/DOC-18678[26] http://www.business-intelligence.ro/?p 190[27] http://www.idc.com/getdoc.jsp?containerId IDC P181[28] nt.asp[29] http://www.actuate.com/products/open-sourcebi/[30] p/Implement-an-open-source-BI-tool-head-totoe[31] http://www.actuate.com/products/open-sourcebi/[32] http://www.palo.net/[33] 34] http://www.jaspersoft.com/[35] http://www.pentaho.com/[36] http://www.indicee.com/[37] s/[38] https://developers.google.com/chart/[39] http://www.tableausoftware.com/[40] http://www.jedox.com/en/
7. Actuate BIRT - provide a wide range of options for building rich information applications. In addition to the free open source Business Intelligence tools, Actuate has created a suite of commercial BIRT products, which adds to the open source BI industry's standard, widely adopted BIRT tools a variety of value-added products that