Transcription
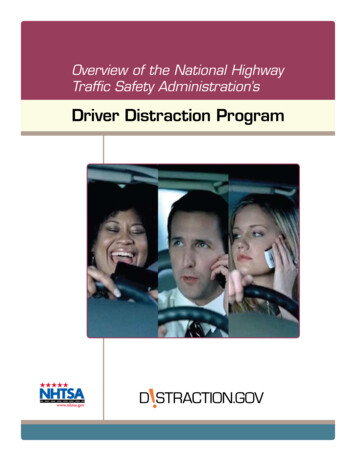
Overview of the National HighwayTraffic Safety Administration’sDriver Distraction Program
Table of ContentsIntroduction. 3Background. 3Definition, Measurement of Distraction.3Incidence and Safety Consequences of Distraction.6Technology-Based Distractions.9Countermeasures for Distracted Driving.9Summary. 11Distraction Program Goals. 13Initiatives. 15Initiative 1: Improve Understanding of the Problem. 15Initiative 2: Reduce Workload Demands onDrivers When Using In-Vehicle Technologies. 19Technologies. 23Initiative 3: Keep Drivers Safe. 23Initiative 4: Recognize Risks and Consequences. 27Summary. 311
2
IntroductionThe National Highway Traffic Safety Administration’s mission is to “savelives, prevent injuries, and reduce economic costs due to road trafficcrashes.” Driver distraction is a significant and difficult safety problem toaddress. This program lays out NHTSA’s efforts to address it. Planned projects for 2010 and beyond are described, with some building on a significantnumber of research projects conducted in prior years.This plan is intended to communicate NHTSA’s priorities to the public withregard to driver distraction safety challenges, namely our long-term goalof eliminating crashes that are attributable to distraction. Among them areprograms and projects involving improving our understanding of the problem, reducing workloads from driver interfaces, keeping distracted drivers safe, and recognizing the risks and consequences of distracted driving.NHTSA notes that this plan as well as individual projects are subject tochange depending on evolving interaction and changes in agency workload, resources, and priorities. NHTSA also notes that while we communicate our research plans with other Department of Transportation agencies,this plan is not meant to represent the extensive efforts planned throughoutthe DOT.BackgroundThis overview is intended as a complement to a previous NHTSA report,“Driver Distraction: A Review of the Current State-of-Knowledge.”1 Referto that document for additional detail and discussion. This report is available at the NHTSA Web site (www.nhtsa.gov).Definition, Measurement of DistractionAlthough the definition may seem obvious, the term distracted driving hasbeen used to represent different driver conditions. Some reports or newsarticles use the terms inattention and distraction synonymously. Whiledrowsiness and daydreaming can be categorized as inattention, the termdistraction as used in this plan is a specific type of inattention that occurswhen drivers divert their attention away from the driving task to focus onanother activity instead. These distractions can be from electronic distractions, such as navigation systems and cell phones, or more conventionaldistractions such as interacting with passengers and eating. These distracting tasks can affect drivers in different ways, and can be categorized intothe following types: Visual distraction: Tasks that require the driver to look away from theroadway to visually obtain information;1Ranney, T. A. (2008). Driver Distraction: A Review of the Current State-of-Knowledge. DOT HS 810704. Washington, DC: National Highway Traffic Safety Administration.3
Manual distraction: Tasks that require the driver to take a hand off thesteering wheel and manipulate a device; Cognitive distraction: Tasks that are defined as the mental workloadassociated with a task that involves thinking about something otherthan the driving task.The impact of distraction on driving is determined not just by the type ofdistraction, but also the frequency and duration of the task. That is to say,even if a task is less distracting, a driver who engages in it frequently or forlong durations may increase the crash risk to a level comparable to that ofmuch more difficult task performed less often. Because drivers often havea choice regarding when and how often to multitask when driving, theirexposure to risk is typically within their control; however some research— discussed later in this report — has shown that drivers underestimatethe overall risk of various tasks.It should be noted that because of the complex nature of distraction,researchers have implemented various methodologies to better understandthe problem. While each method provides insights into the problem, eachalso has its limitations. For a detailed discussion of these benefits and limitations, refer to the aforementioned summary report, Driver Distraction: AReview of the Current State-of-Knowledge.2 Several methodologies and thesubsequent results are discussed below.NHTSA’s 2007 Driver Cell Phone Use observational study estimated thatabout 6 percent of drivers are using hand-held phones at any given time.3Furthermore, when asked about their willingness to multitask under highand low-demand traffic situations, drivers in another NHTSA-sponsoredstudy did not perceive common cell phone tasks to contain much risk.4 Thestudy also showed that teenage drivers were the age group most willing toengage in various distracting activities and were confident in their abilityto multitask without consequence. The limited skill of many young driversand their poor judgment regarding when to attempt such tasks is of special concern, especially since the wireless devices they use are capable ofproviding even more complex features than phone operation, such as textmessaging and accessing the Internet.The safety impact of distraction is also dictated by the task itself and theworkload it imposes on the driver. To measure workload, several typesof studies have been conducted. The first type, controlled studies, havedemonstrated how drivers’ performances can be degraded when theymultitask. In these studies, degradations were evidenced in such behaviors as reduced eye scanning behavior, slower reaction time, degraded42Ranney, ibid.3NHTSA (2008). Driver Electroninc Device Use in 2007. DOT HS 810 963. Washington, DC: NationalHighway Traffic Safety Administration.4Lerner, N., Singer, J., & Huey, R. (2008). Driver Strategies for Engaging in Distracting Tasks UsingIn-Vehicle Technologies. DOT HS 810 919. Washington, DC: National Highway Traffic SafetyAdministration.
vehicle control (i.e., increased weaving of the vehicle within the lane), andlower detection of critical objects in peripheral vision.5 NHTSA studiesof several navigation system designs demonstrated the varying degreeof impact that their interfaces can have on driving performance.6 Moredistracting interface designs, or those that require more attention-relatedresources, diverted more attention from the driving task and, as a result,led to greater difficulty in lane keeping.All of these effects can degrade driving safety, but due to the nature ofcontrolled experiments, the crash consequences of such reduced drivingperformance are difficult to characterize. For example, people may operatedevices differently when they know they are being studied than they do inthe real world. They may increase the distance between themselves and thevehicle in front of them or they may slow down. What is known, however,is that some drivers don’t compensate appropriately, sometimes resultingin crashes. One method to overcome some of these limitations of controlledexperiments is the use of naturalistic data collection in which the behaviorof drivers using their personal vehicles on real roads is recorded by anarray of on-board instrumentation. When crashes and near-crashes occur,the information about the vehicle kinematics and driver behaviors leadingto these events are saved for analysis.NHTSA sponsored one such naturalistic study, conducted by Virginia TechTransportation Institute, in which 100 cars in Northern Virginia wereinstrumented, commonly known as the 100-Car Study.7 Analyses of therecorded video data allowed researchers to determine whether the driverswere distracted in the moments leading up to the crashes or near-crashes.The researchers also analyzed video clips when the drivers were engagingin secondary tasks. By comparing distractions during normal driving todistractions during crashes and near-crashes, estimates were made of therelative risk of drivers when distracted. Due to the success of this method,the Transportation Research Board under its Strategic Highway ResearchProgram 2 (SHRP2) has initiated a much larger naturalistic driving studywith a wider sample of drivers, which is expected to be more representativeof the general driving public. When it is completed (expected in 2012),it will provide more comprehensive data on the incidence of distractingactivities among drivers generally and better information on the contribution of distracting activities to crash causation in passenger vehicles.Naturalistic studies also have their limitations compared to controlled studies. Specifically, although controlled studies do not provide informationabout the frequency and circumstances in which drivers willingly engage5Ranney, ibid.6Tijerina, L., Johnston, S., Parmer, E., Winterbottom, M. D., & Goodman, M. (2000). Driver Distractionwith Wireless Communications and Route Guidance Systems. DOT HS 809 069. Washington, DC:National Highway Traffic Safety Administration.7Klauer, S. G., Dingus, T. A., Neale, V. L., Sudweeks, J. D., Ramsey, D. J. (2006). The Impact of DriverInattention on Near-Crash/Crash Risk: An Analysis Using the 100-Car Naturalistic Driving StudyData. DOT HS 810 594. Washington, DC: National Highway Traffic Safety Administration.5
in distracting activities, naturalistic studies do not have controls or metricsto look at specific conditions. For example, drivers are free to use featuresor devices at their own discretion, which may or may not provide enoughdata to make comparisons. Thus, both methods are needed to fully understand the nature of distraction and its consequences.Incidence and Safety Consequences of DistractionDrivers have often experienced distractions due to other passengers, radiooperation, and eating food, among other activities. Increasingly, drivers aredistracted by new technologies and innovative features available in theirvehicles or in portable devices that they bring into the vehicle. Prospective passenger vehicle buyers are faced with an ever increasing variety ofIn-Vehicle Information Systems (IVIS), each capable of tasks that are potentially distracting. Portable devices offer many of the same capabilities asoriginal equipment manufacturers’ products plus additional ones. Manyof these technologies have the capabilities to receive, transmit, and displayvarious types of information. They give drivers the opportunities to placecalls, obtain directions, send text messages or e-mails, and choose frommany multi-channel music and entertainment options. Through wirelesscommunications, drivers may receive information about real-time trafficreports, parking information, and advertising for nearby businesses. Otherinformation available to drivers includes advanced driver assistance systems that can alert and warn drivers about the condition of their vehicles,fuel economy, nearby objects, and likely crash situations.Currently, NHTSA has three primary sources of data from which to assessthe effects of distraction. The first two are police-accident-report-basedsystems. The Fatality Analysis Reporting System (FARS) is a census offatal crash data assembled by NHTSA. In addition to fatality data, theNational Automotive Sampling Systems (NASS) General Estimates System (GES) provides a sample of all police-reported crashes to estimatethe number of injured people and to gather information about crashesof varying severity. These systems rely on the State data-based policeaccident report (PAR) as their primary data sources for the recoding ofthe distraction information into a uniform national data set. Estimatingthe role of distraction from these crash databases is difficult because thepolice-reported distraction and inattention data appear to have a widedegree of reporting and collection variability. Despite the limitations inthis data collection, NHTSA’s data shows that almost 5,870 people diedand an approximately 500,000 people were injured in crashes that werereported to have involved distraction in 2008.8The third primary source is an on-scene investigation-based crash datasource that provides unique insights about distraction is the National Motor86Ascone, D., Lindsey, T., & Varghese, C. (2009, September). An Examination of Driver Distraction asRecorded in NHTSA Databases. Traffic Safety Facts Research Note. DOT HS 811 216. Washington,DC: National Highway Traffic Safety Administration.
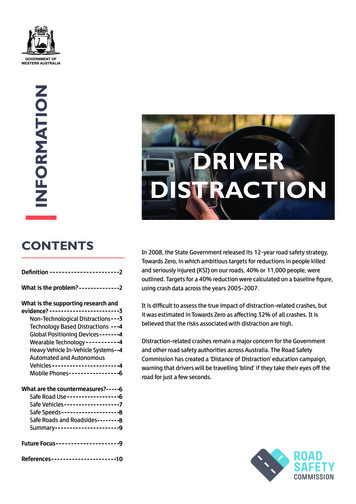
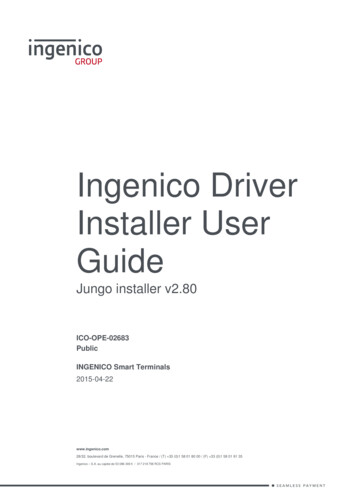
Vehicle Crash Causation Survey (NMVCCS).9 This nationally representativedatabase consists of on-scene, in-depth multidisciplinary investigations of6,949 crashes that occurred between 2005 and 2007. This in-depth, onsite approach provides more details than typical police reports about thedriver, vehicle, and traffic characteristics associated with distraction-relatedcrashes. This data indicate that distractions internal to the vehicle were acritical reason in about 11 percent of crashes studied. An analysis of thetypes of internal distractions found that about 0.2 percent of drivers weredialing or hanging up phones, about 0.9 percent were adjusting radios/CDsor other controls, and about 12 percent were conversing with passengersor on cell phones. Drivers 16 to 25 years old had the highest percentage ofbeing engaged in at least one interior non-driving activity (6.6%).The previously mentioned 100-Car study confirmed that distraction is acommon occurrence while driving; many distractions increase the relativerisk of crashes and near-crashes, and distractions that require drivers totake their eyes off the road are potentially more of a safety problem thanpurely cognitive distractions. The researchers in that study used the data todetermine the odds ratio or increased risk of engaging in various secondarytasks over “just driving.” Table 1 shows some of the results (statisticallysignificant results are in bold). A significant odds ratio indicates a reliableincrease in risk associated with that activity.Table 1. Odds ratio for secondary tasks in the 100-Car StudyType of Secondary Task9Odds RatioReaching for a moving object8.82Insect in vehicle6.37Looking at external object3.70Reading3.38Applying makeup3.13Dialing hand-held device2.79Inserting/retrieving CD2.25Eating1.57Reaching for non-moving object1.38Talking/listing to a hand-held device1.29Drinking from open container1.03Other personal hygiene0.70Adjusting the radio0.50Passenger in adjacent seat0.50Passenger in rear seat0.39Child in rear seat0.33NHTSA. (2008, July). National Motor Vehicle Crash Causation Study Report to Congress. DOT HS811 059. Washington, DC: National Highway Traffic Safety Administration.7
Based on these results, reaching for a moving object is the most riskybehavior observed, increasing crash risk by more than eight times that ofjust driving.A similar methodology to NMVCCS was used to collect data in recentheavy-truck research. The Large-Truck Crash Causation Study recordedinformation on nearly 1,000 heavy-truck fatal and injury crashes.10 Anestimated 2 percent of these crashes were associated with a distractioninside the truck. Two additional naturalistic studies – the Drowsy DriverWarning System Field Operational Test and the Naturalistic Truck DrivingStudy – were combined with the Large-Truck Crash Causation Study andanalyzed to further investigate distracted driving. While few crashes wereobserved, preliminary results indicate that text messaging on a cell phonewhile driving increased crash risk more than 23 times.11Epidemiological studies have also evaluated the crash risk associated withcell phones.12 Some of the studies consistently found a four-fold increase incrash risk associated with the use of a cellular phone.13 14 The increased riskassociated with cell phone use is not certain, however, because researchers may have relied on incorrect assumptions about driver behavior, forexample whether the driver was on the phone when the crash occurred(versus right after the event to call for emergency services).As summarized in the Research Note, Examination of Driver Distraction asRecorded in NHTSA Database:15Measuring driver distraction in the field is difficult and potentiallyimprecise because of self-reporting and timing of data collection.Due to differences in methodology and definitions of distraction,each study or survey conducted may arrive at different results andconclusions with respect to the involvement of driver distractionduring a crash. NHTSA’s research paper Driver Distraction: AReview of the Current State-of-Knowledge discusses multiple meansof measuring the effects of driver distraction including observational studies, crash-based studies, and experimental studies ofdriving performance.These differences may explain discrepancies in the results based upon thedifferent sources.810FMCSA. (2006). Report to Congress on the Large Truck Crash Causation Study. Washington, DC:Federal Motor Carrier Safety Administration.11Olson, R., Hanowski, R., Hickman, J. S., & Bocanegra, J. (2009). Driver Distraction in CommercialVehicle Operations. DOT FMCSA-RRR-09-042. Washington, DC: Federal Motor Carrier SafetyAdministration.12McEvoy, S. P., Stevenson, M. R., McCartt, A. T., Woodward, M., Haworth, C., Palamara, P., andCercarelli, R. (2005). Role of mobile phones in motor vehicle crashes resulting in hospital attendance:a case-crossover study. British Medical Journal, 331: 428.13Redelmeier, D. A., & Tibshirani, R. J. (1997). Association between cellular telephone calls and motorvehicle collisions. The New England Journal of Medicine, 336, 453-458.14McEvoy, ibid.15Ascone, ibid.
Technology-Based DistractionsCell phone use while driving has received a considerable amount of researchattention (for a summary of 125 studies see McCartt et al.16). Most researchstudies show that task complexity (i.e., the amount of resources requiredto complete the task) is a key to estimating distraction potential in thatmore-complex tasks are more detrimental to driving performance thanlesser-demanding tasks. The issue as to whether operating a phone via ahands-free mode is safer or less safe than operating a phone in a hand-heldmanner has also received a lot of research attention over the years. Whileearly work tended to show a decrement with both hand-held and handsfree, newer technologies and applications require additional research todetermine if the any one of the interfaces provide an advantage.In addition to cell phones, in-vehicle and other portable entertainmentdevices can have complex interfaces for drivers to operate. Examples includetouch screen visual displays, joystick input methods, voice interfaces, andhead-up displays. As a result of the increasing number of informationsources and their complicated interface designs, drivers are facing moreopportunities to become distracted by devices that may be more challenging to use than what drivers are accustomed to.To provide an estimate of how future technology trends affect driver distraction, NHTSA conducted an inventory of in-vehicle technologies, primarily focused on navigation systems.17 This inventory highlighted aspectsof equipment design that could affect driver distraction. This effort wasfollowed by another inventory that included adaptive cruise control, parkaid systems, night vision systems, and navigation/route guidance systems,and was an impetus for a larger study of early adopters of these technologies.18 These inventories gave NHTSA snapshots of the sources of potentialdriver distractions.Countermeasures for Distracted DrivingAs a result of the growing concern over the increasing use of wirelesscommunications devices and other “electronic distractions,” NHTSA helda public meeting in 2000 to bring the issue to national attention and toseek the engagement of the automotive and related industries.19 One result16McCartt, A. T., Hellinga, L. A., & Braitman, K. A. (2006). Cell phones and driving: Review ofresearch. Traffic Injury Prevention, 7, 89-106.17Llaneras R. E., & Singer, J. (2002). Inventory of In-Vehicle Technology Human FactorsDesign Characteristics, DOT HS 809 457. Washington, DC: National Highway Traffic SafetyAdministration.18Llaneras, R. E. (2006, January). Exploratory Study of Early Adopters, Safety-Related Driving WithAdvanced Technologies. Final Task 2 Report: In-Vehicle Systems Inventory, Recruitment Methods& Approaches, and Owner Interview Results. DOT HS 809 972. Washington, DC: National HighwayTraffic Safety Administration.19Llaneras, R. E. (2000, November 15). Driver Distraction Internet Forum: Summary and Proceedings.Washington, DC: National Highway Traffic Safety Administration. Available at: ction/FinalInternetForumReport.pdf9
of the meeting was the decision of the Alliance of Automobile Manufacturers (AAM) to form a working group to develop a set of guidelines fordevice design to minimize driver distraction. The current AAM guidelinesaddress only those functions that require drivers to look at and manuallyoperate controls and displays. In a letter to the NHTSA administrator datedApril 22, 2002, the AAM committed its intent to have its products conformto AAM guidelines.Many efforts have been made to develop guidelines for in-vehicle devices.NHTSA sponsored a cooperative agreement with the CAMP (Crash Avoidance Metrics Partnership) industry consortium to develop workload metrics(measures of driver performance).20 In addition, several European countrieshave conducted metrics development efforts under the HASTE (HumanMachine Interface And the Safety of Traffic in Europe) program. Also, several manufacturers developed metrics under the ADAM (Advanced DriverAttention Metrics) program. Transport Canada proposed a Memorandumof Understanding with automotive manufacturers in regard to adherenceto industry-developed performance guidelines relating to telematics devicedesign and development. These guideline efforts have gone on to supportmany ongoing research programs today.The NHTSA-sponsored SAVE-IT program (SAfety VEhicle Using AdaptiveInterface Technology) explored the feasibility of a workload managementtool, which is a system designed to minimize the workload (i.e., mentaleffort required) from in-vehicle interfaces at unsafe times, such as whendrivers need to focus on critical driving situations.21 These systems usesensors and algorithms to make real-time calculations of the difficulty ofthe driving situation and, based on those calculations, determine when tosuppress the display of additional potentially distracting information or toprioritize their presentation to limit the amount of information displayedat one time. For example, if a driver is in heavy traffic, in the rain, or ona curvy road, an incoming phone call (an added demand) could be automatically routed to voice mail, instead of ringing as normal. To design aworkload manager, it is necessary to know which driving tasks are riskierthan others, and the distraction potential of attending to another information source. The SAVE-IT program demonstrated the feasibility of such asystem.In addition to distraction-specific technologies, several driver assistancetechnologies (e.g., lane departure warning, crash-imminent braking, forward collision warning) have the potential to reduce the negative impact ofdistracted driving. Many past and ongoing NHTSA research programs haveexamined these technologies (e.g., Integrated Vehicle-Based Safety Systems1020Angell, L., et al. (2006, November). Driver Workload Metrics Project: Task 2 Final report. DOTHS 810 635. Washington, DC: National Highway Traffic Safety Administration. Available ort.pdf21Information on the SAVE-IT program can be found at: tml
[IVBSS], Advanced Collision Avoidance Technologies [ACAT], and Vehicleto Vehicle/Vehicle to Infrastructure Communications under the Intellidrive program22). NHTSA will continue to investigate these technologies toevaluate their crash-reduction potential and determine ways to reduce thedistraction potential the systems themselves may present.SummaryResearchers use epidemiological studies, experimental studies, and analysesof crash data to assess the safety problem of driver distraction. The findingswidely indicate that distraction is a safety problem that can increase crashrisk; many studies have shown how this increased risk can occur due to thedegradation in driving performance during multitasking, including slowerreaction time and narrowed visual scanning. Future research will help toprovide better risk estimates and insights regarding the role of distractionin crash causation.22Information on the Intellidrive program can be found at: http://www.intellidriveusa.org/11
12
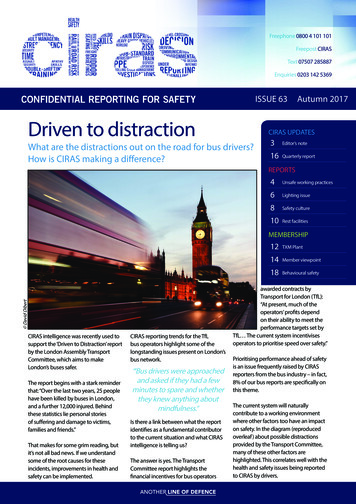
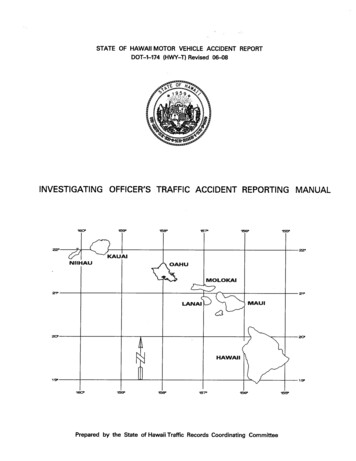
Distraction Program GoalsDistraction PlanEliminate Crashes Due to DistractionInitiative 1Initiative 2Initiative 3Initiative 4Improve theUnderstandingof the ProblemReduceWorkload fromInterfacesKeep DriversSafeRecognizeRisks andConsequencesData ApproachVehicle ApproachesBehavioral ApproachFigure 1. Distraction PlanAs part of NHTSA’s overarching goal of reducing fatalities and injuries dueto traffic crashes, the agency has been interested in an array of safety problems, including distraction. The agency developed this distraction plan tohelp in its long-term goal of eliminating a specific category of crashes – thoseattributable to driver distraction. The program involves four initiatives(Figure 1). The first initiative is to improve the understanding of the extentand nature of the distraction problem by enhancing the data quality andanalysis methods. These efforts will continue to improve the understanding of the extent and nature of the distraction problem. The two vehicularinitiatives include determining how to design interfaces to minimize workload, and developing and evaluating crash avoidance technologies that willkeep distracted drivers and their passengers safe (i.e., use crash warningsand distraction monitoring systems to detect risks, and warn drivers). Thefourth initiative, a behavioral approach, seeks to educate drivers on therisks and consequences of distracted driving. The comprehensive programpresented below is intended to limit the workload experienced by driversusing devices in vehicles and keep distracted drivers safe regardless of thedistraction source.13
Built into the program are considerations to identify and control for risksthat, left unchecked, would limit the program’s success, such as driveracceptance and/or low adoption rate of technologies. Technology-basedsolutions may be difficult to implement due to high costs, marketplaceresistance, and unproven effectiveness. Effectiveness may be reduced bydriver efforts to circumvent unpopular countermeasures. In addition, benefits may be compromised if drivers overestimate the protection affordedby technologies and adopt unsafe behaviors, such as increased phone use,that are counterproductive to safety. Behavioral approaches, such as lawsrestricting cell phone use or educational programs, must overcome theresistance of drivers who may not fully appreciate the risks associated withcommon and “electronic” distractions.14
InitiativesInitiative 1: Improve Understanding of the ProblemBackgroundThe changing nature of distracting tasks and the limitations of availabledata require a continuous effort to better understand the issues surroundingdriver distraction. As discussed previously, our understanding of exposureto distractions is limited by the availability of real-world data. In additionto this real-world data, the relative risk of a task compared to other factors, such as what devices and tasks cause drivers to become distracted, thecircumstances under which crashes occur, the drivers’ characteristics thatincrease the propensity to lose focus, and the effects of potential interfaceimprovements on crash risk.The rapid advances in technology entering the marketplace also add complexity to the distraction problem – it requires a focused effort on monitoring current trends to identify distractions early in the deployment. To betterassess the distraction potential of new technologies, this plan outlines theagency’s efforts to gain a more in-depth understanding of the interfaces currently on the market, specifically for distraction potential and use rates.Programs to Support Initiative 1Initiative 1:Improve the Understanding of the lyzeadditionalcrash data Improveddata qualitythroughstandardizedreporting Improvedtraining nalysesfor SHRP 26Assess useof newtechnology7Assess cellphoneinterfaces8Evaluatemanualentry tasks Continuedtracking ofuse Improvedprotocolsand datacollectiontechniques Provideguidance tooutsideentities ondatacollectionmethods Increasedunderstanding ofrate/effect/sources ofdistracteddriving Informationon driveruse patternsto identify(dis)benefits New datacollectionmethods Estimates ofexposure,risk
The National Highway Traffic Safety Administration's mission is to "save . lives, prevent injuries, and reduce economic costs due to road traffic crashes." Driver distraction is a significant and difficult safety problem to address. This program lays out NHTSA's efforts to address it. Planned proj -