Transcription
Chang et al. BMC Health Services Research 2010, 3RESEARCH ARTICLEOpen AccessComparison of alternative risk adjustmentmeasures for predictive modeling: high riskpatient case finding using Taiwan’s NationalHealth Insurance claimsHsien-Yen Chang1*, Wui-Chiang Lee2, Jonathan P Weiner1AbstractBackground: Predictive modeling presents an opportunity to contain the expansion of medical expenditures byfocusing on very few people. Evaluation of how risk adjustment models perform in predictive modeling in Taiwanor Asia has been rare. The aims of this study were to evaluate the performance of different risk adjustment models(the ACG risk adjustment system and prior expenditures) in predictive modeling, using Taiwan’s National HealthInsurance (NHI) claims data, and to compare characteristics of potentially high-expenditure subjects identifiedthrough different models.Methods: A random sample of NHI enrollees continuously enrolled in 2002 and 2003 (n 164,562) was selected.Health status measures and total expenditures derived from 2002 NHI claims data were used to predict thepossibility of becoming 2003 top users. Statistics-based indicators (C-statistics, sensitivity, & Predictive Positive Value)and characteristics of identified top groups by different models (expenditures and prevalence of manageablediseases) were presented.Results: Both diagnosis-based and prior expenditures models performed much better than the demographicmodel. Diagnosis-based models were better in identifying top users with manageable diseases; prior expendituresmodels were better in statistics-based indicators and identifying people with higher average expenditures. Priorexpenditures status could correctly identify more actual top users than diagnosis-based or demographic models.The proportions of actual top users that could be identified by diagnosis-based models alone were much lowerthan that identified by prior expenditures status.Conclusions: Predicted top users identified by different models have different characteristics and there is littleagreement between modes regarding which groups would be potentially top users; therefore, which model to useshould depend on the purpose of predictive modeling. Prior expenditures are a more powerful tool thandiagnosis-based risk adjusters in terms of correctly identifying more actual high expenditures users. There is stillmuch room left for improvement of diagnosis-based models in predictive modeling.BackgroundResearch analyzing the distribution of medical expenditures has consistently shown that a large proportion ofmedical resources are consumed by a small percentageof the total population[1]. The top 20% of the* Correspondence: hchang2@jhsph.edu1Department of Health Policy & Management, Bloomberg School of PublicHealth, Johns Hopkins University, 624 N. Broadway, Baltimore, MD 21205,USAFull list of author information is available at the end of the articlepopulation with the highest expenditures accounted forabout 80% of all healthcare expenditures in the UnitedStates[2-4]. This phenomenon of the concentration ofhealthcare expenditures has been observed continuouslysince 1970[5]. Consequently, this group of extraordinarily high users of medical resources has inevitablybecome a target of several types of cost-containmentstrategies, such as disease management, care management, and utilization review[1,6]. 2010 Chang et al; licensee BioMed Central Ltd. This is an Open Access article distributed under the terms of the Creative CommonsAttribution License (http://creativecommons.org/licenses/by/2.0), which permits unrestricted use, distribution, and reproduction inany medium, provided the original work is properly cited.
Chang et al. BMC Health Services Research 2010, 3Predictive modeling in health care is generally definedas ‘a process of applying existing patient data to prospectively identify persons with high medical needs whoare at risk for higher future medical utilization[7].’ Predictive modeling is important because early interventioncan be delivered to persons identified as possibly havinghigh medical needs. By helping these individuals managetheir diseases effectively and providing coordinated medical care, their medical utilization can be reduced andthe quality of care they receive can be maintained orimproved[8]. In the long run, the expansion of medicalexpenditures may be controlled within a reasonablerange[4,6]. Diagnosis-based health indicators and priorexpenditures are the two most common types of riskadjusters for this purpose. It was found that both typesof models were very comparable in overall discrimination (by C-statistics), sensitivity, and specificity; however,high-expenditure individuals identified by diagnosisbased models had higher disease burden and somewhathigher healthcare utilization[3,8-10]. Since high-expenditure users identified by diagnosis-based models havemore ‘manageable’ diseases that are targets of diseasemanagement programs, it is the preferred model to use.Taiwan launched a government-run, single-payerNational Health Insurance (NHI) programme in May1995. All Taiwanese nationals are obligated by law tojoin this programme to ensure adequate risk pooling.Under the jurisdiction of the national government’sDepartment of Health, the NHI is administered by theBureau of National Health Insurance (BNHI) and sixregional branches are in charge of administrating theNHI in each area. The NHI’s benefit packages are comprehensive, including inpatient and outpatient services,pharmacy services, Chinese medicine and dental services. Beneficiaries have complete freedom of choice ofproviders and therapies, and they do not need to gothrough ‘gatekeepers’ in order to obtain medical servicesfrom specialists. The primary source of funding for theNHI is the payment of premiums shared by the insured,the employers and the government. In terms of reimbursement, the global budget payment system wasadopted in order to contain the growth of medicalexpenditure. Within budget limits, the NHI reimbursescontracted providers mostly on a fee-for-service basis,using uniform national fee schedules.Given the rising concerns to contain the growth ofmedical expenditures, predictive modeling presents anopportunity to achieve this goal by focusing on very fewpeople. However, previous studies regarding predictivemodeling have used regional datasets or focused only onsub-populations, and were conducted in the Westerncountries. Taiwan is one of very few healthcare systemsin the world which has universal coverage and a singlenational computerized database that includes medicalPage 2 of 11diagnosis information on almost 100% of the population.For this reason the results of this paper have potentialpolicy and methodology implications for most otherhigh or middle income nations.Few studies related to predictive modeling have beenconducted in Taiwan. It has been shown that a government-sponsored disease-management program significantly reduced medical utilization for patients withasthma[11]. In addition, patients in the program hadmore accurate knowledge of and better self-care skillsconcerning asthma, and were more likely to adhere tophysicians’ suggestions[11]. These achievements implythat medical expenditures incurred by this group ofpatients could potentially be reduced by providing disease and care management, while quality of care couldbe improved. Utilization review has also been implemented by the Bureau of National Health Insurance(BNHI) in Taiwan, but it was done retrospectively;under such situation, high-expenditure users could onlybe identified after a large amount of expenditures hadoccurred, and only a certain proportion of this population would remain high-expenditure users in the following years.The goal of this study is to evaluate the performanceof the Adjusted Clinical Group (ACG) risk adjustmentsystem in predictive modeling using Taiwan’s NationalHealth Insurance claims data, and to compare characteristics of potentially high-expenditure subjects identifiedthrough different models.MethodsData sourcesThe source of the data was a longitudinal dataset prepared by Taiwan’s Bureau of National Health Insurance,which is available for researchers interested in observinglongitudinal changes of medical utilization. This datasetcontained enrollment and claims files of a randomlychosen 1% of Taiwan’s population ( 200,000 individuals). The enrollment files contained individual subscription information and demographic factors,including sex, date of birth, type of beneficiaries, andlocation. The claims files contained comprehensiverecords of inpatient care, ambulatory care, pharmacystore, dental care, and Chinese medicine services. Thefiles also included date of service, ICD-9-CM (International Classification of Diseases) diagnosis codes,claimed medical expenses, and amount of co-paymentfor each encounter. Twenty-four-month enrollment inboth years (2002 and 2003) was required for this analysis, resulting in the final sample size of 164,562 subjects.Individuals’ identifiers in this dataset have beenencrypted to protect privacy and confidentiality, and thisstudy has been approved by the Johns Hopkins Schoolof Public Health Institutional Review Board.
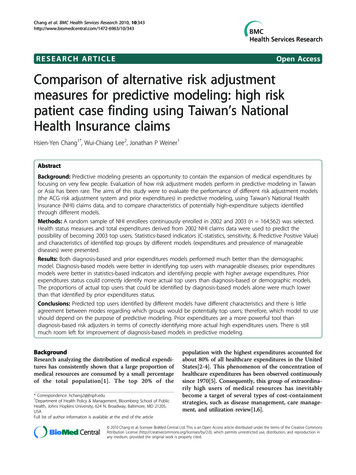
Chang et al. BMC Health Services Research 2010, 3Annual health expenditures for every NHI enrolleewere aggregated from all inpatient, outpatient, and pharmacy store claimed expenses, including claimed reimbursement, medication expenses, and co-payments.Expenses for dental care and Chinese medicine wereexcluded from this aggregation. Both 2002 and 2003expenditures were calculated. The unit of money in Taiwan is New Taiwan Dollar (NTD); the exchange rate isabout 31 NTD: 1 US dollar as of May 2010. Demographic factors included sex, categorical age (0-17, 1834, 35-49, 50-64, 65), type of beneficiary (insured ordependent), insurance category (based on insured’s typeof job), residence (three levels with different degrees ofpopulation density), and locality (six geographic regionsby BNHI’s administrative branches: Taipei, Northern,Central, Southern, Kao-Ping, Eastern). Diagnosis-basedrisk adjustment factors, including ACG, ADG (Aggregated Diagnosis Group) and EDC (Expanded DiagnosisCluster), were derived from the ACG case-mix system(Version 7.1) using individuals’ overall ICD-9-CM codesfrom both inpatient and outpatient records (diagnosiscodes from dental and Chinese medicine services wereexcluded) in the year 2002.The ACG risk adjustment systemACGs are mutually exclusive health status categoriesdefined by morbidity pattern, age, and sex. The ACGsystem assigns all ICD-9-CM codes to one of 32 diagnostic clusters (ADGs) based on five clinical dimensions:duration, severity, diagnostic certainty, etiology, and specialty care involvement[12,13]. Each ADG is a groupingof diagnosis codes similar in terms of severity and likelihood of persistence of the health condition treated overa relevant period. ADGs are not mutually exclusive andindividuals can have multiple ADGs (up to 32). Individuals are then placed into one of 93 discrete ACG categories according to their assigned ADGs, age, and sex;the result is that individuals within a given ACG haveexperienced a similar pattern of morbidity and resourceconsumption. Expanded Diagnosis Clusters (EDCs) arebinary indicators to show whether an individual has specific diseases/symptoms. The EDC methodology assignseach ICD code to a single EDC; there are 264 EDCs intotal. ICD codes within an EDC share similar clinicalcharacteristics and are expected to induce similar typesof diagnostic and therapeutic responses.Risk adjustment modelsFive risk adjustment models evaluated in this study arelisted below based on the comprehensiveness of riskadjusters:Model 1: Demographics (sex and age groups) only,Model 2: ACGs with demographics,Page 3 of 11Model 3: ADGs plus selected EDCs with demographics,Model 4: Prior expenditures with demographics, andModel 5: Prior expenditures, ADGs plus selectedEDCs with demographics.Selected EDCs were derived from the results of stepwise analyses in explaining prospective total expenditures, using a full set of EDCs and a multivariate linearregression model; 19 EDCs were thus chosen (Additional file 1).Outcomes and measures of model performanceBeing a high-expenditure user was a binary variabledefined using the following three thresholds: top 0.5%,1%, and 5% users in 2003. We applied a logistic regression model, given that it is the standard approach toanalyze dichotomous outcomes. We conducted all statistical analyses using SAS software version 9.1. Performance of five risk adjustment models was evaluatedfrom three aspects: statistical indicators, proportions oftrue cases identified by models, and characteristics ofpredicted cases. Statistical indicators included C-statistics, sensitivity, and predictive positive value[1], and thethresholds for calculating statistical indicators were setas the corresponding levels of outcomes. The c-statisticrepresents the area under the Receiver Operating Characteristic (ROC) curve, and hence provides an overallmeasure of model performance; in addition, the c-statistic is also independent of other conditions. Actual 2003top users were assigned to one of four mutually exclusive categories: in 2002 top user group alone, in predicted top user group identified by risk adjustmentmodels alone, in both groups, or in neither group(Figure 1). The real contribution of risk adjustmentmodels comes from those identified by models alone,because these subjects may not be known withoutapplying risk adjustment models (area a in Figure 1).After a group of high-expenditure users was identifiedby each model, it was also common to examine thecharacteristics of this population as an alternativemethod to assess the model performance. Expendituresbased performance indicators included 2003 averagetotal and drug expenditures in the identified top groups,top/bottom total and drug expenditures ratio (2003average expenditures in top group divided by averageexpenditures in the rest of the population), and year-2/year-1 total and drug expenditures ratio (2003 averageexpenditures divided by 2002 average expenditures intop group)[9]. A better risk adjustment model will havehigher total and drug expenditures, higher top/bottomexpenditures ratio, and higher year-2/year-1 expenditures ratio (subjects with expenditures increasing overtime are better targets for intervention). In addition, theproportion of identified high-expenditure subjects with
Chang et al. BMC Health Services Research 2010, 3Page 4 of 11Actual Top UsersAA:B:C:D:BCDIdentified by Risk Adjustment Model OnlyIdentified by Both Risk Adjustment Model and Prior Cost StatusIdentified by Prior Cost Status OnlyNot Identified by Either ModelFigure 1 Classification of actual top users.manageable diseases (asthma, COPD, hypertension,depression, or diabetes) is also another important indicator and extensively used[3,10]. Split analysis (a randomlyselected 70% of study subjects were used for model development; the rest were set aside for model validation) wasperformed and measures of model performance wereobtained from the validation set to avoid overfitting.ResultsCharacteristics of the population (Table 1)About half of the study subjects were male and 40%were insured. The mean age in 2002 was 35 years and10% were elderly. About one-third lived in the areaswithin the Taipei Branch; only 2% were from the Eastern Branch. About 64% were living in rural countyareas. Only 10% had not made any outpatient visit; 7%had at least one inpatient stay. About 90% had non-zerototal expenditures and a similar percentage had nonzero drug expenditures. Average annual total expenditures were about 14,700 NTDs, among which medicalexpenditures (10,200 NTDs) were much high than pharmacy expenditures (4,100 NTDs).C-statistics, sensitivity, and positive predictive value(Table 2)A similar trend was observed across three outcomethresholds (top 0.5%, 1%, and 5% of actual users): morecomprehensive models performed better than simplermodels in terms of C-statistics. The largest increase wasfrom model 1 to model 2 ( 0.06 point), and then frommodel 2 to model 3 ( 0.04 point); the performance ofthe most comprehensive three models were separated byonly 0.01 points. C-statistics in model 1 and 2 increasedwhile those in two prior expenditures models decreasedas outcome thresholds were relaxed; those in model 3remained similar. When the outcome was defined as top0.5%, 0.1% and 5% of actual 2003 users, c-statistics inmodel 5 reached 0.913, 0.907, and 0.897, respectively;those in model 1 were 0.773, 0.797 and 0.815,correspondingly.To calculate sensitivity and PPV, a threshold to definetop users was necessary. We used two thresholds in thisstudy for each outcome: the actual proportion of thedefined outcomes and the top 5% of identified cases.Results showed that the stricter the threshold, the lowerthe sensitivity but the higher the PPV. Similarly, sensitivity and PPV went up as the comprehensiveness of themodel increased, regardless of outcomes or thresholds.The biggest increase in sensitivity and PPV was frommodel 2 to model 3, while those in model 4 and 5 wereclose. When threshold cutoff points were fixed at thetop 5%, it showed that as outcome standards relaxed,PPV increased across all models, but sensitivityincreased in the demographics-only model and reducedin more comprehensive models.Proportion of true cases identified by risk adjustmentmodels and prior top user status (Table 3 & Figure 1)We examined three risk adjustment models that were notrelated to prior expenditures, including model 1 to model
Chang et al. BMC Health Services Research 2010, 3Page 5 of 11Table 1 Characteristics of the Taiwanese population forprospective analysesInclusion CriteriaNumber of observations2002 & 200324 month enrollment164,562Male49.35%The Insured*40.93%Mean age in 2002Age Group in 200234.980 1723.84%18 3426.83%35 4925.51%50 6414.19% 659.62%BNHI ern14.42%Kao-Pin16.03%Eastern2.27%Residence LevelSpecial Municipality21.31%CityCounty15.13%63.56%Medical Utilization 1 outpatient visit 1 inpatient time89.71%7.17% 1 pharmacy expenditures87.77% 1 total expenditures90.05%Total expenditures (NTD/yr)14,741Medical expenditures (NTD/yr)Pharmacy expenditures (NTD/yr)10,2144,108*: There are two types of beneficiaries: the insured and the dependent. Thedependent obtained its health insurance coverage through the insured.3. Less than half of top users in the current year were alsotop users in the previous year (47.9%, 44.3%, and 47.6%when the threshold for top users was set as 0.5%, 1%, and5%, respectively). The proportion of true cases identifiedby risk adjustment models (Figure 1: area a plus area b)increased as the comprehensiveness of the risk adjustmentmodel increased, regardless of outcome standards. Wealso found that the proportion of true cases that could beidentified by prior expenditures status was always largerthan that proportion by risk adjustment models (Figure 1:area c area a), especially in simple ones. In addition, theproportion of true cases identified solely by risk adjustment model (Figure 1: area a) was low, and the differencebetween three models seemed to decrease as the outcomestandards relaxed. For example, among 2003 top 1% ofactual users, only 5.08% could be identified by the demographics model, 13.82% by model 2, 31.30% by model 3,and the proportion identified by risk adjustment modelsalone was much lower: 2.64%, 5.08%, and 6.10%,respectively. Among 2003 top 5% of actual users, 25.78%could be identified by the demographic model, 36.52% bymodel 2 and 41.67% by model 3; the proportion that couldbe identified by risk adjustment model alone was similaracross three models, 10.5%.Characteristics of predicted cases by risk adjustmentmodels (Tables 4 &5)Across three outcome standards, total expenditures,drug expenditures, and top/bottom expenditures ratiogenerally increased as the comprehensiveness of the riskadjustment model increased. There was a large increasein total expenditures, drug expenditures, and top/bottom expenditures ratios from model 1 to model 2, andfrom model 2 to model 3; two models with prior expenditures stayed relatively the same. For example, whenthe outcome was the 2003 top 1% of actual users, theaverage total expenditures of the predicted top 1% ofusers increased from 54,520 NTDs in model 1 to220,395 NTDs in model 3, and then to 262,609 NTDsin model 5. Top/bottom total expenditures ratioincreased from 3.8 in model 1 to 18 in model 3, andthen to 22 in prior expenditures models (model 4 and5); top/bottom drug expenditures ratio increased from4.2 in model 1 to 9.5 in model 3, and then to 16.5 inprior expenditures models. In terms of year-2/year-1expenditures ratio, model 1 had the highest ratio amongall (1.2), model 3 had total expenditures ratio about one,while those of the remaining models were all smallerthan one, especially in model 4 and 5 (0.8 0.9).As the outcome standard was relaxed from the top0.5% to the top 5%, there was a general trend for averagetotal and drug expenditures in identified top groups bydifferent models to decrease. Such a decreasing trendbecame more obvious as the comprehensiveness of riskadjusters increased. For example, the average total expenditures in the demographically-identified top groupdecreased from 58,000 to 51,590 NTDs, but in the topgroups identified by model 5 it decreased from 391,583to 111,235 NTDs. In addition, the top/bottom expenditures ratio was much higher in total expenditures than indrug expenditures when the outcome was set at the top0.5% in all but the demographics model (30.7 for totalexpenditures and 19.3 for drug expenditures in model 5);when the outcome was set at the top 5%, however, thetop/bottom drug expenditures ratio was comparable toor higher than the total expenditures ratio (11.6 for totalexpenditures and 12.6 for drug expenditures in model 5).In addition to expenditures, we examined the prevalence of five commonly manageable diseases (asthma,hypertension, depression, COPD, and diabetes) amongpredicted top groups (Table 5). Across three outcomelevels, predicted top groups identified by diagnosis-
Chang et al. BMC Health Services Research 2010, 3Page 6 of 11Table 2 C-Statistics, sensitivity, and positive predictive value by five risk adjustment models and three outcomethresholdsModel 1:Demo (sex,ages)Model 2:ACGs &DemoModel 3:ADGs, Sel. EDCs &Demo.Model 4:2002 expenditures &Demo.Model 5:ADGs, Sel. EDCs, 2002expenditures & Demo.Outcome: 2003 top 0.5% user (N 242)Top 0.5% predictedgroupTop 5% 2Outcome: 2003 top 1% user (N 492)Top 1% predictedgroupTop 5% 3Outcome: 2003 top 5% user (N 2,467)C-Statistics0.815Top 5% 70.476PPV0.2640.3730.4190.4770.482Demo: demographic information (sex and age groups); PPV: positive predictive valueTable 3 Proportion of true cases identified by ACG models and prior expenditures status at three outcome thresholdsAmong 2003 top 0.5% user (N 242)Top 0.5% predictedIn top 0.5% predicted group onlygroup(area A*)Model 1:DemographicsModel 2:ACGs &DemographicsModel 3:ADGs, Sel., EDCs &Demographics2.07%2.89%5.79%In both groups (area B*)0.00%0.83%28.51%In 2002 top 0.5% users only (area C*)47.93%47.11%19.42%2.64%5.08%6.10%Among 2003 top 1% user (N 492)Top 1% predicted group In top 1% predicted group only (areaA*)In both groups (area B*)2.44%8.74%25.20%In 2002 top 1% users only (area C*)41.87%35.57%19.11%10.50%10.58%10.82%In both groups (area B*)15.28%25.94%30.85%In 2002 top 5% users only (area C*)32.27%21.61%16.70%Among 2003 top 5% user (N 2,467)Top 5% predicted group In top 5% predicted group only (areaA*)*: in Figure 1
Chang et al. BMC Health Services Research 2010, 3Page 7 of 11Table 4 Expenditure-related characteristics of predicted top user groups identified by five risk adjustment models atthree outcome thresholdsModel 1:DemographicsModel 2:ACGs &DemographicsModel 3:ADGs, Sel. EDCs& DemographicsModel 4:2002 Expenditures& DemographicsModel 5:ADGs, Sel. EDCs, 2002Expenditures &Demographicspredicted top 2003 average total0.5% user group expenditures58,136108,433303,755389,851391,5832003 average bottom totalexpenditures ratio4.17.723.130.730.7Top/bottom drugexpenditures ratio4.27.410.619.519.32003/2002 totalexpenditures ratio1.260.881.030.740.802003/2002 drugexpenditures ratio1.180.880.850.810.842003 average 92003 average bottom totalexpenditures ratio3.88.517.722.321.7Top/bottom drugexpenditures ratio4.27.79.516.915.92003/2002 totalexpenditures ratio1.200.931.000.760.802003/2002 drugexpenditures ratio1.170.900.890.860.882003 average 003 average bottom totalexpenditures ratio4.16.99.411.511.6Top/bottom drugexpenditures ratio4.87.59.312.612.62003/2002 totalexpenditures ratio1.150.991.000.880.912003/2002 drugexpenditures ratio1.091.021.030.980.99Outcome: 2003 top 0.5% userOutcome: 2003 top 1% userpredicted top1% user groupOutcome: 2003 top 5% userpredicted top5% user groupbased and prior-expenditures models overall had moremanageable diseases than the actual top groups. Thoseidentified by diagnosis-based models had the highestnumber of manageable conditions compared to modelsincluding prior expenditures. On average, the predictedtop 0.5% and 1% group by model 2 had 1.33 and 1.35conditions, respectively; the predicted top 5% group bymodel 3 had 1.46 conditions; the predicted top groupsby the demographic model had the lowest number ofconditions across three outcome levels (all less than 1).When looking at specific conditions, the predicted topgroups by diagnosis-based only model generally hadhigher prevalence of asthma, hypertension, and COPD;those by models including prior expenditures usuallyhad higher prevalence of depression. For example,among the predicted top 1% groups, the prevalence ofasthma, hypertension, and COPD were highest in theACG-identified groups, reaching 14%, 55.5%, and 30%,respectively; the prevalence of depression was highest inthe group identified by the model 5, reaching 8.8%. Inaddition, other than model 1 and 2, the predicted topgroups by the remaining three models had higher prevalence of five conditions as the outcome thresholdrelaxed. For example, among the top groups identified
Chang et al. BMC Health Services Research 2010, 3Page 8 of 11Table 5 Prevalence of selected diseases among predicted top user groups by five risk adjustment models at threeoutcome thresholdsActual TopModel 1:Users DemographicsModel 2:ACGs &DemographicsModel 3:ADGs, 19 EDCs &DemographicsModel 4:2002 Expenditures &DemographicsModel 5:ADGs, 19 EDCs, 2002Expenditures & 4.81%2003 Top 0.5% predicted user# 67%20.50%0.9711.3511.2561.2701.2712003 Top 1% predicted user# ionDepression2003 Top 5% predicted user# 4%24.13%22.85%23.22%by model 4, the average number of five conditionsincreased from 1.16, 1.27, to 1.29 while the thresholdwas set as 0.5%, 1%, and 5%, correspondingly.Among the predicted top groups across all outcomethresholds and diagnosis-based/prior-expenditures riskadjustment models (demographic model not included),hypertension was the most prevalent condition, withmore than 50% having hypertension; diabetes was thesecond, with about 30%; the third was COPD, rangingfrom 20% to 30%; 10% had asthma, and somewhatfewer than 10% had depression.DiscussionThe results showed that both diagnosis-based and priorexpenditures models performed much better thandemographic models in predictive modeling, based onvirtually all measures evaluated in the study (statisticsbased indicators, expenditures indicators, and prevalenceof manageable diseases in top groups identified by models). Diagnosis-based models performed better in identifying high-expenditure users with manageable diseases;prior expenditures models were better in statistics-basedindicators and identifying people with higher averageexpenditures. Prior expenditures status could correctlyidentify more actual high-expenditure users than diagnosis-based or demographics
Background: Predictive modeling presents an opportunity to contain the expansion of medical expenditures by focusing on very few people. Evaluation of how risk adjustment models perform in predictive modeling in Taiwan or Asia has been rare. The aims of this study were to evaluate the performance of different risk adjustment models