Transcription
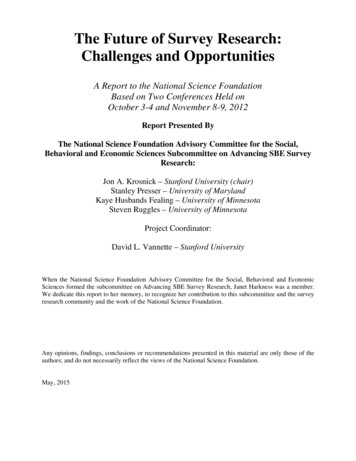
The Future of Survey Research:Challenges and OpportunitiesA Report to the National Science FoundationBased on Two Conferences Held onOctober 3-4 and November 8-9, 2012Report Presented ByThe National Science Foundation Advisory Committee for the Social,Behavioral and Economic Sciences Subcommittee on Advancing SBE SurveyResearch:Jon A. Krosnick – Stanford University (chair)Stanley Presser – University of MarylandKaye Husbands Fealing – University of MinnesotaSteven Ruggles – University of MinnesotaProject Coordinator:David L. Vannette – Stanford UniversityWhen the National Science Foundation Advisory Committee for the Social, Behavioral and EconomicSciences formed the subcommittee on Advancing SBE Survey Research, Janet Harkness was a member.We dedicate this report to her memory, to recognize her contribution to this subcommittee and the surveyresearch community and the work of the National Science Foundation.Any opinions, findings, conclusions or recommendations presented in this material are only those of theauthors; and do not necessarily reflect the views of the National Science Foundation.May, 2015
Table of ContentsTABLE OF CONTENTS . 2OVERVIEW . 4SECTION 1 – BEST PRACTICES FOR SURVEY RESEARCH . 6SECTION 2 – RECOMMENDATIONS . 12CONCLUDING REMARKS – WAYS FORWARD FOR NSF . 13REFERENCES: . 14APPENDIX: . 18DOCUMENTATION OF CONFERENCES . 18BACKGROUND . 18PRESENTERS . 22SUMMARIES OF PRESENTATIONS . 34SECTION 1: CONVENTIONAL SURVEY RESEARCH. 34Reasons for Optimism about the Accuracy of Survey Research – Jon A. Krosnick. 34Probability vs. Non-probability Sampling Methods – Gary Langer . 35Sampling for Single and Multi-Mode Surveys using Address-based Sampling - ColmO’Muircheartaigh . 39The Impact of Survey Nonresponse on Survey Accuracy – Scott Keeter. 42Optimizing Response Rates – J. Michael Brick . 44Modes of Data Collection – Roger Tourangeau. 47The Use and Effects of Incentives in Surveys – Eleanor Singer. 53Building Household Rosters Sensibly – Kathleen T. Ashenfelter . 59Proxy Reporting – Curtiss Cobb . 64Improving Question Design to Maximize Reliability and Validity – Jon A. Krosnick. 67Perception of Visual Displays and Survey Navigation – Stephen Kosslyn. 71Cognitive Evaluation of Survey Instruments: State of the Science and Future Directions – GordonWillis . 74Survey Interviewing: Deviations from the Script – Nora Cate Schaeffer . 77Challenges and Opportunities in Open-Ended Coding – Arthur Lupia . 85What Human Language Technology can do for you (and vice versa) – Mark Liberman . 90Confidentiality and Anonymity – Roger Tourangeau . 93Respondent Attrition vs. Data Attrition and Their Reduction - Randall J. Olsen. 97Computation of Survey Weights – Matthew DeBell . 99SECTION 2: OPPORTUNITIES TO EXPAND DATA COLLECTION . 102Paradata – Frauke Kreuter . 102Interviewer Observations – Brady T. West . 106Leave-behind Measurement Supplements – Michael W. Link . 109Experience Sampling and Ecological Momentary Assessment – Arthur A. Stone . 110Biomarkers in Representative Population Surveys – David Weir . 114Specialized Tools for Measuring Past Events – Robert Belli. 117SECTION 3: LINKING SURVEY DATA WITH EXTERNAL SOURCES . 121Linking Survey Data to Official Government Records – Joseph W. Sakshaug. 121Linking Knowledge Networks Web Panel Data with External Data – Josh Pasek. 1232
Linking Survey Data with the Catalist Commercial Database – Bob Blaemire . 125Election Administration Data – Michael P. McDonald . 126Challenges with Validating Survey Data – Matthew K. Berent . 128Improving Government, Academic and Industry Data-Sharing Opportunities – Robert Groves . 130SECTION 4: IMPROVING RESEARCH TRANSPARENCY AND DATA DISSEMINATION . 132Data Curation – Steven Ruggles . 132Evaluating the Usability of Survey Project Websites – David L. Vannette . 135Research Transparency and the Credibility of Survey-Based Social Science - Arthur Lupia. 139CONFERENCE WEBSITE AND ORGANIZER CONTACT INFORMATION . 142LIST OF CONFERENCE PRESENTERS . 143LIST OF CONFERENCE DISCUSSANTS . 144CONFERENCE PROGRAMS . 1453
OverviewFor more than thirty years, the National Science Foundation (NSF) has supported data forresearch on a wide variety of topics by making awards to three major long-term survey efforts,the American National Elections Studies (ANES), the Panel Study of Income Dynamics (PSID),and the General Social Survey (GSS). In February 2012, the Advisory Committee for the Social,Behavioral, and Economic Sciences (SBE) was asked to provide advice about future investmentsin these surveys and others. The Advisory Committee then charged a subcommittee to providethat advice. The Subcommittee on Advancing SBE Survey Research is comprised of JonKrosnick (Stanford University, chair), Janet Harkness (University of Nebraska, deceased), KayeHusbands-Fealing (University of Minnesota), Stanley Presser (University of Maryland), andSteven Ruggles (University of Minnesota).The Subcommittee submits this report to the Assistant Director of the SBE Directorate, with thepurpose of providing advice related to how the Foundation can best use its resources to supportresearch through survey data collection. Specifically, the report addresses the followingquestions, as requested:1. What are the challenges facing survey-based data collection today (e.g., fallingparticipation rates, rising costs, or coverage of frames)?2. What innovations in survey methodology have taken place or are on the horizon?3. How should SBE think about survey data in the context of the explosion of new digitalsources of data? Does the Subcommittee see opportunities for blending data or mixedsource methods that integrate existing administrative, commercial, or social media datawith existing surveys to answer social science questions?4. Given current challenges faced by survey research as well as the potential opportunitiespresented by new approaches to survey research, what types of questions will we be ableto address with surveys in the future?5. What is an overarching strategy for data collection that the Directorate supports(including, but not limited, to the three existing surveys), which could be used to guideplanning for NSF-supported data in the future? This might include shared infrastructureacross surveys, but should not be limited to that approach.The report addresses the first four questions – which are about the current and future status ofsurvey research in general (as opposed to uniquely about NSF funded surveys) – by drawing onthe results of presentations we commissioned from leading experts at two conferences held atNSF in the fall of 2012. An extensive summary of the conferences is included as an appendix tothis report. The fifth item in our charge – the strategic vision for SBE regarding the Big ThreeNSF surveys – was developed by the Subcommittee based on the proceedings of the conferenceand our own deliberations.4
The two conferences we convened in October 2012 brought together leading scholarly experts ontopics that fit into four broad areas. First, discussion on challenges faced in conventional surveyresearch covered a broad landscape, including key topics such as: probability versus nonprobability sampling methods; multi-mode survey techniques; optimizing response rates and hownonresponse affects survey accuracy; use of incentives in survey collection; survey design, visualdisplays and cognitive evaluation of survey instruments; proxy reporting; interviewingtechniques and challenges; confidentiality, respondent attrition and data attrition; andcomputation of survey weights.The second category of exploration focused on opportunities to expand data collection,including: paradata; the use of leave-behind measurement supplements and biomarkers; andspecialized tools for measuring past events. Third, several methods of linking survey data withexternal sources were discussed, specifically: improving government, academic and industrydata-sharing opportunities; linking survey data to official government records or with the CatalistCommercial Database; linking knowledge networks web panel data with external data; and theuse of election administration data with other datasets. Lastly, discussion turned to improvingresearch transparency and data dissemination, with a focus on: data curation; evaluating theusability of survey project websites; and the broader topic of the credibility of survey-basedsocial science. Throughout the proceedings, conference participants explored steps that can betaken to enhance the value of survey methodology to a wide range of users, in academia,government, and the private sector.Collectively, the conferences yielded several useful outcomes, including: (1) insights about howsurveys should be done today to maximize data quality (thereby specifying how majorinfrastructure surveys should be designed and carried out), (2) important challenges facing themethodology, (3) best practices in data dissemination and data collection proceduredocumentation, (4) approaches that would be most desirable for large-scale infrastructuresurveys to implement, and (5) research questions that merit future investigation.Our report is organized as follows. Section 1 summarizes best practices for survey researchrecommended by the conference participants that should be useful to NSF programs as atouchstone in evaluating research proposals involving the collection of survey data. Section 2offers a set of recommendations in response to the charge’s final (fifth) question about anoverarching strategy for NSF’s major infrastructure projects that involve the collection of surveydata. The Appendix is a rich compilation of detailed summaries of presentations at the twoconferences sponsored for this study. (For transcripts of each presentation and the visual displaysemployed during the conferences see esearchnsf.)5
Section 1 – Best Practices for Survey ResearchIn this section, we present an extensive series of recommendations for best practices based on theconference proceedings.Probability vs. Non-probability Sampling1. To make an inference from a sample to a population requires assumptions. Theseassumptions are well understood only for samples drawn with known or calculableprobabilities of selection. Thus, only such samples are widely accepted (Baker et al.,2013).Response Rates1. Researchers should carefully document nonresponse using the American Association forPublic Opinion Research (AAPOR) categories and make efforts to understand thecorrelates of nonresponse so that users of the data are alerted to potential nonresponsebias (Groves and Couper, 2012).2. Nonresponse bias is rarely notably related to nonresponse rate, so reducing nonresponsebias should usually be a more important goal than maximizing response rates (Grovesand Peytcheva, 2008).3. Refusal conversion is critical for increasing response rates and also may affect reductionsin nonresponse bias (Groves and Heeringa, 2006).4. Effective training of interviewers and other survey staff has been demonstrated toincrease response rates (Conrad et al., 2012; Durrant et al., 2010).5. Careful design of survey materials influences response rates. These materials includeinvitations, self-administered questionnaires, and other items that respondents see(Vicente and Reis, 2010).6. Incentives, particularly pre-paid monetary incentives, can notably increase response rates(Singer et al., 1999).7. Multiple contact attempts may increase response rates substantially (Keeter et al., 2000).8. Advance letters notifying household members of their invitation to participate mayincrease response rates (Link and Mokdad, 2005).9. To best understand and minimize nonresponse bias, response rates should be modeled asa stochastic process based on the association between response propensity and thecharacteristic being estimated (Brick, 2013).Data Collection Modes (e.g. telephone, web, face-to-face, etc.)1. Response rates and data quality are often highest with face-to-face surveys and lower inother modes, such as telephone interviewing, paper questionnaires, and Internet datacollection (Hox and de Leeuw, 1994).2. To minimize non-coverage in telephone surveys, both cellphones and landlines should becalled (Brick et al., 2007).3. Collecting data via multiple modes is an effective way to reduce costs and increaseresponse rates (de Leeuw, 2005).6
4. To maximize comparability between modes in a mixed-mode design, a unimode designfor the questionnaire can be implemented, avoiding design features that are not replicablein every mode used (Dillman and Christian, 2005).5. To minimize total error in mixed-mode surveys, use a responsive design framework –taking advantage of every measurement error reduction affordance available in eachmode, even if not replicable between modes (Groves and Heeringa, 2006).Survey Incentives – Paying Respondents to Participate1. To increase response rates, use pre-paid incentives (Church, 1993).2. In interviewer-mediated surveys, promised incentives typically have no effect onresponse rates (Singer, 2002).3. Additional incentives paid (differentially) to recruit people who initially refused tobecome respondents may increase response rates among these reluctant people andreduce nonresponse bias (Singer, 2002; Singer et al., 1999).Using Responses from Proxies (e.g., Household Members Other than the Respondent)1. Proxy reports can be used to reduce costs in face-to-face interviewing (Boehm, 1989).2. Proxy reports can best be used to measure observable information about the targetrespondent, rather than unobservable information such as attitudes (Cobb and Krosnick,2009).Improving Question Design to Maximize Reliability and Validity1. To reduce satisficing behavior, minimize task difficulty and maximize respondentmotivation (Krosnick, 1999).2. To reduce respondent frustration, questionnaire design should follow conversationalnorms to the greatest extent possible, e.g., via adherence to the Gricean Maxims (Grice,1975).3. Optimal approaches to questionnaire design include:a. When asking questions with numeric answers or categorical questions withunknown universes of possible answers, ask open-ended questions rather thanclosed-ended questions.b. When life forces respondents to make choices outside of the survey context, studythose choices via ranking questions rather than by asking people to rate individualobjects.4. To ensure consistent interpretation of rating scales, label all options with words and notnumbers, and ensure that the range of options covers all points on the underlyingcontinuum.5. Break bipolar rating scales into multiple questions via branching, and offer unipolarrating scales without branching.6. To optimally measure bipolar constructs, use seven-point response scales.7. To optimally measure unipolar constructs, use five-point response scales.8. Do not offer “don’t know” response options, and encourage respondents who volunteer a“don’t know” response to instead offer substantive answers.9. Rotate the order of response options on rating scales and categorical questions acrossrespondents, except when doing so would violate conversational conventions about order7
(e.g., always put positive response options before negative options, order unipolar scalesfrom most to least).10. When selecting words, choose ones that are in frequent use in popular discourse, thathave few letters and syllables, have only one primary definition (instead of two differentfrequently-used definitions), and are easy to pronounce.11. Avoid asking people to remember the opinions they held at pr
research through survey data collectionSpecifically, the report addresses the following . questions, as requested: 1. What are the challenges facing survey-based data collection today (e.g., falling participation rates, rising costs, or coverage of frames)? 2. What innovations in survey
