Transcription
KNIME for Open-Source BioImage Analysis A TutorialChristian Dietz and Michael R. BertholdAbstract The open analytics platform KNIME is a modular environment that enables easy visual assembly and interactive execution of workflows. KNIME is already widely used in various areas of research, for instance in cheminformatics orclassical data analysis. In this tutorial the KNIME Image Processing Extension isintroduced, which adds the capabilities to process and analyze huge amounts ofimages. In combination with other KNIME extensions, KNIME Image Processingopens up new possibilities for inter-domain analysis of image data in an understandable and reproducible way.1 IntroductionEvery day, research involves recording increasing numbers of images as a resultof the constantly improving imaging techniques, making them key to life scienceresearch. Advanced microscopy allows the acquisition of multidimensional imagesalmost without any user interaction and can therefore generate a plethora of heterogeneous image data. However, to make sense of the generated image data andfinally draw conclusions, an exhaustive analysis of the images has to be conducted.In addition to classical image processing techniques, more sophisticated algorithmsare increasingly being applied - from the field of machine learning and data mining(Eliceiri et al, 2012). The extracted information is then further analysed with established statistical analysis techniques. For instance, detecting objects within images(i.e. segmentation) and the detailed statistical evaluation of the collected results areChristian DietzUniversity of Konstanz, Chair for Bioinformatics and Information Mining, Universitaetsstrasse 10,78464 Konstanz, Germany e-mail: christian.dietz@uni-konstanz.deMichael R. BertholdUniversity of Konstanz, Chair for Bioinformatics and Information Mining, Universitaetsstrasse 10,78464 Konstanz, Germany e-mail: michael.berthold@uni-konstanz.de1
2Christian Dietz and Michael R. Bertholdessential stages of a typical image analysis process (Saha et al, 2013; Ljosa et al,2012; Aligeti et al, 2014). For a full exploitation of the outcome, an appropriate visualization of the information or a linkage to other information sources from otherdomains may be necessary to gain new insights.A large number of monolithic and highly task-oriented software solutions hasbeen proposed to tackle the problems that occur in each step of bio-image analysistasks (Eliceiri et al, 2012). As a result, researchers are required to choose froma set of stand-alone tools, which have to be orchestrated to solve the given task.Typically, two approaches are used that link these kinds of tools: one approach isto transfer the data manually between the tools while the other approach involveswriting a customized program or script to automate a particular process. However,these approaches typically lead to a number of critical problems. Transferring the data manually involves a human being and is therefore timeconsuming and does not scale with the amount of the acquired images. Customized scripts are prone to errors. Furthermore, results calculated with thesehighly problem-specific scripts are frequently unable to be reproduced or reusedby others.A straightforward, but infeasible solution to the described problems is to builda single monolithic platform that covers the complete range of functionalities required by a bio-image analysis workflow. However, future demands are yet unknownand therefore a closed, proprietary software solution does not scale with the newrequirements that evolve with technological advance. Therefore, the open-sourcecommunity has realized the great need for, and benefit of, closer cooperation byfostering interoperability among individual projects and open, extensible platforms.Following this approach, the open-source analytics platform KNIME (Berthold et al,2008) provides the ability to seamlessly integrate a diverse and powerful collectionof existing software tools and libraries. KNIME is a user-friendly and comprehensive open-source data integration, processing, analysis, and exploration platform designed to handle large amounts of heterogeneous data. It has been developed since2006 and is used by professionals in industry and academia. As an integration platform, KNIME directly combines the advantages of several different tools and domains. The integrated tools are encapsulated KNIME nodes, the basic processingunits in KNIME, which in turn can be combined to form so-called workflows. KNIME workflows not only inherently document the entire analysis process, but theycan also be exported and easily made available to others, who can subsequently reproduce the results or use the workflows as a starting point for their own analysis.To guarantee reproducibility, KNIME makes sure that whenever any of the modules change in any way, for example the change of a version an integrated tool, theprevious version of that module is carefully deprecated but remains part of the platform. Hence, workflows published years ago still run with the most recent releasesof KNIME. Once a workflow has been created, it can be applied to hundreds ofthousands of images and other large data sets - even on small-scale devices thanksto the intelligent caching technology of KNIME. This makes KNIME well-suitedfor high-throughput screenings, in which the analysis results can also be quite large.
KNIME for Open-Source BioImage Analysis - A Tutorial3The KNIME Image Processing Extension enhances KNIME by providing algorithms and data structures to process and analyse images. To avoid reinventing thewheel, KNIME Image Processing uses and integrates state-of-the-art libraries suchas ImageJ1 (Schindelin et al, 2012) and ImageJ21 , SCIFIO2 , OMERO (Allan et al,2012), ClearVolume (Royer et al, 2015), ImgLib2 (Pietzsch et al, 2012), CellProfiler(Kamentsky et al, 2011), TrackMate3 and others. These well-known image processing tools can not only exchange data and therefore be used in combination, it is alsopossible to link their output to other extensions from completely different domains.For example, once interesting hits have been identified in the image data, the respective molecules can be explored with one of the many KNIME cheminformaticsextensions, for instance the KNIME RDKit extension4 .An image processing and analysis workflow typically consists of a subset of several consecutive steps: Loading images, (pre)-processing, segmentation, tracking,feature extraction, model learning and the subsequent visualization and statisticalanalysis of the information gathered in the previous steps. Different problems canbe incurred in each of these steps, depending on the image analysis task itself. However, by combining KNIME Image Processing nodes with nodes from other available KNIME extensions, it is easy to orchestrate these comprehensible workflows,which can span multiple domains, to solve the issues in KNIME without needingto program a single line of code. In Section 2 the main concepts of KNIME andKNIME Image Processing are introduced. Taking this as a basis, Section 3 goes onto explain an image processing workflow example in a step by step process.2 Basic ConceptsThis section explains how KNIME and its extensions are downloaded and installed.Next, the KNIME User Interface is described, while the last part of this sectioncovers the most fundamental concepts of KNIME Image Processing, which are important for understanding the image processing workflow explained in Section 3.2.1 Download and InstallationThe open analytics platform KNIME can be downloaded and installed from theKNIME website5 . KNIME comes packed with an installer for Windows and Macsystems. Linux users simply have to extract KNIME. As KNIME is a /rdkit.http://www.knime.org.
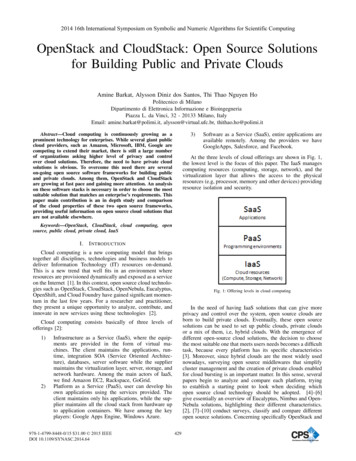
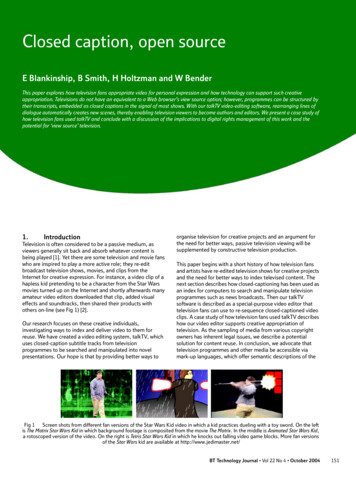
4Christian Dietz and Michael R. Bertholdbased system, there are several extensions that are not part of the basic KNIMEinstallation. These extensions are easily installed via so-called update-sites. KNIME Image Processing6 , for example, is installed from the Trusted CommunityContributions site. For details on how to install additional plugins, please seehttp://tech.knime.org/community.2.2 KNIME User InterfaceFig. 1 KNIME User InterfaceFigure 1 shows the KNIME User Interface. The KNIME Explorer (A) depictsthe various locations where workflows can be stored or uploaded. By default, twolocations are available: (i) The KNIME Example server on which several example workflows can be found. (ii) The LOCAL workspace, which was selected onthe first start-up of KNIME. A new workflow can be created with File New New KNIME Workflow. This new, empty workflow is accessed via the LOCALworkspace. Workflows in KNIME are essentially graphs that connect nodes (atomicprocessing units in KNIME), and visually model the individual processing steps ofa certain task. A Double-Click on the workflow in the KNIME Explorer (A) opens itin the Workflow Editor (C). The user is now able to drag&drop nodes from the NodeRepository (B) onto the canvas of the workflow editor, to compose complex yet clearworkflows, for example to process and analyse images. The nodes can then be connected by drawing a line from the output node to the input node, enabling the datato be passed from node to node. Additionally, each KNIME node provides a Node6http://knime.imagej.net.
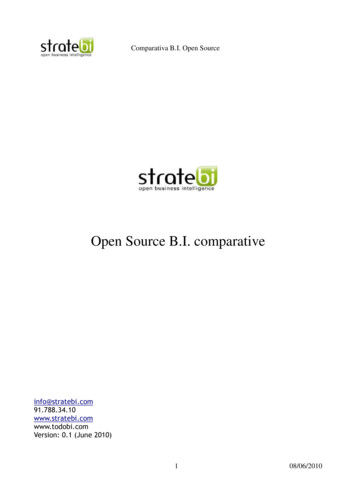
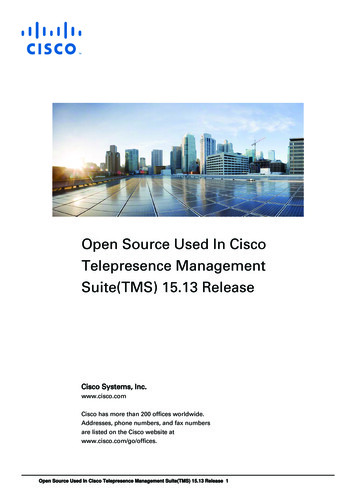
KNIME for Open-Source BioImage Analysis - A Tutorial5Description (D) explaining which input data it requires, explanations of the requiredparameters, what the node does with the incoming data and the output of the node.The Node Repository (B) contains all of the KNIME nodes that are part of the currently installed KNIME extensions. The default KNIME Open Analytics Platforminstallation provides a basic set of nodes for data manipulation, data mining, a selection of data views, node control, time series analytics and basic IO and Databasenodes. KNIME nodes for image analysis can be added by installing more KNIMEextensions, as described in Section 2.1. The KNIME Console (E) view displays errorand warning messages in order to provide feedback to the user. Finally, the Outline(F) view provides an overview of the whole workflow even if only a small part isvisible in the workflow editor and the Favorite Nodes (G) provide quick access topersonal favorite, frequently and recently used nodes.2.3 Handling of Images and Labelings in KNIMEFig. 2 A typical KNIME table with five columns. Each column of the table has a certain data-type,e.g. numbers, text, molecules or images.
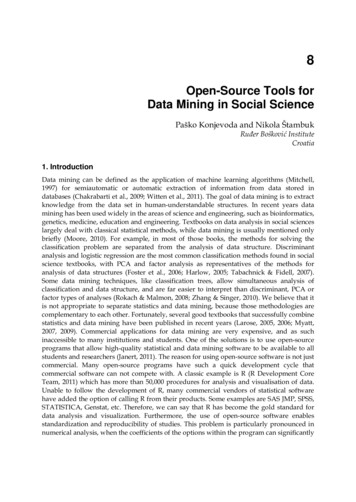
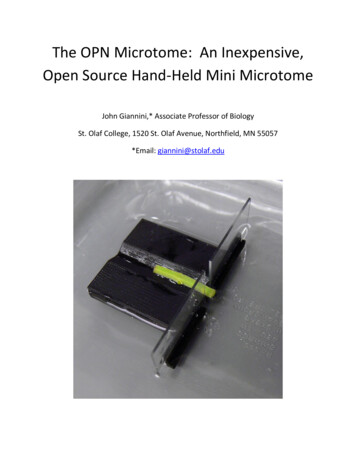
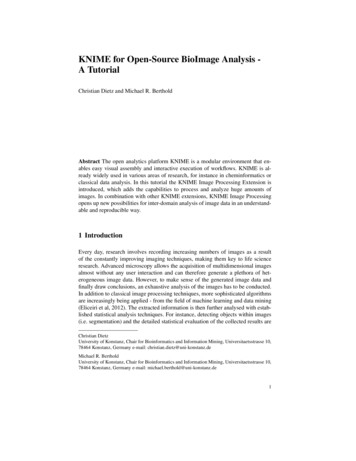
6Christian Dietz and Michael R. BertholdA workflow usually starts with a node, which represents a data source, e.g.connecting a database, reading a text file, or reading images. The data are transported between the connected nodes, typically organized in data tables, consistingof columns of certain (extensible) data-types and an arbitrary number of rows. Atypical data table is depicted in Figure 2, with each column of the table comprisingan arbitrary object type, e.g. numbers, text or molecules. KNIME Image Processingadds two new column types to the mix: images and labelings. Labelings representthe segmentation of an image - the partitioning of an image into segments. As opposed to images, labelings store one or more labels for each pixel, instead of numericvalues. A label associates each pixel with an object, class value, track number or anyother information.Contrary to what might be assumed initially, images and labelings stored in asingle cell of a data table can be of arbitrary dimensionality. For example, a table cellmay contain a multi-channel video or z-stack. To accomplish n-dimensional imageprocessing, KNIME uses ImgLib2 as its underlying programming framework.2.4 Image Processing Specific Dialog Components2.4.1 Dimension SelectionFig. 3 The configuration dialog of the Image Normalizer node.In order to provide the user with the flexibility to choose how images and labelings with more than just two dimensions are to be processed, most of the nodesprovided in the KNIME Image Processing Extension offer a so-called Dimension
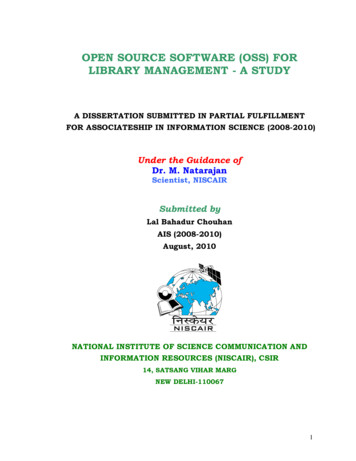
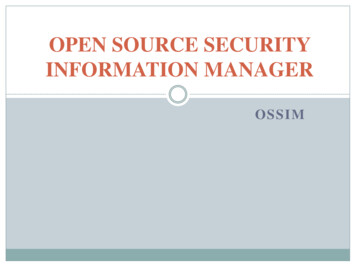
KNIME for Open-Source BioImage Analysis - A Tutorial7Selection dialog (see Figure 3). This dialog enables users to select the dimensionson which an algorithm will operate. For instance in the case of a simple Z-Stack, theImage Normalization node can be configured so as to apply normalization to eachX,Y plane either independently or for the entire X,Y,Z cube by selecting X,Y or X,Y,Zin the dimension selection.2.4.2 Column SelectionMany KNIME Image Processing nodes, whose input is an image or labeling, operateon a row-to-row basis. This means that - given an input image - another image orlabeling is calculated based on the algorithm implemented in the node. The user candetermine the layout of the output table of these nodes with a dialog componentcalled Column Selection. Generally, a user has three options: the resulting columnwith images or labelings can either be appended to the incoming table, replace theexisting column or an entirely new table can be created.2.5 Visualization of Images and LabelingsFig. 4 The KNIME Image Processing Image Viewer allows users to inspect the images in moredetail. Users can browse through the various dimensions of an image, inspect the values of thepixels and obtain information about important meta-data.
8Christian Dietz and Michael R. BertholdKNIME Image Processing enables users to explore images and labelings in moredetail, which is especially useful if an image or labeling comprises more than twodimensions (e.g. z-stacks or videos). The user can access this view by Right Click Open Image Viewer (see Figure 4) on a KNIME Image Processing node. Another,more specific view is the Interactive Segmentation View node. It can be used tovalidate segmentation, classification or tracking results as it offers an overlay viewfor imag
are increasingly being applied - from the field of machine learning and data mining (Eliceiri et al, 2012). The extracted information is then further analysed with estab-lished statistical analysis techniques. For instance, detecting objects within images (i.e. segmentation) and the detailed statistical evaluation of the collected results are Christian Dietz University of Konstanz, Chair for .