Transcription
Lab on a ChipView Article OnlinePublished on 15 February 2021. Downloaded by Politecnico di Milano on 2/19/2021 10:47:59 AM.PAPERCite this: DOI: 10.1039/d0lc01034kView JournalIntracellular label-free detection of mesenchymalstem cell metabolism within a perivascular nicheon-a-chip†Simone Perottoni,Ruslan I. Dmitriev,‡a Nuno G. B. Neto, ‡bc Cesare Di Nitto,aManuela Teresa Raimondi §a and Michael G. Monaghand§bcefThe stem cell niche at the perivascular space in human tissue plays a pivotal role in dictating the overallfate of stem cells within it. Mesenchymal stem cells (MSCs) in particular, experience influentialmicroenvironmental conditions, which induce specific metabolic profiles that affect processes of celldifferentiation and dysregulation of the immunomodulatory function. Reports focusing specifically on themetabolic status of MSCs under the effect of pathophysiological stimuli – in terms of flow velocities, shearstresses or oxygen tension – do not model heterogeneous gradients, highlighting the need for moreadvanced models reproducing the metabolic niche. Organ-on-a-chip technology offers the mostadvanced tools for stem cell niche modelling thus allowing for controlled dynamic culture conditions whileprofiling tuneable oxygen tension gradients. However, current systems for live cell detection of metabolicactivity inside microfluidic devices require the integration of microsensors. The presence of suchmicrosensors poses the potential to alter microfluidics and their resolution does not enable intracellularmeasurements but rather a global representation concerning cellular metabolism. Here, we present ametabolic toolbox coupling a miniaturised in vitro system for human-MSCs dynamic culture, which mimicsmicroenvironmental conditions of the perivascular niche, with high-resolution imaging of cell metabolism.Using fluorescence lifetime imaging microscopy (FLIM) we monitor the spatial metabolic machinery andReceived 14th October 2020,Accepted 12th February 2021DOI: 10.1039/d0lc01034krsc.li/loccorrelate it with experimentally validated intracellular oxygen concentration after designing the oxygentension decay along the fluidic chamber by in silico models prediction. Our platform allows the metabolicregulation of MSCs, mimicking the physiological niche in space and time, and its real-time monitoringrepresenting a functional tool for modelling perivascular niches, relevant diseases and metabolic-relateduptake of pharmaceuticals.IntroductionDepartment of Chemistry, Materials and Chemical Engineering “Giulio Natta”,Politecnico di Milano, Piazza Leonardo da Vinci, 32 – 20133 Milan, Italy.E-mail: simone.perottoni@polimi.it, imi.itbDepartment of Mechanical, Manufacturing and Biomedical Engineering, TrinityCollege Dublin, Dublin 2, Ireland. E-mail: monaghmi@tcd.ie, neton@tcd.iecTrinity Centre for Biomedical Engineering, Trinity Biomedical Sciences Institute,Trinity College Dublin, 152-160 Pearse Street, Dublin 2, IrelanddTissue Engineering and Biomaterials Group, Department of Human Structure andRepair, Faculty of Medicine and Health Sciences, Ghent University, Ghent 9000,Belgium. E-mail: Ruslan.Dmitriev@UGent.beeAdvanced Materials and Bioengineering Research Centre (AMBER), Royal Collegeof Surgeons in Ireland and Trinity College Dublin, Dublin, IrelandfCÚRAM, Centre for Research in Medical Devices, National University of Ireland,Galway, Newcastle Road, H91 W2TY Galway, Ireland† Electronic supplementary information (ESI) available: Supplementary figures.See DOI: 10.1039/d0lc01034k‡ Authors equally contributed to the work.§ Authors are co-corresponding.aThis journal is The Royal Society of Chemistry 2021The perivascular spaces of many organs contain adultprogenitor cell populations in a microenvironment called theperivascular stem cell niche, that presents specific conditionsto maintain multi-lineage potential and self-renewalcapacity.1,2 This is a complex and dynamic milieu, where stemcells respond to specific biochemical and mechanical cues.The perivascular niche is an open system, inhabited byheterogeneous cellular populations while physicochemicalfactors such as oxygen concentration, nutrient availability,signalling factors as well as pH, shear stress or temperature,contribute to its homeostasis.3 Dysregulation of the niche'smicroenvironment, associated with hypoxia, inflammation ormetabolic reprogramming, has recently been shown to elicitniche-related pathologies.4,5 The influence of cellularmetabolism on the overall fate of cells is eliciting a specificinterest. It has long been established that cellular metabolismis intrinsically linked to cell behaviour and phenotypic status;Lab Chip
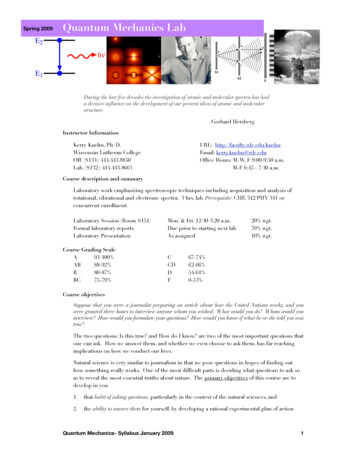
View Article OnlinePublished on 15 February 2021. Downloaded by Politecnico di Milano on 2/19/2021 10:47:59 AM.Paperwith one of the earliest historical reports in 1924 detailing theWarburg effect exhibited by cancer cells when in states ofaerobic and anaerobic metabolism.6 Only recently has theappreciation of cellular metabolism begun to gather attentionin stem cell biology; with a pivotal role of metabolic state inaccompanying cell fate towards proliferation, quiescence ordifferentiation. Shifts in the balance between a glycolyticmetabolic profile and the mitochondrial oxidativephosphorylation (OxPhos) define the contribution of adultprogenitor and stem cells to the renewal and homeostasis oftheir native tissue.7–10Among the different cell populations involved in nichehomeostasis, mesenchymal stem cells (MSCs), which aremultipotent cells present in all vascularized tissues;11 areemerging as key players in the modulation of the overallniche response and organization.12,13 Moreover, due to theirimmunomodulatory properties, human-MSCs (h-MSCs) havebeen extensively applied as therapeutic agents.14,15 However,in vitro manipulation is shown to alter cell metabolisminfluencing h-MSC's functional properties during in vitroexpansion.16 Several reports have examined the effect of flow,shear stress and pressure on stem cell differentiation andmineralisation, but reports specifically focusing on themetabolic status of cells in such conditions are ratherlacking.17–20 Despite efforts in improving standard 2D cultureprotocols,21–23 advanced tools for controlled andphysiologically relevant in vitro cultures of h-MSCs are stillnecessary for enhancing knowledge on their metabolicbehaviour both in vivo and ex vivo. Advanced in vitro modelsof the stem cell niche offer the possibility of studying directlyand manipulating human stem cell populations, withinbiomimetic microenvironments, with the potential ofproviding valid alternatives to animal models in studyingtissue renewal and pathogenesis.24 Such niche-on-a-chip(NOC) systems include fluidic devices that recapitulaterelevant feature of the in vivo niche microsystem withinfluidic channels for dynamic cell culture.25–28 These systemscan also facilitate defined mechanical stimulation (in termsof shear forces) and spatiotemporal control of biomoleculartransport by recapitulating flow velocities at interstitial levels.However, these systems do possess important limitationsin their ability to reproduce the mechanical and masstransport field variables present in a native perivascularniche. 1) Microfluidic bioreactors can be utilised to generatea controlled cellular metabolism capitulating that present inthe perivascular niche, by the engineering of a definedoxygen tension gradient29–31 that mimics the spatialoxygenation at the interface between blood vessels and thestem cell niche (Fig. 1).32,33 Standard 2D cell culture methodsare limited in that they typically impose uniform staticnormoxic or hypoxic oxygen environments. 2) Cellularmetabolism in vitro is usually assessed using end-pointstaining assays which provide intracellular quantification butare an end-point assessment that requires culture sacrifice.3) Microsensor integration within organ-on-chip platformscan enable continuous metabolic monitoring and recordingLab ChipLab on a ChipFig. 1 Mesenchymal stem cells (MSCs) reside within perivascularspaces called perivascular niches, which exert regulatory control onthe stem cells by interstitial flow levels and defined oxygen tensiongradients leading to a specific spatial metabolic profile.8by accessing the specific molecules involved in cellularmetabolism. However, such sensors often operate viaenzymatic or biochemical mechanisms which can influencethe cellular microenvironment and respiration. Thedimensions of currently available microsensors confines theiruse to extracellular readings, meaning that they are limitedto indirect assessment of global cellular metabolism.34Advanced imaging technologies are becoming valuabletools for live label-free assessment of intracellular behaviour,and can be applied for metabolic profiling at a single-celllevel.7 Among the available fluorescence microscopymethods, fluorescence lifetime imaging microscopy (FLIM)has emerged as a key technique capture interaction ofspecific biomolecules in living cells. It provides high photonefficiency, lifetime accuracy, real-time measurements, highspatial resolution, and does not require staining or labellingof fluorophores. Widespread FLIM applications consist inmapping intracellular temperature, viscosity, pH as well asmeasuring ions, glucose or oxygen concentration. FLIM cancapture the signals emitted by endogenous fluorophores suchas NAD(P)H or FAD, providing a readout of the metabolicstate of the samples under investigation.35,36Here, we present a metabolic toolbox that couples amicro-physiological system (MPS) for h-MSCs dynamicculture capable of simultaneous imaging of intracellularmetabolism at a high resolution. Predictive modelling wasemployed to engineer a declining gradient in oxygen tensionand validated using a previously calibrated non-invasiveimaging technology applicable to this miniaturised opticallyaccessible bioreactor (MOAB). Using FLIM we were able toThis journal is The Royal Society of Chemistry 2021
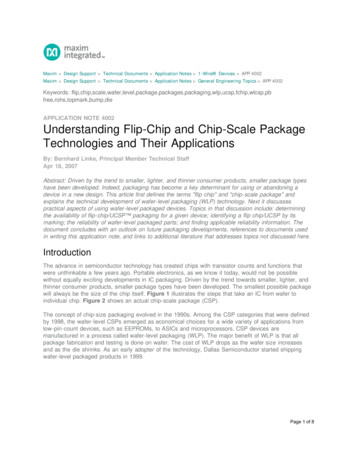
View Article OnlinePublished on 15 February 2021. Downloaded by Politecnico di Milano on 2/19/2021 10:47:59 AM.Lab on a Chipmonitor the adaptive modes of metabolic machinery employedin addition to visualising the correlating oxygenconcentrations, glucose uptake and mitochondrial membranepotential and morphology occurring at these points which werein validation with our in silico model. These results present anew method and technology to preferentially pattern an insilico-modelled metabolic gradient which will be of enormousbenefit to the community in modelling perivascular niches, therelevant diseases, and also the bioavailability and metabolismrelated uptake of pharmaceuticals. Additionally, the imagingtoolbox presented in this perivascular niche example offer thepotential to achieve multiparametric single-cell metabolicevaluation in dynamic cultures.PaperResults and discussionThe niche-on-a-chip (NOC) for stem cell metabolismmeasurementThe microbioreactor for h-MSCs culture. The cultureplatform employed in this study is a miniaturized opticallyaccessible bioreactor (MOAB), recently reported for culturingh-MSCs inside a dynamic MPS37 (Fig. 2A and B).Perfused in vitro cultures of h-MSCs have demonstratedthe influence of flow-associated shear stress on MSCscommitment to the mesengenic lineages.38,39 Here, precisecontrol enables interstitial flow velocities and low level shearforces as well as generate a transitional oxygen concentrationFig. 2 Microfluidic bioreactor and experimental setup. (A) The miniaturized optically accessible bioreactor (MOAB) device, composed of apolycarbonate (PC) body with three independent rectangular base flow chambers for cell culture and real-time high-resolution imaging. (B) “Plugand play” seeding of human-MSCs (h-MSCs) inside the fluidic chamber for interstitial-like perfusion. (C) By using MOAB a defined oxygen tensiongradient can be imposed by controlling the flow perfusion and cell density while simultaneous real-time high-resolution measurement of themetabolic activity by the detection of the bound NAD(P)H fluorescence emission can be performed. (D) Non-invasive measurement of cellularmetabolism of h-MSCs cultured inside MOAB, using a two-photon (2P) microscope fitted with fluorescence lifetime imaging microscopy (FLIM)detectors. The result is the NAD(P)H fluorescence decay and a colour coded picture indicating pools of free and enzyme-bound NAD(P)Hquantified by their respective fluorescence lifetimes fractions. The free NAD(P)H corresponds to the short τ1 lifetime with corresponding fractionα1, representative of a glycolytic profile, while the protein-bound NAD(P)H is related with the long τ2 and α2 fraction, indicating oxidativephosphorylation (OxPhos).This journal is The Royal Society of Chemistry 2021Lab Chip
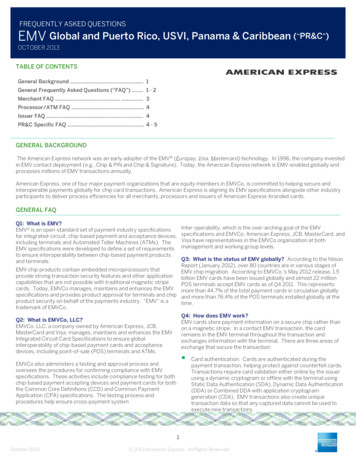
View Article OnlinePublished on 15 February 2021. Downloaded by Politecnico di Milano on 2/19/2021 10:47:59 AM.Paperprofile in space and time with the aim of mimicking aninterface representative of the one that h-MSCs experiencenear blood capillaries and within the stem cell niche.The walls of the MOAB microchambers are fabricatedfrom oxygen-impermeable polycarbonate (PC, with an oxygendiffusion coefficient of 8.0 10 8 cm2 s 1)31 thus enabling astable and linear gradient of the oxygen tension. Indeed, theonly source for free oxygen to reach inside the microchamberis the oxygenated culture medium flowing from the inlet. Thecombination of constant flow of fresh medium with theconsumption of oxygen by the cells modulates an oxygentension in the microenvironment, leading to theestablishment of a spatial oxygen gradient (Fig. tabolism. Transparent PDMS microfluidic chips permitnon-invasive optical monitoring of the MOAB microchamberfor the duration of the experimentation. However, to performhigh-resolution imaging, immersion objectives are necessaryand the refractive index (n) of the viewing surface needs to beas close as possible to that of the objectives. PDMS (with n 1.43) generates optical aberrations on the excitation laserpathway; therefore, the overall optical quality is generallypoor. Moreover, PDMS membrane thickness cannot bereduced substantially without interfering with theperformance of the device.40 We integrated a rectangularglass slide (having n 1.53 and a thickness of 0.15 mm)inside each fluidic chamber that simultaneously serves as asurface for cellular adhesion to enable high-resolutionmicroscopy. This optical setup facilitates real-timevisualisation of cellular metabolism by means of a twophoton (2P) microscope fitted with FLIM detectors (Fig. 2C).Harvesting the autofluorescence properties of NAD(P)Hprovides an insight to the metabolic state of cells.41–43 This isbased on the presence of mixed pools of free and enzymebound NAD(P)H that can be individually discernible by theirrespective fluorescence lifetimes. Here, we focused on theuse of 2P-NAD(P)H FLIM. NAD(P)H is characterised by amulti-exponential fluorescence decay, which is fitted using adouble-exponential curve with an average fluorescencelifetime (τavg) obtained from the two different statesfluorescence lifetimes and corresponding fractions (τ1–2,α1–2).44–47 A representative NAD(P)H fluorescence decay, itsfitting and residuals are shown in Fig. 2D. The free NAD(P)Hcorresponds to the short τ1 lifetime ( 0.4 ns) withcorresponding fraction α1 while the protein-bound NAD(P)His related with the long τ2 ( 1.5 ns) and α2 fraction.47–49NAD(P)H is a co-factor of important steps of the metabolicpathways, including glycolysis, OxPhos and pentosephosphate pathway.50Optimization of the MPS culture conditions. The spatialand temporal distribution of the oxygen tension across amicrofluidic chamber depends on the uniformity of theflow field and on the oxygen consumption rate of cellsexposed to this flow. A computational approach wasemployed to establish a defined perfusion regime at theinlet to create a specific oxygen gradient along the principalLab ChipLab on a Chipflow direction, while ensuring physiological physicalstimulation to cells.Prediction of interstitial flow velocities and shear stress.CFD analysis (COMSOL Multiphysics ) validated in previouswork27 predicted the velocity distribution profile and thelevels of shear stress acting in the MOAB microchamber.Interstitial flow velocities in body tissues generate fromconvective transvascular flows and are reported to rangewithin 0.1–5 μm s 1, in physiological conditions, reaching upto 10 μm s 1 during inflammation.51 Four flow rates (0.5, 2,3.5 and 5 μL min 1) were simulated, yielding average velocityvalues in the range 0.5–6 μm s 1 (Fig. 3A).The estimated wall shear stress, resulting from the flowrates applied (0.5, 2, 3.5 and 5 μL min 1), ranged from anaverage value of 0.0005 dyne per cm2, at the lowest flowrate(0.5 μL min 1), to 0.005 dyne per cm2 at the highest (5 μLFig. 3 Velocity profile, shear stress and oxygen tension inside theperivascular NOC. (A) Predicted average flow velocities and wall shearstress as function of the input flowrate. (B) Colour map of the flowvelocity and wall shear stress distribution in proximity of the cellculture surface area at an inlet flowrate of 5 μL min 1. Colour map intop view (scale bar: 1 mm). (C) Prediction of the oxygen tensiondepletion at a cell density of 8.3 104 cells per cm2 (corresponding to96 hours of culture) as function of the distance from the inlet and theinput flowrate. (D) Computed Pe number as a function of flowrateconsidering an oxygen particle at the middle height of the chamber(characteristic length L: 250 μm) in correspondence of the maxvelocity fillet on a section at 3 mm distance from the inlet. (E) Colourmaps of the single cell oxygen uptake rate spatial gradient at 0.5 μLmin 1 (top) and 5 μL min 1 (bottom) at a cell density of 8.3 104 cellsper cm2 (corresponding to 96 hours of culture). Colour maps in topview (scale bar: 1 mm). (F) Prediction of the oxygen tension depletionat a flowrate of 5 μL min 1 as function of the distance from the inletand the cell density (i.e. the day of culture).This journal is The Royal Society of Chemistry 2021
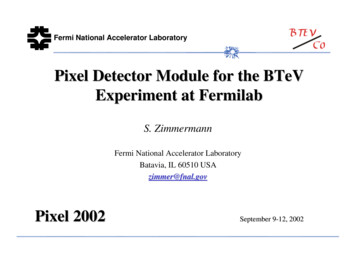
View Article OnlinePublished on 15 February 2021. Downloaded by Politecnico di Milano on 2/19/2021 10:47:59 AM.Lab on a Chipmin 1) (Fig. 3A). The highest shear stress predicted to act oncells reached 0.001 dyne per cm2 which is orders ofmagnitudes lower than the values reported for shear stressinduced MSCs differentiation.20,38,39 The velocity profiletogether with shear stress were uniformly distributed at thebottom of the culture chamber with 75% of the surfacesimulating values within a 10% variation (Fig. 3B). Thissimulation predicts equal mechanical stimulation (in termsof shear stress) to the cells.Flow-dependent oxygen concentration profile. Next, amass transport analysis was implemented (COMSOLMultiphysics ) to predict the oxygen tension profile withconsideration of h-MSCs oxygen consumption across theculture chamber. The cellular consumption rate was modelledas an oxygen sink by defining a steady state flux, dependenton cell density, along the cell adhesion surface of the MOABchamber while assuming a uniform distribution of cells.Single cell consumption rate was assumed to depend on boththe cell type and on local oxygen availability, following theMichaelis–Menten (MM) equation.52 As a boundary conditionwe imposed an oxygen partial pressure of 16.7% at the inlet ofthe MOAB chamber, based on experimental measurements.53From this simulation the oxygen concentration profilegradually decreased across the chamber given a fixed cellnumber, and its gradient rapidly decreased with flow velocity(Fig. 3C). At high flow velocity, the contribution of advectionprevailed on diffusion within the medium; and in this case itwas represented by a 90% increase of the Peclet number (Pe)at the highest flow rate (Fig. 3D). Moreover, at a fixedreference cell density of 6 104 cells per cm2, the oxygentension exponentially decreased with the flowrate due to theh-MSCs oxygen uptake. Simulating cellular O2 consumptiondecays at the two opposite flowrates (i.e. 0.5 and 5 μL min 1)highlights diverse oxygenated microenvironments as functionof the distance from the inlet (Fig. 3E).Besides the flow velocity, the other element influencingthe overall oxygen tension profile is the cell density. Weinvestigated four cell density values (41.6, 83.3, 166.6 and333.3 cells per cm2 103), representing the cells doublingduring the days of culture, at one fixed flowrate of 0.5 μLmin 1, which is the lowest in the MOAB working range. Atevery cell doubling, the oxygen tension gradient got steepergenerating always more hypoxic conditions at the chamberoutlet. After four doublings, the oxygen tension at the outletreached 0%, representing the upper limit working conditionof our system in time. This computational approachinformed the preparation of the optimal experimentalworking conditions. The numerical results demonstrated thefeasibility to simulate in vitro the varying intensities at whichfluids extravasate into the stem cell interstitium, due tochanges in blood vessel permeability.These simulations allowed us to predict oxygenconcentration by delineating the effect of varying flowrateson oxygen diffusion and the impact of cell density on theoxygen availability thus, on the overall normoxic–hypoxicgradient within this MPS.This journal is The Royal Society of Chemistry 2021PaperOxygenation levels within different body tissues andorgans vary greatly. For example, the oxygen tension in lungsand liver ranges from 13% to 10% while in bone marrow orbrain it reaches values from 7% down to 4% (ref. 29, 32, 33)or even lower (2%).54 By tuning the input flow rates of theMOAB, coupled with an appropriate cell density (relative tocellular oxygen consumption) and modelling this in silico, wewere able to recapitulate specific physiological oxygenationlevels and a predefined oxygen concentration decay along theprincipal flow direction. This represents a functional toolthat could be useful in modelling the perivascular nichepresent in various organs, besides the bone marrow nichemodelled here, which is the one primarily investigated toelucidate its role in MSCs differentiation.11,55,56Quantitative intracellular oxygen measurement. To assessand validate the predicted cell oxygen uptake gradient beingformed inside of the MOAB, we sought to experimentallyquantify intracellular oxygen. To ensure the mostphysiologically relevant measurements, we performedfluorescence intensity based measurements inside the MOABusing an intracellular phosphorescent probe.57 Specifically,we used a SI-0.2 nanosensor probe composed of fluorinebuilding blocks which act as an energy donor and an is(4bromophenyl)porphyrin (PtTFPPBr2).58 This conjugatedpolymer exhibits favourable properties to be used amultiphoton system due to its high intensity fluorescenceemission, cell permeability and Förster resonance energytransfer (FRET) properties which is impacted in varyingoxygen concentrations. At higher oxygen concentrations thisprobe is quenched, and lower amounts of energy aretransferred from the backbone to metalloporphyrin complexresulting in a decrease of emission intensity at 640–680 nm.After h-MSCs incubation with the probe for 16 hours, itwas possible to establish a calibration curve (Fig. S1†) bydetecting the fluorescence emission intensity in cases ofuptake activity in normoxic conditions and uptake when acompromised cellular oxygen consumption rate wasengineered by suppression of cells respiratory activity.h-MSCs were cultured inside the MOAB for 96 hours at aflow rate of 0.5 μL min 1 and 5 μL min 1. Afterwards, theywere stained using SI-0.2 and imaged directly in theperfused chamber with a multiphoton microscope whilemaintaining the same flow rate. Three areas of the MOABwere analysed: inlet, middle and outlet (Fig. 4A). Two imageswere acquired at the same time, one for NAD(P)H emission(as a reference signal) and another for the SI-0.2 probeemission wavelength. Afterwards, the emission intensity inthe cell area was calculated and a ratio of both acquisitionswas performed. A statistically significant increase in the ratio630/460 from the inlet area of 1.09 0.04, to 1.44 0.10 inthe middle, and finally 1.68 0.17 in the outlet area (Fig. 4B)was detected in the case of 0.5 μL min 1 while no detectablesignificant overall increase resulted in the case of 5 μL min 1.As described previously,58 an increase of the 630/460 ratio iscorrelated with decreasing oxygen levels. By applying ourLab Chip
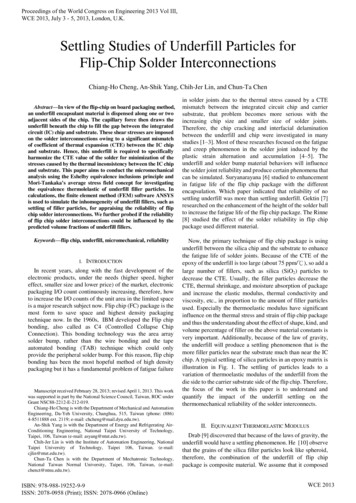
View Article OnlinePublished on 15 February 2021. Downloaded by Politecnico di Milano on 2/19/2021 10:47:59 AM.PaperLab on a ChipFig. 4 Multiphoton quantitative intracellular oxygen imaging. (A) Representative images acquired at the inlet, middle and outlet areas for both SI0.2 and NAD(P)H channels and regions of interest (red) used for quantification. (B) Fluorescence intensity ratio of SI-0.2 per NAD(P)H in the inlet,middle and outlet areas in three dynamic culture conditions (static (no flow), 0.5 μL min 1 and 0.5 μL min 1) (n 3). Statistical analysis performedusing one-way ANOVA and p 0.05. (C) Intracellular calculated oxygen tension in the different MOAB areas in three dynamic culture conditions(static (no flow), 0.5 μL min 1 and 0.5 μL min 1) (n 3). One-way ANOVA was used to detect statistical differences with *p 0.05.semi-calibration curve (Fig. S1†), it was possible to correlatethe intensity measurements of the 630/460 ratio to partialoxygen values and obtain an estimation of the intracellularoxygen levels. Here, we calculated that the inlet oxygen levelsare on average 16.6 0.4%, 13.1 1.0% in the middle and10.7 1.7% at the outlet when the system is perfused at 0.5μL min 1 with statistically significant differences betweeneach area (Fig. 4C) conversely, an increase in the flow rate to5 μL min 1 leads to oxygen levels of 15.6 0.7 at the outlet.Therefore, we were able to observe a direct effect on theintracellular oxygen levels by the flow rate and cell cultureenvironment. This result agrees with the predictions of the insilico model (Fig. 3). In this in silico model, taking as examplethe 0.5 μL min 1 group, a similar decreasing trend in oxygendistribution from the inlet ( 16.5%) to the outlet ( 11.5%)region is calculated in our model (Fig. 3C).The effect of downstream depletion of oxygen levels inmicrofluidic platforms has been previously reported.59,60Mehta et al., reported a similar approach of fluorescenceintensity measurements and observed a decreasing trend ofoxygen levels from the inlet to outlet areas of a flowbioreactor with a direct dependency on cellular density and aflow rate of 0.5 μl min 1.59 Other approaches have employedelectrode-based or extracellular fluorescence probes toquantify dissolved oxygen in cell culture medium.61–64However, these approaches lack the opportunity to quantifyintercellular oxygen concentrations directly and are moresusceptible to experimental error.59,65 Moreover, ourapproach allows direct quantification within microfluidicLab Chipcultures contained in compact system without the need ofcomplex channels geometries, multilayered structures ormodulation of gases within the culture chamber itself.31 Inorder to further validate the metabolism h-MSCs cultured inthis system, we then employed 2P-FLIM NAD(P)H to directlyevaluate the impact of this transient oxygen tension oncellular metabolism.Two-photon fluorescence lifetime imaging microscopy (2PFLIM) evaluation of cellular metabolism. 2P-NAD(P)H FLIMwas performed on the MOAB at specific locations (similar tothe intracellular oxygen measurements): inlet, middle andoutlet in order to fully delineate any metabolic heterogeneityof these cells. The MOAB was perfused at the flow rate of 0.5μL min 1 and 5 μL min 1 and was imaged after 96 hours ofculture (Fig. 5A).FLIM analysis of h-MSCs at these locations revealed adecreasing gradient in the average fluorescence lifetime whilethe protein bound NAD(P)H lifetime remains stable(Fig. 5B and C). The calculated average fluorescence lifetimefor the inlet, middle and outlet are 1.545 0.012 ns, 1.415 0.070 ns, 1.325 0.045 ns, respectively (Fig. 5). In addition,the middle and outlet values are statistically significantlydecreased when compared to inlet values. The calculatedaverage fluorescence lifetime (τavg) has been used regularly inprevious works as a unique and easy value to quicklydiscriminate between cellular metabolic states.47,66,67 Ahigher τavg is reflective of a higher fraction and/or lifetime ofthe τ2 demonstrative of a more OxPhos dependentmetabolism. These observations are illustrative of a lowerThis journal is The Royal Society of Chemistry 2021
View Article OnlinePublished on 15 February 2021. Downloaded by Politecnico di Milano on 2/19/2021 10:47:59 AM.Lab on a ChipPaperFig. 5 (A) 2P-FLIM NAD(P)H imaging of h-MSC cultured on the MOAB. Representative images of the areas imaged after 96 hours cell cultureunder 0.5 μL min 1 flow rate. (B) Average fluorescence lifetimes (τavg) calculated for the inlet, middle and outlet areas with n 4. One-way ANOVAwas used to verify statistical difference with p 0.05. (C) Normalisation of middle and outlet τavg to inlet area of the MOAB at different flow rates.An unpaired t-test was used to verify statistical difference with p 0.05. (D) Protein-bound NAD(P)H fluorescence lifetime (τ1) obtained with n 4and no statistical difference between groups, verified by one-way ANOVA. (E) Heat map of z scores (normalized according to the mean of theMOAB chamber) of NADPH autofluorescence imaging parameters of h-MSCs after 96 hours of perfused culture at 0.5 μL min 1 and 5 μL min 1 flowrates. Each row is a single cell. The data were clustered according the three areas: inlet, mid
Trinity College Dublin, 152-160 Pearse Street, Dublin 2, Ireland dTissue Engineering and Biomaterials Group, Department of Human Structure and Repair, Faculty of Medicine and Health Sciences, Ghent University, Ghent 9000, Belgium. E-mail: Ruslan.Dmitriev@UGent.be eAdvanced Materials and Bioengineering Research Centre (AMBER), Royal College