Transcription
Rapid City Regional AirportMaster Plan UpdateChapter 4 – Facility RequirementsChapter 4: Facility RequirementsIntroductionThis chapter of the Airport Master Plan analyzes the existing and anticipated future facilityneeds at the Rapid City Regional Airport (RAP). This chapter is divided into sections thatassess the needs of primary airport elements including airside facilities, passenger terminalcomplex, air cargo facilities, general aviation facilities, landside elements and supportfacilities.Airside requirements are those necessary for the operation of aircraft. Landside requirementsare those necessary to support airport, aircraft and passenger operations. Proposedrequirements are based on a review of existing conditions, capacity levels, activity demandforecasts and airport design standards using FAA guidance and industry standards. Existingfacility deficiencies are identified along with potential future facility needs. The level ofreview completed is sufficient to identify major airport elements that should be addressed inthis comprehensive airport plan.Rapid City Regional Airport is a growing airport facility as a result of a continued strongdemand as a result of regional tourism, health care, retail and financial sector growth and astrong Federal government presence. Since the last Master Plan, the airport has constructedvarious improvements including expanding passenger security screening and updating theterminal, relocating aircraft rescue and fire fighting, constructing a consolidated rental carquick turn around facility, straightening Taxiway A to correct a modification to FAA standardsand expanding apron areas.Discussions with airport management, coupled with forecasts depicting growth in all areas ofaviation led to areas of emphasis in this chapter. These include identifying future commercialairline driven needs and assuring that existing users such as cargo, USFS, general aviationhangars, SDARNG, and support facilities have sufficient room to expand. Overall, airportfacility development will be identified to adequately accommodate existing and expectedactivity levels in this Master Plan.Potential solutions to address the facility needs through the planning period are discussed inthis chapter. Specific alternatives that implement the recommendations are evaluated inChapter 5: Alternatives.Planning Activity LevelsThere are various airport activity measures used to determine facility requirements includingpassenger enplanements, peak hour and airport operations. Airport activity can be sensitiveto industry changes, national and local economic conditions. This results in difficulty inidentifying a specific calendar year for the airport to each demand levels associatedrecommended improvements. For this Master Plan, Planning Activity Levels (PALs) are used to1
Airport Master Plan UpdateRapid City Regional Airport (RAP)identify demand thresholds for recommended facility improvements. If an activity level isapproaching a PAL then the airport should prepare to implement the improvements.Alternatively, activity levels that are not approaching a PAL can allow improvements to bedeferred. The forecasts developed in the last chapter are now correlated with each PAL 1, 2 3and 4 which were 2018, 2023, 2028, and 2033 respectively.The following Table identifies the PAL metrics for the Rapid City Regional Airport.Table 4-1 – Planning Activity Levels (PALs)Planning Activity LevelsMetricPassengersAnnual EnplanementsPeak Month (12.22%)Design DayDesign Hour Departing (19.5%)Design Hour Arriving (19.5%)Design Hour Total Seats (14.3%)Passenger Airline OperationsTotal OperationsPeak MonthDesign DayDesign HourTotal OperationsTotal OperationsPeak MonthDesign DayDesign HourBasePAL 1PAL 2PAL 3PAL 927628Source: KLJ AnalysisAirside FacilitiesAirfield Design StandardsGuidance on airport design standards is found in FAA Advisory Circular 150/5300-13A, AirportDesign. Change 1 to the Advisory Circular was issued February 26, 2014 and is incorporatedinto this chapter. Airport design standards provide basic guidelines for a safe, efficient, andeconomic airport system. Careful selection of basic aircraft characteristics for which theairport will be designed is important. Airport designs based only on existing aircraft canseverely limit the ability to expand the airport to meet future requirements for larger, moredemanding aircraft. Airport designs that are based on large aircraft unlikely to operate at theairport are not economical.Design AircraftAircraft characteristics relate directly to the design components on an airport. Planning a newairport or improvements to an existing airport requires the selection of one or more “designaircraft.” FAA design standards for an airport are determined by a coding system that relates4-2
Airport Master Plan UpdateRapid City Regional Airport (RAP)the physical and operational characteristics of an aircraft to the design and safety separationdistances of the airfield facility. The design aircraft is the most demanding aircraft operatingor forecast to operate at the airport on a regular basis, which is typically considered 500annual operations. The design aircraft may be a single aircraft, or a grouping of aircraft. It isnot the usual practice to base the airport design on an aircraft that uses the airportinfrequently, thus some elements may be designed for a less demanding aircraft. The FAAtypically only provides funding for the airport to be designed to existing and forecastedcritical aircraft that are expected to exceed 500 annual operations.Other Design ConsiderationsOther airport design principles are important to consider for a safe and efficient airportdesign: Runway/Taxiway Configuration – The configuration of runways and taxiways affectsthe airport’s capacity/delay, risk of incursions with other aircraft on the runway andoverall operational safety. Airports with simultaneous operations on crossing runwayscan cause delay. Location of and type of taxiways connecting with runways correlatesto minimizing runway occupancy time. The design of taxiway infrastructure shouldpromote safety by minimizing confusing or complex geometry to reduce risk of anaircraft inadvertently entering the runway environment.Approach and Departure Airspace & Land Use – Runways have imaginary surfaces thatextend upward and outward from the runway end to protect normal flight operations.Runways also have land use standards beyond the runway end to protect the flyingpublic as well as persons and property on the ground from potential operationalhazards. Runways must meet grading and clearance standards considering natural andman-made obstacles that may obstruct these airspace surfaces. Surrounding land useshould be compatible with airport operations. Airports should develop comprehensiveland use controls to prevent new hazards outside the airport property line.Obstructions can limit the utility of a runway.Meteorological Conditions – An airport’s runways should be designed so that aircraftland and takeoff into the prevailing wind. As wind conditions change, the addition ofan additional runway may be needed to mitigate the effects of significant crosswindconditions that occur more than five percent of the year. Airports that experiencelower cloud ceiling and/or visibility should also consider implementing an instrumentprocedures and related navigational aids to runways to maximize airport utility.Controller Line of Sight – The local Airport Traffic Control Tower (ATCT) relies on aclear line of sight from the controller cab to the airport’s movement areas whichincludes the runways, taxiways, aprons and arrival/departure corridors. Structures onan airport need to consider this design standard, and in some cases require thecompletion of a shadow study to demonstrate no adverse impact.Navigation Aids & Critical Areas – Visual navigational aids (NAVAIDs) to a runway or theairfield require necessary clear areas for these NAVAIDs to be effective for pilots.Instrument NAVAIDs on an airport require sufficient clear areas for the NAVAID to4-3
Airport Master Plan UpdateRapid City Regional Airport (RAP) properly function without interference to provide guidance to pilots. These NAVAIDprotection areas restrict development.Airfield Line of Sight – Runways need to meet grading standards so that objects andaircraft can be seen along the entire runway. A clear line of sight is also required forintersecting runways within the Runway Visibility Zone to allow pilots to maintainvisual contact with other objects and/or aircraft that may pose a hazard.Interface with Landside – The airfield configuration should be designed to provide forthe safe and efficient operation of aircraft as they transition from the airfield tolandside facilities such as hangars and terminals.Environmental Factors – Airport development must consider potential impacts in andaround the airport environs through the National Environmental Policy Act (NEPA).Additionally, development should also reduce the risk of potential wildlife hazardssuch as deer and birds that may cause hazards to flight operations.Design AircraftThe design aircraft types must be identified to determine the appropriate airport designstandards to incorporate into airport planning. The design aircraft is the most demandingaircraft to operate at the airport at least 500 annual operations.Operational AnalysisExisting airport operations at Rapid City in FFY 2013 were analyzed considering potentialchanges to the design aircraft from the aviation forecasts developed in Chapter 3 from localand national aviation trends. Table 2 and 3 summarize the existing Rapid City air cargo andpassenger airline operations conducted by the most demanding or “critical” aircraft typesbased on FAA design standards.Table 4-2 – Critical Air Cargo OperationsCritical Air Cargo OperationsAircraft TypeAir CargoATR-42/72Beechcraft 99Beechcraft 1900Cessna 310Swearingen Metro IIIAACADGTDG2013 ce: Flight Aware, KLJ AnalysisNOTE: Operations counted are on an instrument flight plan. Shaded cells represent design aircraft.4-4
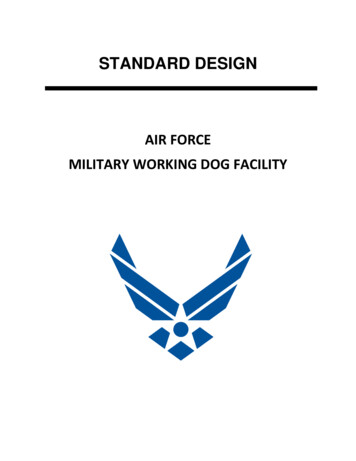
Airport Master Plan UpdateRapid City Regional Airport (RAP)Table 4-3 – Critical Passenger Airline OperationsCritical Passenger Airline OperationsAircraft TypePassenger AirlinesAirbus A319Airbus A320Boeing 717Boeing 737-700Boeing 737-800Boeing 757-200Bombardier CRJ-200Bombardier CRJ-700Bombardier CRJ-900Bombardier Q400Embraer ERJ-135Embraer ERJ-145Embraer ERJ-145XEmbraer E170Boeing (Douglas) MD-83Boeing (Douglas) MD-88Boeing (Douglas) MD-90AACADGTDG2013 4,5558262,2051051,5851,16913048620166Source: FlightAware, KLJ AnalysisNOTE: Operations counted are on an instrument flight plan. Shaded cells represent design aircraft.The most demandingBombardier Q-400aircraft for the overallairport is a CategoryD, Group III aircraft.The Category Daircraft that are eachmost heavily used atRapid City are eachscheduled by theairlines to be phasedout. These are theBombardier CRJ-200 operated by Delta, and the Boeing (Douglas) MD-83, operated byAllegiant Airlines. Since these two specific Category D aircraft are scheduled to be phased outit is recommended to work with a Category C design which there are multiple examples in thechart above. These aircraft operate on Runway 14/32.4-5
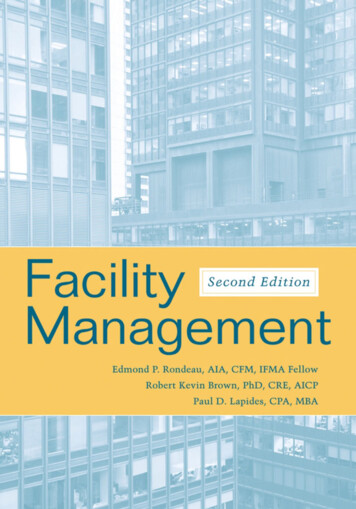
Airport Master Plan UpdateRapid City Regional Airport (RAP)The following Table depicts the critical general aviation aircraft operations.Table 4-4 – Critical General Aviation Aircraft OperationsCritical General Aviation Aircraft OperationsAircraft TypeGeneral AviationAero Commander 690Beechcraft King Air 90/100Beechcraft King Air 200/300Beechcraft King Air 350Cessna Conquest IICessna Citation I (501)Cessna Citation Mustang (510)Cessna CitationJet CJ1 (525)Cessna Citation II (550)Cessna Citation V (560)Cessna Citation Excel (560XL)Cessna Citation X (750)Eclipse 500Hawker 400Hawker 800Learjet 31/35Learjet 40/45Pilatus PC-12Piper MeridianSwearingen Merlin 3TBM 850AACADGTDG2013 39320590297224113511001,149446059Source: FlightAware, KLJ AnalysisNOTE: Operations counted are on an instrument flight plan. Shaded cells represent design aircraft.Small general aviation aircraft utilize Runway 5/23during crosswind conditions on an occasional basis. It isused when wind conditions are limiting operations onRunway 14/32 for small aircraft.The most demanding family of aircraft to use the airportare summarized in Table 4-5. This determination isadequate for the current classification of the airport as aC-III, TDG-4 facility.Table 4-5 – Design Aircraft OperationsDesign Aircraft OperationsDesign ComponentAAC-CADG-IIITDG-42013 Operations6,2333,908761Source: FlightAware, KLJ Analysis4-6Pilatus PC-12
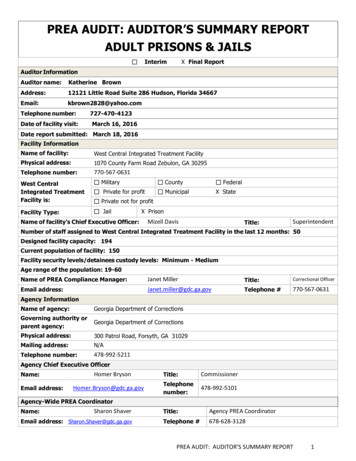
Airport Master Plan UpdateRapid City Regional Airport (RAP)Forecast TrendsThe aviation forecasts predict the overall design aircraft should be a C-III and TDG-4representing a mix of aircraft currently and projected to serve Rapid City including the AirbusA319 operated by Allegiant Airlines, the Bombardier Q400 operated by United and the Boeing717 operated by Delta. Passenger airline service aircraft are forecast to change in capacitywith overall operations remaining steady.As noted previously, newaircraft types areanticipated to beintroduced to theairport, however, theaircraft forecast do notchange the designaircraft classificationthroughout the planningperiod. The MD-83, CRJ200 and Embraer 145which currently serveRapid City are plannedto be phased out by theairlines in the shortterm. The MD-83 is beingAirbus A-320replaced by Allegiantwith A319 and A320aircraft. The CRJ 200 and Embraer 145 are each 50 passenger regional jets and all airlinesserving Rapid City are upsizing their fleet to 70 passenger aircraft as the smallest in theirfleet.Based on user input, the ATR-42 and Beechcraft 1900 turboprop aircraft are anticipated tooperate more from Rapid City for air cargo operations. This aircraft has a TDG-2 classificationthus operational surfaces utilized by this aircraft type should meet this standard.General aviation aircraft of ADG-II classification are anticipated to continue utilizing theairport. These aircraft have a maximum takeoff weight of up to 36,600 pounds. A growingRapid City business and medical community will likely contribute to increased operations overtime. Future general aviation airport facilities should plan to accommodate the designstandards for ADG-II airplanes to provide flexibility.SummaryThe design characteristics associated with the runways at Rapid City are summarized in thetable below. Additional design aircraft information will be utilized to drive the designstandards for taxiways, aprons and parking areas.4-7
Airport Master Plan UpdateRapid City Regional Airport (RAP)Table 4-6 – Airfield Design Aircraft SummaryAirfield Design Aircraft SummaryDesign CharacteristicsAircraft Make/ModelAirplane Approach CategoryAirplane Design GroupTaxiway Design GroupWingspanLengthTail HeightApproach SpeedMaximum Takeoff WeightLanding Gear ConfigurationAircraft Classification NumberTakeoff Runway Length*Landing Runway Length*Runway 14/32A319/Q400/B717CIII4117’ 5”124’ 0”38’ 7”Up to 138 knots166,000 poundsDual Wheel65/R/C/W/T18,550 feet5,800 feetRunway 5/23Single Engine PistonBI (small)149’30’20’Up to 121 knots12,500 poundsDual Wheel15/F/B/X/T24,450 feet4,450 feetSource: Boeing Airport Planning Manuals and General Aviation Aircraft evaluation, KLJ Analysis*Runway length is for planning purposes only and varies based on operation. Figure shown is based onmaximum takeoff or landing weight, wet runway (if applicable) 86.9 degrees F at Rapid City.Airfield CapacityThe total capacity of the airfield is the measure of the maximum number of aircraft arrivalsand departures capable of being accommodated for a runway and taxiway configuration.Delay occurs when operations exceed the available capacity at an airport. Airports shouldplan to provide capacity enhancements well in advance to avoid undue operational delays. Amaster planning-level analysis was completed using the methods outlined in FAA AdvisoryCircular AC 150/5060-5, Airport Capacity and Delay.Capacity is measured using various metrics: Hourly Capacity – The maximum throughput of arrivals and departures an airfield cansafely accommodate in a one-hour period.Annual Service Volume – The maximum throughput of annual operations and airfieldcan safely accommodate in one-year with an acceptable level of delay.Aircraft Delay – The difference in time between a constrained and an unconstrainedaircraft operation, measured in minutes.Input FactorsMeasuring airfield capacity is driven by many factors including aircraft fleet mix, runway useconfiguration, meteorological flight conditions and runway operational procedures. Each isThe calculations are based on a mixture of aircraft including: MD-83 (500 Annual Departures), CRJ-200 (2,000Annual Departures), ERJ-145 (2,500 Annual Departures) and A319/A320 (150 Annual Departures)2The calculations are based on a mixture of aircraft including PC-12 (3,500 Annual Departures), Citation VI/VII(24,500 Annual Departures)14-8
Airport Master Plan UpdateRapid City Regional Airport (RAP)calculated to cumulatively determine the hourly capacity and annual service volume for anairport.Aircraft Fleet MixDifferent types of aircraft operating on an airport impacts airport capacity. In addition torequired arrival and departure flow separation requirements between similar aircraft types,aircraft with different speeds create the need additional spacing requirements to maintainminimum separation. Greater spacing is also required for small aircraft to avoid waketurbulence created by larger aircraft. The airport’s fleet mix index is established using FAAguidelines. These classifications are provided in Table 4-7.Table 4-7 – Aircraft Capacity and Delay Fleet Mix ClassificationsAircraft Capacity and Delay Fleet Mix ClassificationsAircraftClassificationABCDMaximum TakeoffWeight (MTOW)Number of EnginesWake TurbulenceSingleMultiMultiMultiSmall (S)Small (S)Large (L)Heavy (H) 12,500 lbs.12,500 – 300,000 lbs. 300,000Source: FAA AC 150/5060-5, Airport Capacity and DelayThe aircraft fleet mix percentage for capacity calculations is determined by the FAA’sformula (C 3D) using aircraft fleet mix classifications. In reviewing the aviation forecasts forRapid City, the fleet mix percentage for Instrument Flight Rules (IFR) operations and VisualFlight Rule (VFR) operations are summarized in the table below. In analyzing flight activityfrom 2012 through 2013, 41.5 percent of the total operations under IFR are estimated to beconducted in Class C aircraft. Operations in Class D aircraft total 0.01 percent.Table 4-8 – Aircraft Capacity and Delay Fleet Mix IndexAircraft (Class C & D in Table 4-7) Fleet Mix PercentageMetricIFR Fleet Mix PercentageVFR Fleet Mix PercentageBase41.56%6.77%Source: FAA AC 150/5060-5, Airport Capacity and Delay, KLJ Analysis4-9PAL 441.5%6.7%
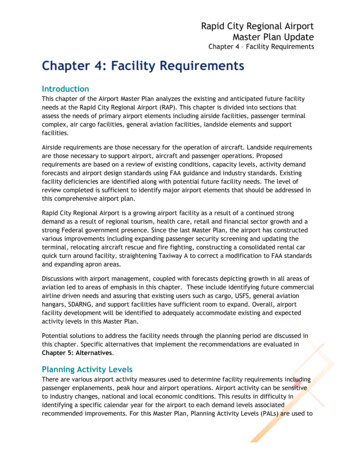
Airport Master Plan UpdateRapid City Regional Airport (RAP)Runway UseThe runway use configuration affects the operational efficiency and capacity of an airfield.An independent runway is one that can be operational and not affect arrivals and/ordepartures from other runways. A dependent runway is directly affected by the operations ofanother runway. Operations from another runway must be clear so operations on the otherrunway can safely occur. This dependent runway configuration increases wait time, reducescapacity and can increase overall delay. This is commonly seen for airfields with crossingrunways.At Rapid City, Runway 14/32 and 5/23 intersect at the north westerly portion of each runwaystotal length. See Exhibit 4-1 Runway Use Configuration. Both of these runways can handleVFR and IFR operations, arrivals and departures. The estimated runway end utilization isidentified in the table below.Table 4-9 – Runway UtilizationRunway UtilizationRunway End1432523End Utilization34.9%62.1%2.0%1.0%Runway Utilization97.0%3.0%Source: KLJ Analysis (estimate) and ATCT FeedbackBased on weather observations and operational patterns, it is assumed a single runwayscenario occurs 95.9 percent of the time during VFR conditions and 93.0 percent of the timeduring IFR conditions. Runway 5/23 is used periodically during high wind conditions as ageneral aviation runway.A unique element with Rapid City is the existence of Dan’s Airfield (FAA Identifier 4SD4)which is approximately 2,000 feet east of the airport with a runway 13/31 generally parallelbut converging to Rapid City’s primary runway. The ATCT staff advised that Dan’s Airfield isnot used often but when it is used the activity at Dan’s Airfield Runway 13/31 and RapidCity’s Runway 14/32 are treated as one runway to avoid conflicts.4-10
Airport Master Plan UpdateRapid City Regional Airport (RAP)Exhibit 4-1 – Runway Use ConfigurationSource: KLJ Analysis4-11
Airport Master Plan UpdateRapid City Regional Airport (RAP)Other ConsiderationsMeteorological conditions are a consideration for capacity calculations. An analysis of theweather observations over the past 10 years show VFR conditions are experienced 86.77percent of the time, IFR conditions within the capability of current approach minimumsexperienced 10.23 percent, and IFR conditions below current instrument approach minimumsoccurring 3.00 percent of the time.The number and location of exit taxiways were considered. Ideally spaced exit taxiways allowaircraft to expediently leave the runway environment upon landing, thus increasing airfieldcapacity. Each assumes an average of two exit taxiways spaced between 3,500 and 6,500 feetfrom the landing threshold spaced at least 750 feet apart for VFR operations and one exittaxiway between 5,000 and 7,000 feet for IFR operations. FAA determines the exit factor torange from 0.86 to 0.97, depending on runway configuration and weather conditions.Touch and go operation are those that land then takeoff on the same runway without exitingthe runway. These typically occur with small training aircraft and counts for two operations,thus increasing airfield capacity. There is not an unusually higher percentage of touch-and-gooperations at Rapid City as a result of flight training operations, thus a standard 1.00 exitfactor was applied for capacity calculations.A weighting factor is also applied per FAA guidance ranging from 1 to 25 for determiningweighted hourly capacity. Arrivals are assumed to be 50 percent of total operations.Additional arrivals causes capacity to decrease due to separation requirements.Hourly CapacityHourly capacity is calculated during IFR and VFR conditions using an FAA recommendedequation based on runway configuration, touch-and-go and taxiway exit factors. Weightedhourly capacity is determined based on runway utilization, weather conditions and an FAAweighting factor. The results for the base and PAL 4 scenarios are identified below. Assumingno change to the airfield configuration, the results are similar for the base through PAL 4 dueto a minimal change in fleet mix.Table 4-10 – Hourly CapacityHourly CapacityFactorsSingle Runway Use ScenarioVFR Hourly CapacityIFR Hourly CapacityBase, PAL 1-4 Fleet Mix7457Source: FAA AC 150/5060-5, Airport Capacity and Delay, KLJ AnalysisAnnual Service VolumeAnnual Service Volume (ASV) is an estimate of the total annual aircraft operations on anairfield annually. ASV is calculated based on the weighted hourly capacity multiplied byhourly and daily demand ratios. The ratio of the total operations to an airport’s ASVdetermines if and when an airport should plan for capacity improvements to increase overallcapacity. For Rapid City, the IFR Hourly Capacity was the most restrictive resulting in an4-12
Airport Master Plan UpdateRapid City Regional Airport (RAP)Annual Service Volume of 195,000 operations which was therefore used to determine theairport’s capacity level.Table 4-11 – Annual Service Volume (ASV)Annual Service Volume (ASV)MetricAnnual OperationsAverage Design DayAverage Design HourAnnual Service VolumeCapacity LevelBase41,35820821195,00021.2%PAL 143,28021822195,00022.2%PAL 246,61023523195,00023.9%PAL 350,39625425195,00025.8%PAL 454,75327628195,00028.1%Source: FAA AC 150/5060-5, Airport Capacity and Delay, KLJ AnalysisFAA recommends airports take action to implement capacity enhancement projects when anairport has reached 60 percent of its annual capacity. Rapid City Regional Airport is notprojected to be near 60% within the planning period.Aircraft DelayAircraft delay exists because of local weather and operational conditions and cannot beentirely eliminated. Delay is measured in minutes per aircraft and hours per year. The FAA’sassumptions identified in Advisory Circular 150/5060-5, Airport Capacity and Delay are usedto identify delay measures and estimated cost. A four-to-six minute delay per aircraft isconsidered acceptable for normal airport operations. Delay consistently approaching 10 to 15minutes per aircraft is a trigger for a new capacity-driven runway. Delay at Rapid CityRegional Airport on average does not approach these thresholds. Delay is consideredacceptable for operations into the planning period.SummaryThe purpose of this review is to provide a master planning-level review of airport capacity forlong-range planning. A review of the capacity assumptions is recommended at or before thatlevel as operational patterns may change over time. If the capacity ratio of 60 percent isreached, enhancements should be programmed into the capital improvement plan to enhancecapacity, and reduce delay. Example improvements may include additional taxiway turnoffsor high-speed exits.Meteorological ConsiderationsMeteorological conditions that affect the facility requirements of an airport include windcoverage and weather condition encountered. Metrological data at Rapid City were reviewedusing that past 10 years of data from the Rapid City Regional Airport AWOS facility from April2004 through March 2014, available from the National Climatic Data Center (NCDC). Thisprovides a comprehensive look into the average weather trends at an airport.Wind coverage and weather conditions are evaluated based on the two different flight rules,VFR and IFR. Visual Meteorological Conditions (VMC) are encountered when the visibility is 3nautical miles or greater, and the cloud ceiling height is 1,000 feet or greater. Conditions less4-13
Airport Master Plan UpdateRapid City Regional Airport (RAP)than these weather minimums are considered Instrument Meteorological Conditions (IMC)requiring all flights to be operated under IFR.Wind CoverageWind coverage is important to airfield configuration and utilization. Aircraft ideally takeoffand land into headwinds alighted with the runway orientation. Aircraft are also designed andpilots are trained to land aircraft during crosswind conditions but there are limitations. Small,light aircraft are most affected by crosswinds. To mitigate the effect of crosswinds, runwayson an airport are aligned so that they meet a minimum of 95 percent wind coverage wherecrosswind conditions are encountered 5 percent of the time or less. Each aircraft’s AAC-ADGcombination corresponds to a maximum crosswind wind speed component.Table 4-12 – Wind Coverage RequirementsWind Coverage RequirementsAAC-ADGA-I & B-IA-II & B-IIA-III, B-III, C-I through D-IIIA-IV through D-VIMaximum Crosswind Component10.5 knots13.0 knots16.0 knots20.0 knotsSource: FAA AC 150/5300-13A, Airport DesignWind coverage for the airport is separated into all-weather (VMC and IMC) and IMC alone. Allweather analysis helps determine runway orientation and use. Local weather patternscommonly change in IMC. An IMC review helps determine the runway configuration forestablishing instrument approaches.Table 4-13 – All-Weather Wind AnalysisAll-Weather Wind AnalysisRunwayAAC-ADGRunway 14/32Runway 5/23Combined*C-IIIB-I-Crosswind Component (Wind Speed)10.5 knots13.0 knots16.0 knots20.0 47%99.40%99.82%*Combined assumes up to maximum design aircraft crosswind component for each runwaySource: National Climatic Data Center data from Rapid City Regional Airport ASOS (2004-2014)The design aircraft (able to use the runway with a 16.0 knot crosswind component) isaccommodated on Runway 14/32 during all-weather conditions with airfield wind coverageexceeding 95 percent. For small aircraft that have a 10.5 knot crosswind threshold, theseairplanes can be accommodated 98.22 percent of the time with the current two-runwayconfiguration.4-14
Airport Master Plan UpdateRapid City Regional Airport (RAP)Table 4-14 – IFR Wind AnalysisIFR Wind AnalysisRunwayAAC-ADGRunway 14/32Runway 5/23Combined*C-IIIB-I-Crosswind Component (Wind Speed)10.5 knots13.0 knots16.0 knots20.0 81%99.16%99.77%*Combined assumes up to maximum design aircraft crosswind component for each runwaySource: National Climatic Data Center data from Rapid City Regional Airport ASOS (2003-2012)The design aircraft is accommodated on Runway 14/32 during IFR with airfield wind coverageexceeding 95 percent. For small aircraft that have a 10.5 knot crosswind threshold, theseairplanes can be accommodated 96.58 percent of the time with the current two-runwayconfiguration.When analyzed by runway end, Runway 32 is the preferred end by wind direction for IMCoperations, followed by 05, 14 then 23. The lowest published ins
this comprehensive airport plan. Rapid City Regional Airport is a growing airport facility as a result of a continued strong demand as a result of regional tourism, health care, retail and financial sector growth and a strong Federal government presence. Since the last Master Plan, the airport has constructed