Transcription
National HealthExpenditure Trends1975 to 2019
Production of this document is made possible by financial contributions fromHealth Canada and provincial and territorial governments. The views expressedherein do not necessarily represent the views of Health Canada or any provincialor territorial government.Unless otherwise indicated, this product uses data provided by Canada’s provincesand territories.All rights reserved.The contents of this publication may be reproduced unaltered, in whole or in partand by any means, solely for non-commercial purposes, provided that the CanadianInstitute for Health Information is properly and fully acknowledged as the copyrightowner. Any reproduction or use of this publication or its contents for any commercialpurpose requires the prior written authorization of the Canadian Institute for HealthInformation. Reproduction or use that suggests endorsement by, or affiliation with,the Canadian Institute for Health Information is prohibited.For permission or information, please contact CIHI:Canadian Institute for Health Information495 Richmond Road, Suite 600Ottawa, Ontario K2A 4H6Phone: 613-241-7860Fax: 613-241-8120cihi.cacopyright@cihi.caISBN 978-1-77109-869-4 (PDF) 2019 Canadian Institute for Health InformationHow to cite this document:Canadian Institute for Health Information. National Health Expenditure Trends,1975 to 2019. Ottawa, ON: CIHI; 2019.Cette publication est aussi disponible en français sous le titre Tendances desdépenses nationales de santé, 1975 à 2019.ISBN 978-1-77109-870-0 (PDF)
Table of contentsKey findings. . . . . . . . . . . . . . . . . . . . . . . . . . . . . . . . . . . . . . . . . . . . . . . . . . . . . . . . . . . . . . . 4About this report . . . . . . . . . . . . . . . . . . . . . . . . . . . . . . . . . . . . . . . . . . . . . . . . . . . . . . . . . . . 5Overview of health spending in Canada. . . . . . . . . . . . . . . . . . . . . . . . . . . . . . . . . . . . . . . . . . 6International comparisons . . . . . . . . . . . . . . . . . . . . . . . . . . . . . . . . . . . . . . . . . . . . . . . . . . . 10Total health expenditure by source of finance . . . . . . . . . . . . . . . . . . . . . . . . . . . . . . . . . . . . 12Health expenditure by use of funds. . . . . . . . . . . . . . . . . . . . . . . . . . . . . . . . . . . . . . . . . . . . 16Health expenditure in the provinces and territories . . . . . . . . . . . . . . . . . . . . . . . . . . . . . . . . 19Analysis. . . . . . . . . . . . . . . . . . . . . . . . . . . . . . . . . . . . . . . . . . . . . . . . . . . . . . . . . . . . . . . . . 24Appendix A: Health expenditure data in brief. . . . . . . . . . . . . . . . . . . . . . . . . . . . . . . . . . . . . 33Appendix B: Text alternative for figures. . . . . . . . . . . . . . . . . . . . . . . . . . . . . . . . . . . . . . . . . 35References . . . . . . . . . . . . . . . . . . . . . . . . . . . . . . . . . . . . . . . . . . . . . . . . . . . . . . . . . . . . . . 45
National Health Expenditure Trends, 1975 to 2019Key findingsNational Health Expenditure Trends, 1975 to 2019 — the Canadian Institute for HealthInformation’s 23rd annual health expenditure trends publication — provides detailed,updated information on health expenditure in Canada.Total health expenditure is expected to reach 264.4 billion or 7,068 per Canadianin 2019 It is anticipated that, overall, health expenditure will represent 11.6% of Canada’s grossdomestic product in 2019.In 2019, total health expenditure is expected to rise by 3.9%, a slight increase in therate of growth compared with earlier in the decade Between 2014 and 2019, health spending per capita is estimated to increase in realterms by an average of 1.4% per year. This reflects continuous economic growth andthe prospects of higher government revenues in the next few years, which may lead tosustained health spending increases in the near future.Provincial per capita health expenditures vary In 2019, total health expenditure per capita is expected to range, for example, from 8,190in Newfoundland and Labrador to 6,953 in Ontario and 6,548 in British Columbia.Physician expenditure growth fastest among 3 largest health spending categories Hospitals (26.6%), Drugs (15.3%) and Physicians (15.1%) are expected to continue toaccount for the largest shares of health dollars (close to 60% of total health spending)in 2019. Physician expenditures are expected to grow by an estimated 4.4% in 2019.Spending on hospitals in 2019 is estimated to grow by 3.0%, while drug spendinggrowth is forecast at 2.7%.Canada’s per capita health care spending among the highest internationally Among 36 countries in the Organisation for Economic Co-operation and Development(OECD) in 2018, the latest year for which comparable data is available, spending perperson on health care remained highest in the United States (CA 13,722). Canada’s percapita spending on health care was among the highest internationally, at CA 6,448 —less than in the Netherlands (CA 6,855) and Australia (CA 6,488), and more than inFrance (CA 6,436) and the United Kingdom (CA 5,275).4
National Health Expenditure Trends, 1975 to 2019About this reportNational Health Expenditure Trends, 1975 to 2019 provides an overview of how much isspent on health care annually, in what areas money is spent and on whom, and where themoney comes from. It features comparative expenditure data at the provincial/territorial andinternational levels, as well as Canadian health spending trends from 1975 to the present.Companion products to the National Health Expenditure Trends, 1975 to 2019 report areavailable on CIHI’s website at www.cihi.ca/en/nhex: National Health Expenditure Trends, 1975 to 2019 — Data Tables (.xlsx) Health Expenditures in the Private Sector — Private-Sector Chartbook, 2019 (.pptx)National Health Expenditure Trends, 1975 to 2019 — Methodology Notes (.pdf)National Health Expenditure Trends, 1975 to 2019 — InfographicsNational Health Expenditure Trends, 1975 to 2019 — Briefing Deck (.pptx)Health Expenditures in the Provinces and Territories — Provincial and TerritorialChartbook, 2019 (.pptx)How Canada Compares Internationally: A Health Spending Perspective —International Chartbook, 2019 (.pptx)Please note that, throughout the report (including text and figures), due to rounding,components may not add to the total.Please send feedback and questions to the National Health Expenditure Database (NHEX)team at nhex@cihi.ca.The Canadian Institute for Health Information (CIHI) expresses its gratitude to the NationalHealth Expenditure Expert Advisory Group for its advice and constructive comments relatedto national health expenditures: John Horne, PhD, Former Chief Operating Officer, Winnipeg Health Sciences CentreRichard Plain, PhD, University of Alberta (retired)Hu Lu, PhD, Health CanadaClaudia Sanmartin, PhD, Statistics CanadaJeremiah Hurley, PhD, McMaster UniversityMartin Demers, ministère de la Santé et des Services sociaux du QuébecLivio Di Matteo, PhD, Lakehead UniversityMichael Wolfson, PhD, University of OttawaColin Busby, Research Director, Institute for Research on Public PolicyKimberlyn McGrail, PhD, University of British ColumbiaJohn Wright, University of ReginaMichael Hunt, Director, Spending, Primary Care and Strategic Initiatives, CIHIBrent Diverty, Vice President, Programs, CIHI5
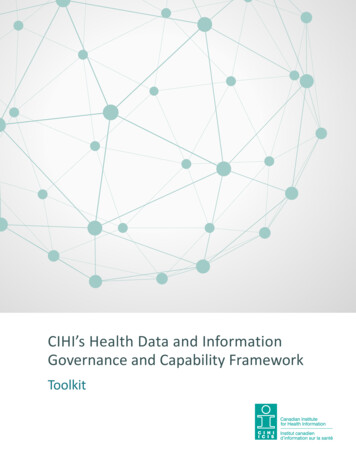
National Health Expenditure Trends, 1975 to 2019Overview of health spendingin CanadaTotal health expenditure is expected toamount to 7,068 per Canadian in 2019Health spending in Canada is projected to reach 264.4 billion in 2019, representing11.6% of Canada’s gross domestic product (GDP). This amounts to 7,068 per Canadian.Total health expenditure growth in 2019 is forecast to be 3.9% (Figure 1).Figure 1 How much will we spend on health in 2019? 264.4billion200 billion3.9%growth100 billion 7,068per 201911.6%of GDPCurrentConstant ( 1997)ForecastSourceNational Health Expenditure Database, Canadian Institute for Health Information.6
National Health Expenditure Trends, 1975 to 2019Preliminary estimates for 2018 and 2019NHEX contains actual expenditures from 1975 to 2017. To improve the timeliness of the data,health expenditures are forecast for the latest 2 years, 2018 and 2019, so that a time seriesis available up to the current year. Provincial/territorial government–sector health spendingforecasts are based on the Main Estimates and budgets published earlier in the year and arereviewed by the jurisdictions prior to publication. Forecasts for the private sector are basedon an econometric analysis of time series trends.* In the National Health Expenditure Trendsreport, preliminary estimates for 2018 and 2019 are identified in the data tables by the letter“f.” These preliminary estimates are subject to revision when actual data becomes availablein subsequent years. Therefore, users should exercise caution when interpreting trends.For quality assurance, monitoring of the performance of forecasts is done annually.One component of this analysis is a comparison of preliminary estimates with actuals whenthe data becomes available. For example, for the 2016 data year, actual provincial/territorialgovernment health expenditures in Canada were 0.7% higher than the 1-year-aheadpreliminary estimate and 1.9% higher than the 2-year-ahead preliminary estimate.A recent report by the C.D. Howe Institute found that “over the NHEX reports’ 20-yearhistory, the later numbers on average have shown provincial and territorial health expensesgrowing 0.8 percent annually faster than the preliminary estimates.”1 (p. 2)Note* See the Methodology Notes for more information.Health as a share of GDP has trended upwardIt is anticipated that, overall, health expenditure will represent 11.6% of Canada’s GDP in2019. The trend over the last 40 years shows that when there is more economic growth,there is more health care spending.7
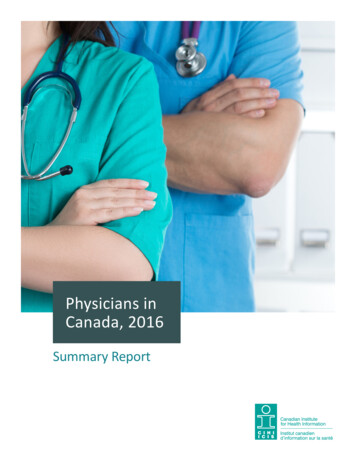
National Health Expenditure Trends, 1975 to 2019Figure 2 Total health expenditure as a percentage of GDP, Canada,1975 to 201912%Share of 007201120152019YearActualForecastNoteSee data table A.1 in the companion Excel file.SourceNational Health Expenditure Database, Canadian Institute for Health Information. 1975 to early 1990s: Health expenditure grew during this period. Total health expenditureas a proportion of GDP was 7.0% in 1975. With GDP falling during the 1982 recession,the ratio of total health expenditure to GDP increased sharply, from 6.8% in 1979 to 8.1%in 1983. The ratio continued to increase significantly, reaching 9.8% for the first time in1992 (Figure 2). Mid-1990s: As governments focused on fiscal restraint, total health expenditures grew moreslowly than GDP between 1993 and 1997. Consequently, the health-to-GDP ratio fell eachyear in that period, reaching 8.7% in 1997. Late 1990s to 2010: Major investments were made in health care. Health expenditure grewfaster than or close to GDP from 1998 to 2010, with the result that the health-to-GDP ratiotrended upward. It peaked at 11.6% in 2010. 2010 to 2014: Following the 2009 recession, governments focused on restraining programspending to manage budgetary deficits. Health spending growth was slower than or close tothe growth in the overall economy. As a result, the health-to-GDP ratio fell to 10.9% in 2014. 2014 to 2019: This has been a period of emerging growth. The health-to-GDP ratio isestimated to be 11.6% in 2019.8
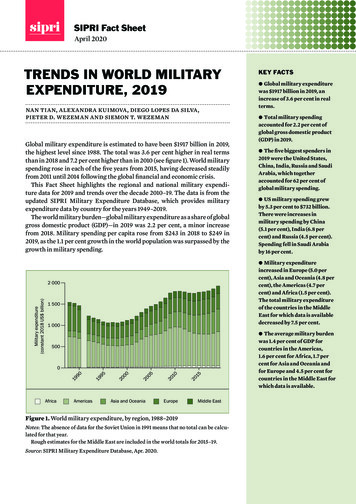
National Health Expenditure Trends, 1975 to 2019Total health expenditure in 2019 is expectedto rise by 3.9%, a slight increase in the rateof growth compared with earlier in the decadeBetween 2010 and 2014, health spending per capita decreased, in real terms, similar tothe experience during the mid-1990s (Figure 3). This was mainly due to Canada’s modesteconomic growth and fiscal restraint as governments focused on balancing budgetary deficits.Since 2014, health spending per capita has increased in real terms by an average of 1.4%per year.Figure 3 Total health expenditure per capita, annual growth rates afterinflation,* Canada, 1976 to 201910%AAG rate,1975 to 1991 2.7%8%Growth rate6%AAG rate,1996 to 2010 3.3%AAG rate,1991 to 1996 -0.5%4%AAG rate,2014 to 2019 1.4%AAG rate,2010 to 2014 ualForecastNotes* Calculated using constant 1997 dollars.AAG: Average annual growth.See data table A.1 in the companion Excel file.SourceNational Health Expenditure Database, Canadian Institute for Health Information.9AAG2008201220162019
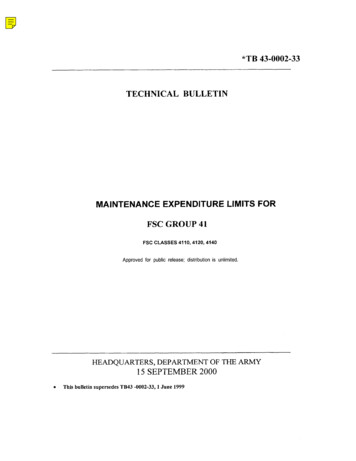
National Health Expenditure Trends, 1975 to 2019 1975 to 1991: This was a period of sustained growth in health spending. The averageannual growth rate was 2.7%, with a spike of spending growth in the early 1980s. Mid-1990s: Total health expenditure declined by an annual average rate of 0.5% during thisperiod of fiscal restraint. Late 1990s to 2010: This period of reinvestment in health care saw health spendingincrease by an average rate of 3.3% per year. 2010 to 2014: In this period of fiscal restraint, total health expenditure declined byan annual average rate of 0.01%. 2014 to 2019: This has been a period of emerging growth, and health spending per capitais estimated to increase in real terms by an average of 1.4% per year.International comparisonsCanada is among the highest spenders inthe OECDAmong 36 Organisation for Economic Co-operation and Development (OECD) countries in2018, the latest year for which comparable data is available, spending per person on healthcare remained highest in the United States (CA 13,722). Canada’s per capita spendingon health care was among the highest internationally, at CA 6,448 i — less than in theNetherlands (CA 6,855) and Australia (CA 6,488), and more than in France (CA 6,436)and the United Kingdom (CA 5,275).Although Canada is above the OECD average in terms of per-person spending onhealth care, the public-sector share of total health expenditure is below the OECDaverage (Figure 4). iii. Total health expenditure in National Health Expenditure Trends reports includes capital expenditures as well as expenditureson health research and the training of health workers with concomitant care of patients. This total differs from total currenthealth expenditure for Canada in OECD reports, which excludes these expenditures, as well as expenditures for socialservices and pastoral care in hospitals.ii. The OECD GDP figures are standardized for international comparability; consequently, the health expenditure-to-GDPratios reported by the OECD may differ from those reported by the national health accounts of member countries. Specific toCanada, the GDP estimate published by Statistics Canada contains an amount for financial intermediation services indirectlymeasured (FISIM). Statistics Canada removed the FISIM from the GDP estimate provided to the OECD. In addition, there isa time lag between both Statistics Canada’s revision of the Canadian GDP and CIHI’s revision of national health expendituredata and its publication in OECD reports.10
National Health Expenditure Trends, 1975 to 2019Figure 4 How does Canada’s health spending compare?2018(year of most recentavailable data)Per person( CA)United States*FranceGermany16.9% of GDP11.2% of GDP11.2% of GDP 13,722 6,436 daNetherlands11.0% of GDP10.7% of GDP9.9% of GDP 7,061 6,448 6,855average8.8%of GDP16%84%18%30%70%82%New ZealandUnited Kingdom 5,175Australia27%9.3% of GDP9.3% of GDP9.8% of GDP 6,488 5,085 5,27521%31%73%69%79%23%77%Notes*F or the United States, the public- and private-sector shares are for 2017, and the public-sector share of total health spendingexcludes compulsory private insurance expenditures.The public-sector share of total health spending is the sum of expenditures for government schemes and compulsoryhealth insurance.Total current expenditure (capital excluded). Expenditure data is based on the System of Health Accounts.SourceOrganisation for Economic Co-operation and Development. OECD Health Statistics 2019. 2019.11
National Health Expenditure Trends, 1975 to 2019Total health expenditure by sourceof financeAbout 70% of total health expenditure in 2019will come from public-sector fundingBoth the public and private sectors finance Canada’s health systems. Public-sector fundingincludes payments by governments at the federal, provincial/territorial and municipal levelsand by workers’ compensation boards and other social security schemes. Private-sectorfunding consists primarily of health expenditures by households and private insurance firms.Provincial and territorial government spending on health is expected to account for65.1% of total health expenditure in 2019. iii Another 5.3% will come from other parts of thepublic sector: federal direct government, municipal government and social security funds.Since 1997, the public-sector share of total health expenditure has remained relatively stableat around 70%.iii. National health expenditures are reported based on the principle of responsibility for payment rather than on the originalsource of the funds. It is for this reason that federal health transfers to the provinces/territories are included within theprovincial government sector, since it is the responsibility of provincial/territorial governments to expend federal transferson health services.12
National Health Expenditure Trends, 1975 to 2019It is estimated that private-sector spending iv will account for 30% of total health expenditurein 2019. The private sector is made up of 3 spending categories, the largest of which isexpected to be out-of-pocket spending (14.4%), followed by private health insurance (12.3%)and non-consumption v (2.9%) (Figure 5).Figure 5 Who is paying for these services?The public–private split has beenfairly consistent since the early 2000s.30%PrivateOut of pocket: 14.4%Private insurance: 12.3%Other: 2.9%30%70%70%PublicProvincial and territorialgovernments: 65.1%Other public sector: %2017SourceNational Health Expenditure Database, Canadian Institute for Health Informationiv. Private-sector spending captures payment from private sources without distinguishing between private or publicproviders of goods and services.v. Non-consumption expenditure includes a number of diverse components, such as hospital non-patient revenue,capital expenditures for privately owned facilities and health research.13
National Health Expenditure Trends, 1975 to 2019Out-of-pocket health expenditure more than 970 per personOut-of-pocket health expenditure per person increased from 278 in 1988 (the first yearfor which data at this level of detail is available) to 973 in 2017. Private health insuranceexpenditure per person increased from 139 to 824 over the same period (Figure 6).After accounting for inflation, vi the average annual growth from 1988 to 2017 for out-of-pocketspending and private insurance was 2.2% and 4.1%, respectively.Figure 6 Private-sector health expenditure per capita, source of finance,Canada, 1988, 2000 and 2017 1,200 973 1,000 824 800 600 400 504 200 0 358 278 197 139Household (out of pocket) 61Private health insurance19882000SourceNational Health Expenditure Database, Canadian Institute for Health Information.vi. The health component of the Consumer Price Index was used as a deflator.14 95Non-consumption2017
National Health Expenditure Trends, 1975 to 2019In 2017, out-of-pocket expenditure accounted for 48.8% of private-sector expenditure,down from 58.1% in 1988. Private health insurance expenditure has grown more rapidlythan out-of-pocket spending. As a result, the share of private health insurance has steadilyincreased, reaching 41.3% in 2017, up from 29.2% in 1988 (Figure 7). On the other hand,non-consumption accounted for 9.9% of private-sector health expenditure in 2017, downslightly from 12.7% in 1988.Figure 7 Share of private-sector health expenditure by source of finance,Canada, 1988 to 002003200620092012YearHousehold (out of pocket)Private health insuranceNoteSee data tables H.2, H.3 and H.4 in the companion Excel file.SourceNational Health Expenditure Database, Canadian Institute for Health Information.15Non-consumption2015 2017
National Health Expenditure Trends, 1975 to 2019Health expenditure by use of fundsPhysicians expenditure growth highest among3 largest health spending categoriesHospitals (26.6%), Drugs (15.3%) and Physicians (15.1%) are expected to continueto account for the largest shares of health dollars (close to 60% of total health spending)in 2019 (Figure 8). Although spending continues to grow in all 3 categories, the pace varies: Hospitals spending will grow by an estimated 2.0% in 2019, reaching 1,880 per person.The majority (more than 60%) of Hospitals expenditure is spent on compensation for thehospital workforce. Drugs spending is projected to be 1,078 per person, an increase of 1.8% in 2019.Physicians spending is forecast to be 1,064 per person in 2019, a growth rate of 3.5%over last year. The growth of Physicians expenditure has outpaced that for Hospitals andfor Drugs, due in part to the increased number of physicians.Figure 8 Per capita growth for Physicians will outpace that for Hospitals andfor Drugs in 2019Hospitals26.6%of healthspending 1,88015.3%Physiciansof healthspending 1,078per person2.0%Drugs1.8%of healthspending 1,064per persongrowth15.1%per persongrowth3.5%growthGrowth per personhas outpaced that forHospitals and for DrugsNotesDrug spending includes expenditures on prescribed and non-prescribed products, purchased in retail stores. Drugs dispensed inhospitals are captured in the Hospitals category. In 2017, the most recent year for which data is available, 2.3 billion was spenton drugs dispensed in hospitals (excluding Quebec and Nunavut).2Refer to the Methodology Notes for other potential sources of health spending data.SourceNational Health Expenditure Database, Canadian Institute for Health Information.16
National Health Expenditure Trends, 1975 to 2019Shifting shares of health spending over timeThe shares of health expenditure have changed over time for the 3 largest spendingcategories: Hospitals, Physicians and Drugs (Figure 9). The Hospitals spending share decreased from 44.7% of total health expenditure in themid-1970s to 26.6% in 2019. Physicians spending as a percentage of total health expenditure started edging down in1988. However, this trend reversed in the mid-2000s. Since 2005, Physicians spending asa share of total health care spending has increased, due in part to the sustained increase inthe number of physicians. In 2019, the share (15.1%) recovered to levels comparable withthose in the late 1980s. The Drugs spending share has been increasing since the mid-1980s, and this categoryhas accounted for the second-largest share (15.3% in 2019) of health spending,after Hospitals, since 1997.Figure 9 Total health expenditure, share of selected health spendingcategories, Canada, 1975 to lsPhysiciansNoteSee data table A.3.1.2 in the companion Excel file.SourceNational Health Expenditure Database, Canadian Institute for Health Information.17201120152019
National Health Expenditure Trends, 1975 to 2019Other health care goods and services account for over40% of total health spendingHealth dollars are used to purchase health care goods and services, to provide capitalinvestment, vii to administer public and private insurance plans as well as public-sectorhealth programs, and to fund research. These uses are grouped into major categories(uses of funds) throughout most of the national health expenditure data series. Of theremaining 43.1% of health expenditure — after Hospitals, Drugs and Physicians — OtherInstitutions (mainly long-term care facilities) will account for 10.9% of the total in 2019,while Other Health Professionals (dental, vision, other) will account for 10.9% (Figure 10).Figure 10 Total health expenditure per capita by health spending category, viiiCanada, 2019 (dollars and percentage share)Public Health 384, 5.4%Capital 243, 3.4%Administration 205, 2.9%OHS: Health Research 118, 1.7%Hospitals 1,880, 26.6%OHS: OtherHealth Spending 551, 7.8%Other Professionals:Other Health Professionals 171, 2.4%Other Professionals:Vision Care Services 151, 2.1%Other Professionals:Dental Services 450, 6.4%Drugs: Prescribed 918, 13.0%Other Institutions 772, 10.9%Drugs: Non-Prescribed 160, 2.3%Physicians 1,064, 15.1%NotesOHS: Other Health Spending includes a new broader definition of home and community care spending. For informationon the development of home and community care spending estimates in Canada, see the Methodology Notes.See data tables A.3.1.2 and A.3.1.3 in the companion Excel file. See the Methodology Notes for definitions.SourceNational Health Expenditure Database, Canadian Institute for Health Information.vii. Capital expenditures are obtained from Statistics Canada. The 2019 data represents capital intentions. These may berevised when actual expenditures become available. As observed by the OECD, “The level of capital expenditure tendsto fluctuate more from year to year than current spending on health services, as investment decisions can be much moredependent on economic circumstances and political or business choices as well as reflecting future needs and past levelsof investment.”3 (p. 231)viii. Administration expenditures in NHEX are related to the cost of providing health insurance programs by the government andprivate health insurance companies and all costs for the infrastructure to operate health departments. This category wouldinclude, for example, expenditures for the human resources and finance departments within ministries of health. Please seethe Methodology Notes for more details. Other data sources at CIHI such as the Canadian MIS Database (CMDB) and YourHealth System web tool capture measures of “administration” that differ. Readers should exercise caution when comparingthe different concepts across data holdings.18
National Health Expenditure Trends, 1975 to 2019Financing of health care goods and services differsServices covered under the Canada Health Act, such as those in the Hospitals and Physicianscategories, are financed mainly by the public sector, while the Drugs and Other Professionalscategories are financed primarily from private-sector sources (Figure 11).Figure 11 Public and private shares of total health expenditure, by healthspending category, Canada, ther Physicians OtherDrugsInstitutionsProfessionalsPublic-sector shareCapitalPublic Administration OtherAllHealthHealth categoriesSpendingPrivate-sector shareNotesSee data tables C.2.4 and C.3.4 in the companion Excel file. See the Methodology Notes for definitions.Other Health Spending includes public-sector home and community care expenditure; data for the private sector is not available.SourceNational Health Expenditure Database, Canadian Institute for Health Information.Health expenditure in the provincesand territoriesProvincial/territorial health expenditures varyHealth expenditure per capita varies among provinces/territories in part because ofdifferent age distributions. ix Population density and geography also affect health expenditure,particularly in the case of the territories. Other factors that affect health expenditure includeix. Provincial/territorial comparisons in this discussion are based on figures that are not adjusted for variations in age and sex.19
National Health Expenditure Trends, 1975 to 2019population health needs, the manner in which health care is delivered (including the balancebetween institutional and ambulatory care) and differences in the remuneration of health careworkers across the country. The manner in which health care is financed is also an importantconsideration, including the degree of public coverage and private insurance for services notincluded in the Canada Health Act.Health expenditure per capita is highest in the territories because of, among other things,their large geographical areas and low populations. In the provinces in 2019, total healthexpenditure per capita is forecast to range, for example, from 8,190 in Newfoundland andLabrador to 6,953 in Ontario and 6,548 in British Columbia (Figure 12). xFigure 12 How do the provinces and territories compare?CanadaY.T. 11,7330.5%N.W.T.B.C. 6,548Alta.N.L.Nun. 17,4753.4% 7,658Sask. 19,0616.2% 7,0682.9% 8,1901.6%1.5%Man. 7,4041.2%Que. 6,9355.5%P.E.I.0.3%Ont. 7,249 6,9532.3%1.7%N.S.Per person(public and private),forecasted for 2019 7,4472.6%% ofper persongrowthN.B. 7,381 7,187NoteAlberta’s provincial government had not released its Main Estimates for 2019–2020 at the time the NHEX datawas produced. As a result, 2018–2019 data was used as a proxy for 2019–2020.SourceNational Health Expenditure Database, Canadian Institute for Health Information.x. The provincial/territorial NHEX chartbook presents trends for each jurisdiction.202.8%2.5%
National Health Expenditure Trends, 1975 to 2019Standardization for age and sexSimilarities in provincial and territorial government per capita health expenditures arisein large part because of universal coverage for medically necessary hospital and physicianservices under the Canada Health Act. However, each jurisdiction has different populationage and sex profiles, which could lead to systematic differences in total health expenditure(even if per capita expenditure were virtually the same for each age and sex group).Standardizing expenditure to a common population d
Richard Plain, PhD, University of Alberta (retired) Hu Lu, PhD, Health Canada Claudia Sanmartin, PhD, Statistics Canada Jeremiah Hurley, PhD, McMaster University Martin Demers, ministère de la Santé et des Services sociaux du Québec Livio Di Matteo, PhD, Lakehead University Michael Wolfson, PhD, University of Ottawa