Transcription
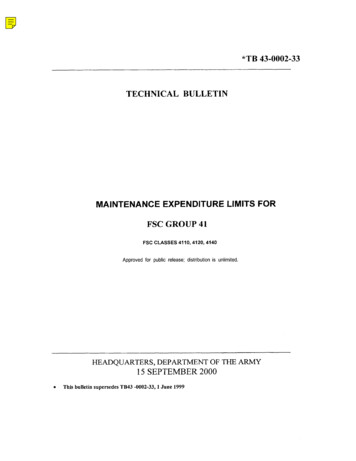
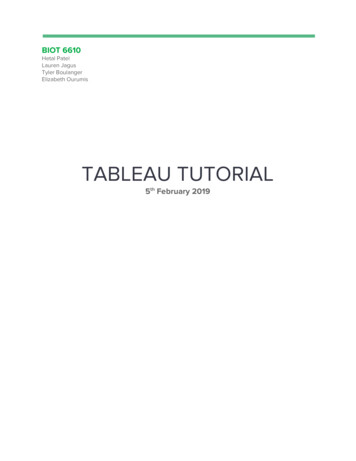
SIPRI Fact SheetApril 2020TRENDS IN WORLD MILITARYEXPENDITURE, 2019nan tian, alexandra kuimova, diego lopes da silva,pieter d. wezeman and siemon t. wezemanGlobal military expenditure is estimated to have been 1917 billion in 2019,the highest level since 1988. The total was 3.6 per cent higher in real termsthan in 2018 and 7.2 per cent higher than in 2010 (see figure 1). World militaryspending rose in each of the five years from 2015, having decreased steadilyfrom 2011 until 2014 following the global financial and economic crisis.This Fact Sheet highlights the regional and national military expenditure data for 2019 and trends over the decade 2010–19. The data is from theupdated SIPRI Military Expenditure Database, which provides militaryexpenditure data by country for the years 1949–2019.The world military burden—global military expenditure as a share of globalgross domestic product (GDP)—in 2019 was 2.2 per cent, a minor increasefrom 2018. Military spending per capita rose from 243 in 2018 to 249 in2019, as the 1.1 per cent growth in the world population was surpassed by thegrowth in military spending.Military expenditure(constant 2018 US billion)w Global military expenditurewas 1917 billion in 2019, anincrease of 3.6 per cent in realterms.w Total military spendingaccounted for 2.2 per cent ofglobal gross domestic product(GDP) in 2019.w The five biggest spenders in2019 were the United States,China, India, Russia and SaudiArabia, which togetheraccounted for 62 per cent ofglobal military spending.w US military spending grewby 5.3 per cent to 732 billion.There were increases inmilitary spending by China(5.1 per cent), India (6.8 percent) and Russia (4.5 per cent).Spending fell in Saudi Arabiaby 16 per cent.w Military expenditureincreased in Europe (5.0 percent), Asia and Oceania (4.8 percent), the Americas (4.7 percent) and Africa (1.5 per cent).The total military expenditureof the countries in the MiddleEast for which data is availabledecreased by 7.5 per cent.2 0001 5001 000500AmericasAsia and OceaniaEurope2015201052000020519919900AfricaKEY FACTSMiddle EastFigure 1. World military expenditure, by region, 1988–2019Notes: The absence of data for the Soviet Union in 1991 means that no total can be calcu lated for that year.Rough estimates for the Middle East are included in the world totals for 2015–19.Source: SIPRI Military Expenditure Database, Apr. 2020.w The average military burdenwas 1.4 per cent of GDP forcountries in the Americas,1.6 per cent for Africa, 1.7 percent for Asia and Oceania andfor Europe and 4.5 per cent forcountries in the Middle East forwhich data is available.
2sipri fact sheetTable 1. The 40 countries with the highest military expenditure in 2019Spending figures and GDP are in US , at current prices and exchange rates. Changes are in real terms, based on constant (2018) US .Percentages below 10 are rounded to 1 decimal place; those over 10 are rounded to whole numbers. Figures and percentage sharesmay not add up to stated totals or subtotals due to the conventions of rounding.Rank20192018a1122344553Subtotal top 5667987981010Subtotal top 1011111212131314141515Subtotal top 38Subtotal top 40WorldCountryUnited StatesChinaIndiaRussiaSaudi ArabiaFranceGermanyUnited KingdomJapanSouth enmarkSpending ( b.),2019732[261]71.165.1[61.9]1 19150.149.348.747.643.91 43026.926.825.922.220.51 .67.37.06.76.55.95.55.25.25.24.94.84.61 7711 917Change (%)Spending as a share of GDP 92.20.71.31.11.4.2.5World share 0.40.40.40.30.30.30.30.30.30.30.30.292100. . data not available or not applicable; [ ] SIPRI estimate; GDP gross domestic product.a Rankingsfor 2018 are based on updated military expenditure figures in the current edition of the SIPRI Military ExpenditureDatabase. They may therefore differ from the rankings for 2018 given in SIPRI Yearbook 2019 and in other SIPRI publications in 2019.b The figures for military expenditure as a share of GDP are based on estimates of 2019 GDP from the International Monetary FundWorld Economic Outlook and International Financial Statistics databases.Sources: SIPRI Military Expenditure Database, Apr. 2020; International Monetary Fund, World Economic Outlook Database, Oct.2019; and International Monetary Fund, International Financial Statistics Database, Sep. 2019.
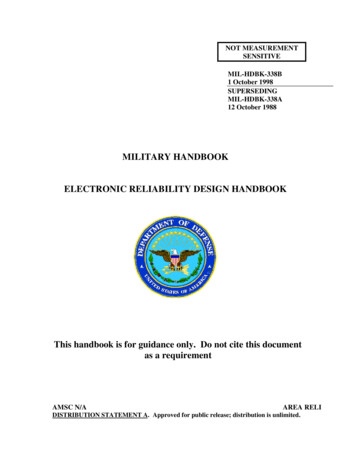
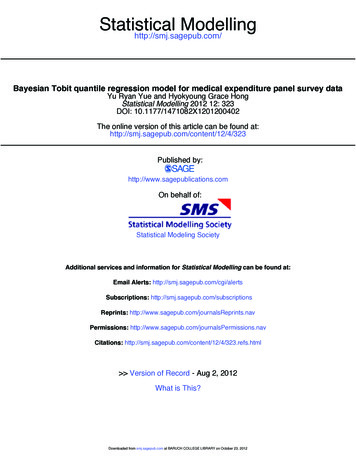
trends in world military expenditure, 20193THE TOP 15 MILITARY SPENDERS IN 2019The top 15 military spenders in the world in 2019 were the same as those in2018, but there were some significant changes in the rankings among the highest spenders (see table 1). Together, the top 15 countries spent 1553 billion in2019, accounting for 81 per cent of global military expenditure.All but three countries in the top 15 had higher military expenditure in2019 than in 2010. The exceptions were the United States (–15 per cent),the United Kingdom (–15 per cent) and Italy (–11 per cent). China’s increase(85 per cent) was by far the largest among the top 15.Among the top 15 military spenders in 2019, Japan had the lowest militaryburden: it devoted only 0.9 per cent of its GDP to military expenditure. SaudiArabia had the highest, 8.0 per cent. Among the top 15, the military burdensof Israel (5.3 per cent), Russia (3.9 per cent), the USA (3.4 per cent), SouthKorea (2.7 per cent) and India (2.4 per cent) were also higher than the globalmilitary burden.With military expenditure of 732 billion, the USA remained by far thelargest spender in the world in 2019, accounting for 38 per cent of globalmilitary spending. The USA spent almost as much on its military in 2019 asthe next 10 highest spenders combined (see figure 2).US military expenditure was 5.3 per cent higher in 2019 than in 2018 (seetable 1). This is the second year of growth in US military spending followingseven years of continuous decline—between 2010 and 2017 spending fell by22 per cent. The growth in the USA’s military spending between 2017 and2019 can be attributed to an increase in personnel costs from the recruitmentof 16 000 additional military personnel and the ongoing modernization of itsconventional and nuclear weapon inventories. However, despite the recentincreases, US military expenditure in2019 remained 15 per cent lower thanits peak in 2010 when the USA’s military burden was 4.9 per cent of GDP.China, the world’s second-largestChina, 14%military spender, is estimated to haveIndia, 3.7%allocated 261 billion to the militaryRussia, 3.4%United States, 38%in 2019—equivalent to 14 per cent ofglobal military expenditure. Its miliSaudi Arabia, 3.2%tary spending in 2019 was 5.1 per centFrance, 2.6%higher than in 2018 and 85 per centGermany, 2.6%higher than in 2010. China’s militaryUnited Kingdom, 2.5%expenditure has increased continuOthers, 19%Japan,2.5%ously since 1994 (for 25 consecutiveSouth Korea, 2.3%years). The growth in its militaryBrazil, 1.4%spending has closely matched theItaly, 1.4%country’s economic growth. BetweenAustralia, 1.4%2010 and 2019, China’s military burdenCanada, 1.2%Israel, 1.1%remained almost unchanged, at 1.9 percent of its GDP.The 6.8 per cent rise in India’s Figure 2. The share of world military expenditure of the 15 countries withmilitary spending in 2019 in combi the highest spending in 2019nation with the significant fall in Saudi Source: SIPRI Military Expenditure Database, Apr. 2020.
4sipri fact sheetTable 2. Military expenditure, by region and subregion, 2019Spending figures are in US , at current prices and exchange rates. Changes are in real terms, based on constant (2018) US . Per centages below 10 are rounded to 1 decimal place; those over 10 are rounded to whole numbers. Figures and percentage shares maynot add up to stated totals or subtotals due to the conventions of rounding.Region and subregionSpending ( b.),2019WorldAfrica aNorth AfricaSub-Saharan AfricaaAmericas bCentral America and the CaribbeanbNorth AmericaSouth AmericaAsia and Oceania cCentral AsiadEast AsiaeOceaniaSouth AsiaSouth East AsiafEuropeCentral EuropeEastern EuropeWestern EuropeMiddle East g1 535631.574.0251.Change 6.44.25.0144.93.9.2010–19World share 91.63.913. . data not available or not applicable; ( ) uncertain estimate.a Figures exclude Djibouti, Eritrea and Somalia.b Figures exclude Cuba.c Figures exclude Myanmar, North Korea, Turkmenistan and Uzbekistan.d Figures exclude Turkmenistan and Uzbekistan.e Figures exclude North Korea.f Figures exclude Myanmar.g No SIPRI estimate for the Middle East is available for 2015–19. A rough estimate for the Middle East (excluding Syria) is includedin the world total.Source: SIPRI Military Expenditure Database, Apr. 2020.Arabia’s spending (–16 per cent) over the same period meant that India rankedthird in 2019 for the first time. Saudi Arabia’s decrease and the increase inRussia’s spending (4.5 per cent) meant that Russia moved up one place in therankings, from fifth to fourth, while Saudi Arabia fell from third to fifth.At 50.1 billion, France’s military spending in 2019 was the sixth highest inthe world and the highest among states in Western Europe.Germany had the highest annual increase (10 per cent) in military spending among the top 15 spenders in 2019 and moved up two places in the rankings, from ninth to seventh.Six of the 15 highest spenders are members of the North Atlantic TreatyOrganization (NATO): the USA, France, Germany, the UK, Italy and Canada.Together, these six accounted for 48 per cent ( 929 billion) of global militaryexpenditure. Total spending by all 29 NATO members was 1035 billion in2019.
trends in world military expenditure, 20195REGIONAL TRENDSIn at least four of the world’s five regions, military expenditure increased in2019 (see table 2). The highest increase was in Europe (5.0 per cent), followedby Asia and Oceania (4.8 per cent), the Americas (4.7 per cent) and Africa(1.5 per cent). For the fifth successive year, SIPRI cannot provide an estimateof total spending in the Middle East. Of the countries in the Middle East forwhich data is available, the combined military expenditure fell by 7.5 per centin 2019.AfricaAt an estimated 41.2 billion, military expenditure in Africa accounted for2.1 per cent of the global total in 2019 (see table 2). The marginal growthin spending in 2019 was the first increase in African military expenditurefor five years. Despite the annual decreases in 2015–18, increases in otheryears meant that total African military spending grew by 17 per cent over thedecade 2010–19.Military spending by countries in North Africa is estimated to have totalled 23.5 billion in 2019, representing 57 per cent of the total for Africa. Amidlong-standing tensions between Algeria and Morocco, domestic insurgencies and continuing civil war in Libya, military spending in the subregionwas 4.6 per cent higher than in 2018 (see figure 3) and 67 per cent higher thanin 2010.Algeria’s military expenditure of 10.3 billion in 2019 was the highest inNorth Africa (and Africa as a whole) and accounted for 44 per cent of thesubregional total. Algeria’s military spending has risen almost continuouslysince 2000, and particularly in the period 2004–16, when expenditure grewfor 13 consecutive years and reached an all-time high in 2016. At 6.0 per centof its GDP, Algeria’s military burdenwas the highest in Africa in 2019.3.6%WorldMilitary spending in sub-SaharanNorth Africa4.6%Africa fell by 2.2 per cent in 2019 to–2.2%Sub-Saharan Africareach 17.7 billion, which was 15 per8.1%Central America and the CaribbeanNorthAmerica5.1%cent lower than in 2010. At 3.5 billion,South America 0.2%South Africa’s military spending wasCentral Asia16%the highest in sub-Saharan Africa inEast Asia4.6%Oceania3.5%2019. Its spending fell by 1.5 per centSouth Asia6.4%in 2019—the fourth consecutive yearSouth East Asia4.2%of decrease. Nigeria was the second- Central Europe14%Eastern Europe4.9%largest spender in the subregion inWestern Europe3.9%2019: it allocated 1.9 billion to its mili–505101520tary, down by 8.2 per cent comparedChange in military expenditure (%)with 2018 (see table 3).In recent years spending on the military by sub-Saharan African states has Figure 3. Changes in military expenditure, by subregion, 2018–19been volatile. Of the 19 countries that Note: No estimate of change in military expenditure in the Middle East is givenincreased military spending in 2019, since data for 2015–19 is highly uncertain. However, an estimate for the Middle8 decreased spending in 2018. Similarly, East is included in the estimated world total.13 of the 23 countries that lowered Source: SIPRI Military Expenditure Database, Apr. 2020.
6sipri fact sheetTable 3. The biggest relative increases and decreases in military expenditure, 2018–19Spending figures are in US , at current prices and exchange rates. Changes are in real terms, based on constant (2018) US . Per centages below 10 are rounded to 1 decimal place; those over 10 are rounded to whole numbers. Countries with military expenditurein 2019 of less than 100 m. (or 50 m. in Africa) are excluded.Rank akiaSerbiaNorth MacedoniaGuatemalaTunisiaBurkina FasoIraqJamaicaAfghanistanNew ZealandKazakhstanBrunei DarussalamSpending ( m.),20192 1271716461 8651 1441513441 0013587 5992522272 9271 766415Increase 7ZimbabweMozambiqueBeninNigerSaudi golaNigeriaCôte d’IvoireSpending ( m.),2019Decrease (%),2018–1954713768.117261 86712 6232932 5216 7301 4053 1437221 4711 8.2-8.0Source: SIPRI Military Expenditure Database, Apr. 2020.spending in 2019 had raised spending in 2018. This means that, overall, thetrend in changes by 21 of the 42 countries in the subregion for which relevantdata is available reversed in 2019.Armed conflict is a major driver for the volatile nature of military spending in sub-Saharan Africa. For example, in the Sahel and Lake Chad region,where there are several ongoing armed conflicts, military spending increasedin 2019 in Burkina Faso (22 per cent), Cameroon (1.4 per cent) and Mali(3.6 per cent) but fell in Chad (–5.1 per cent), Niger (–20 per cent) and Nigeria(–8.2 per cent). Among the Central African countries that were involved inarmed conflict, military spending rose in 2019 in the Central African Republic (8.7 per cent), the Democratic Republic of the Congo (16 per cent) andUganda (52 per cent) but fell in Burundi (–4.5 per cent). In the Horn of Africa,military spending decreased in 2019 in Ethiopia (–1.6 per cent) and Kenya(–1.7 per cent); however, their spending in 2019 remained well above that in2010: Ethiopia’s was 12 per cent higher while Kenya’s was 25 per cent higher.The AmericasMilitary expenditure in the Americas reached 815 billion in 2019 andaccounted for 43 per cent of the global total. Three countries from the regionwere among the top 15 global spenders in 2019: the USA (rank 1), Brazil(rank 11) and Canada (rank 14). Despite the 4.7 per cent overall increase in2019, military spending by states in the region was 13 per cent lower thanin 2010. At 754 billion, spending by the two countries in North America(Canada and the USA) accounted for 92 per cent of the total for the Americas.This was 5.1 per cent higher than in 2018 but 15 per cent lower than in 2010(see table 2).South America’s military expenditure was relatively unchanged in 2019, at 52.8 billion, up 0.2 per cent from 2018. This growth, albeit minor, continued
trends in world military expenditure, 20197an upward trend in military expenditure over the decade: between 2010 and2019, spending grew by 8.9 per cent. In 2019 the three main contributorsto South American military spending were Brazil (51 per cent), Colombia(19 per cent) and Chile (9.8 per cent). Together, they accounted for 80 per centof the subregion’s spending.Brazilian military expenditure fell slightly in 2019, by 0.5 per cent, aftertwo consecutive years of growth, to reach 26.9 billion. Although the overalllevel of military expenditure remained relatively unaltered in 2019, important changes took place in spending categories. Personnel costs, for example,showed the largest annual increase in over a decade, as part of a plan to boostmilitary salaries.Total military expenditure by states in Central America and the Caribbeanwas 8.7 billion in 2019. Military spending in the subregion increased by8.1 per cent in 2019 and by 49 per cent over the decade 2010–19.Mexico’s military spending accounted for 75 per cent of the subregionaltotal. At 6.5 billion, it was 7.9 per cent higher than in 2018. The growth waslargely due to the costs associated with the government’s strategy of usingthe military to combat drug cartels.Asia and OceaniaMilitary spending in Asia and Oceania was 523 billion in 2019 and accountedfor 27 per cent of the global total (see table 2). Five of the top 15 global spenders in 2019 are in Asia and Oceania: China (rank 2), India (rank 3), Japan(rank 9), South Korea (rank 10) and Australia (rank 13).The 4.8 per cent rise in the region’s military spending in 2019 continued anuninterrupted upward trend dating back to at least 1989. Asia and Oceaniais the only region with continuous growth since 1989 and the growth of51 per cent over the decade 2010–19 was by far the largest of any region. Theincrease was due primarily to the rise in Chinese military spending, whichin 2019 accounted for 50 per cent of total spending in the region, up from36 per cent in 2010.There were substantial increases in all of Asia and Oceania’s subregionsbetween 2018 and 2019 and over the decade 2010–19 (see figure 3 andtable 2). Over both periods, the highest level of increase was in Central Asia(63 per cent in 2010–19 and 16 per cent in 2018–19).At 71.1 billion, India had the highest military spending in South Asiain 2019. It was 6.8 per cent higher in 2019 than in 2018. India’s militaryexpenditure has risen significantly over the past few decades. It grew by259 per cent over the 30-year period 1990–2019 and by 37 per cent over thedecade 2010–19. However, its military burden fell from 2.7 per cent of GDP in2010 to 2.4 per cent in 2019.India’s tensions and rivalry with China and Pakistan are among the majordrivers for its increased military spending. Pakistan’s own military expenditure rose by 70 per cent over the decade 2010–19, to reach 10.3 billion. Its military burden increased from 3.4 per cent of GDP in 2010 to 4.0 per cent in 2019.In addition to China, Japan and South Korea are the largest militaryspenders in East Asia. Military spending by Japan was 47.6 billion in2019, 0.1 per cent lower than in 2018. Its spending increased by 2.0 per centbetween 2010 and 2019. In South Korea the upward trend in military
8sipri fact sheetspending since 2000 continued. In 2019 its military spending reached 43.9 billion, an increase of 7.5 per cent on 2018 and of 36 per cent on 2010.Australia is by far the largest military spender in Oceania and its militaryexpenditure in 2019 was 25.9 billion. This was 2.1 per cent higher than in2018 and 23 per cent higher than in 2010. Australia perceives heightenedmilitary threats in its neighbourhood, including from China, and globally.Military spending in South East Asia increased by 4.2 per cent in 2019 toreach 40.5 billion, after a 4.1 per cent fall in 2018. Over the decade 2010–19spending increased by 34 per cent. Seven of the eight states in the subregionfor which data is available increased their military spending between 2010and 2019. The largest spenders in the subregion in 2019 were Singapore(28 per cent of the subregional total), Indonesia (19 per cent) and Thailand(18 per cent). For several states the increases in the past decade are partlyto pay for expansion of the capabilities of their armed forces as a reaction toChinese claims and activities in the South China Sea.EuropeTotal military spending in Europe in 2019 was 356 billion, 5.0 per centhigher than in 2018 and 8.8 per cent higher than in 2010. Europe accountedfor around 19 per cent of global military expenditure in 2019, making it thethird-largest spending region after the Americas and Asia and Oceania. Fiveof the world’s 15 largest military spenders are in Europe: Russia (rank 4),France (rank 6), Germany (rank 7), the UK (rank 8) and Italy (rank 12).Box 1. Estimating military expenditure for Germany and the United KingdomThere are differences in the definitions countries use for reporting on military expenditure. SIPRI has therefore adopted its owndefinition as a guideline (see ‘The SIPRI Military Expenditure Database, sources and methods’). However, this means that therecan be differences between SIPRI’s estimates and the official data reported by countries. For example, SIPRI’s annual estimatesof military spending for Germany and the United Kingdom are significantly lower than the ‘defence expenditure’ figures thatthey report to the North Atlantic Treaty Organization (NATO). The gap between the SIPRI estimates for these countries andtheir NATO data has widened in recent years.GermanySIPRI’s estimate of German military expenditure in 2019 is 3.3 billion lower than the ‘defence expenditure’ figure Germanyreported to NATO for that year. This is explained by the fact that the SIPRI total only includes spending by the German Ministryof Defence (MOD) and some minor spending on military activities by other ministries. In its ‘defence expenditure’ figure forNATO, Germany also includes spending on non-military efforts linked to sustaining peace and security, such as humanitarianand development aid in the context of crisis and peacebuilding and conflict resolution activities. However, the exact details of theGerman submission to NATO are confidential and it is therefore impossible to assess how much of the 3.3 billion is accountedfor by these non-military activities and whether it covers other unidentified military activities that are not included in the SIPRItotal.United KingdomSIPRI’s estimate of the UK’s military expenditure in 2019 is 11.2 billion lower than the figure for ‘defence expenditure’ reportedto NATO by the UK. The SIPRI figure is based on public data on expenditure by the British MOD. Other sources, including anassessment by the House of Commons covering 2017, indicate that between 3–4 billion of the NATO figure might be attributableto military pension payments that are in addition to the reported expenditure by the MOD. These are not included in the SIPRIestimate because consistent spending data for the pension scheme could not be traced back for the entire data series. Otherspending items that might be part of the UK’s submission to NATO include the UK’s contribution to United Nations peacekeepingoperations and the cost of military operations not covered by the MOD budget. However, these additional expenditure items donot fully bridge the 11.2 billion gap. Questions thus remain about what the British Government reports to NATO on its militaryexpenditure.
trends in world military expenditure, 20199Military spending in Western Europe in 2019 was 251 billion—up by3.9 per cent on 2018 but down by 0.6 per cent on 2010. Military expenditure inEastern Europe totalled 74.0 billion in 2019. It was 4.9 per cent higher thanin 2018 and 35 per cent higher than in 2010. All seven countries in EasternEurope increased their military spending in 2019. In Central Europe spending in 2019 was 31.5 billion—14 per cent higher than in 2018 and 61 per centhigher than in 2010.France’s military spending rose by 1.6 per cent in 2019 to reach 50.1 billion.Over the decade 2010–19 its military spending increased by 3.5 per cent. Therise in 2019 followed the adoption of the Military Planning Law for 2019–25,which aims to bring France’s spending on the military in line with the NATOtarget of 2 per cent of GDP by 2025.In 2019 Germany raised its military spending by 10 per cent to 49.3 billionor 1.3 per cent of GDP (see box 1). Its military expenditure was 15 per centhigher than in 2010, when it was also 1.3 per cent of GDP. Notably, Germany’sspending in 2019 was at the highest level since 1993, when the militaryburden was 1.7 per cent of GDP.At 48.7 billion, the UK’s military expenditure was unchanged in 2019 butwas 15 per cent lower than in 2010. The UK’s spending has remained fairlystable since 2015 (see box 1). At 1.7 per cent of GDP, the UK’s military burdenin 2019 was at its lowest level since 1950.Russia’s military expenditure was 65.1 billion in 2019 and accountedfor 88 per cent of military spending in Eastern Europe. Russian militaryexpenditure has grown significantly over the past two decades. By 2019, itwas 30 per cent higher than in 2010 and 175 per cent higher than in 2000.Between 2018 and 2019, Russia’s military spending increased by 4.5 per centand its military burden rose from 3.7 per cent of GDP to 3.9 per cent.Four countries in Central Europe increased their military spending bymore than 150 per cent between 2010 and 2019: Lithuania (232 per cent),Latvia (176 per cent), Bulgaria (165 per cent) and Romania (154 per cent).Poland, which accounted for 38 per cent of the total for Central Europe in2019, increased its military spending by 51 per cent over the decade 2010–19.Between 2018 and 2019, Bulgaria had the highest relative increase in militaryspending of any country in the world (127 per cent; see table 3). This spikein spending can be attributed to the full payment by Bulgaria for eight newcombat aircraft ordered in 2019.The Middle EastSIPRI has not estimated total military expenditure in the Middle East since2015 because of a lack of data for Qatar, Syria, the United Arab Emirates(UAE) and Yemen. The combined total military expenditure in 2019 for the11 countries for which data is available was 147 billion.1Two of the top 15 global spenders in 2019 are in the Middle East: SaudiArabia (rank 5) and Israel (rank 15). Saudi Arabia is by far the largest militaryspender in the region, with an estimated total of 61.9 billion in 2019. Aftermilitary spending peaked at an all-time high in 2015, when Saudi Arabia was1 Countries included in the estimate are Bahrain, Egypt, Iran, Israel, Iraq, Jordan, Kuwait, Leba non, Oman, Turkey and Saudi Arabia.
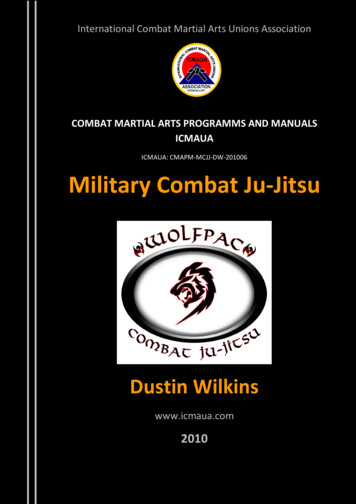
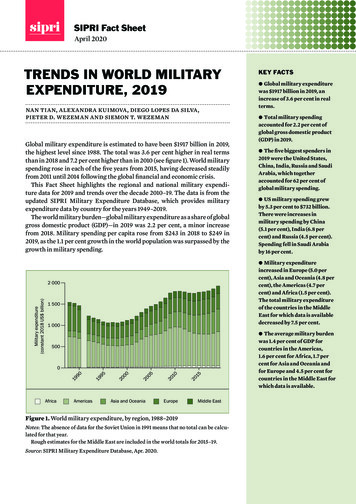
0%No data3.0% to 3.9%2.0% to 2.9%9. Azerbaijan: 4.0%10. Pakistan: 4.0%4. Kuwait: 5.6%5. Israel: 5.3%8. Lebanon: 4.2%7. Jordan: 4.7%2. Saudi Arabia: 8.0%3. Algeria: 6.0%6. Armenia: 4.9%1. Oman: 8.8%87249Source: SIPRI Military Expenditure Database, Apr. 2020.Notes: The countries with military spending as a share of gross domestic product of 4.0% or more are listed.Disputed territories are not marked on the map.Figure 4. Military spending as a share of gross domestic product, by country, 20191.0% to 1.9%Less than 1.0%4.0% or more35611010sipri fact sheet
trends in world military expenditure, 201911the third-largest military spender in the world, it dropped by 28 per cent in2016, climbed by 15 per cent between 2016 and 2018, but decreased again in2019, by 16 per cent. The drop in military spending in 2019 was unexpectedas Saudi Arabia continued its military operations in Yemen and, after a missile attack caused significant damage to its oil industry in September 2019,tensions with Iran increased.Military spending by Israel was 20.5 billion in 2019—a slight increase of1.7 per cent compared with 2018. Between 2010 and 2019, Israeli militaryspending increased steadily, and in 2019 it was 30 per cent higher than in 2010.Turkish military expenditure increased by 86 per cent over the decade2010–19 to reach 20.4 billion. There was a particularly steep increase inTurkish military spending between 2017 and 2018, of 27 per cent, while theincrease between 2018 and 2019 was 5.8 per cent.Iran’s military expenditure in 2019 was 12.6 billion, a decrease of15 per cent compared with 2018. This followed a 23 per cent decrease in 2018.The fall in spending coincided with the Iranian economy being negativelyaffected by the USA’s reinstatement of economic sanctions in early 2018 andoccurred despite Iran’s deteriorating relations with Saudi Arabia.MILITARY SPENDING AS A SHARE OF GDPA country’s military expenditure as a share of GDP—also known as the military burden—is the simplest measure of the relative economic burden themilitary places on that country. The world military burden followed a declining trend in 2010–19, decreasing every year except for 2015 and 2019. Therewas substantial variation in the average military burden of each region overthe decade: it decreased for countries in Africa and in the Americas, while itincreased for countries in Europe and in the Middle East (for which data isavailable), and remained unchanged for countries in Asia and Oceania.In 2019, on average, countries in the Americas had the lowest militaryburden, at 1.4
from 2011 until 2014 following the global financial and economic crisis. This Fact Sheet highlights the regional and national military expendi-ture data for 2019 and trends over the decade 2010-19. The data is from the updated SIPRI Military Expenditure Database, which provides military expenditure data by country for the years 1949-2019.