Transcription
This is an open access article published under a Creative Commons Attribution (CC-BY)License, which permits unrestricted use, distribution and reproduction in any medium,provided the author and source are cited.Articlepubs.acs.org/estImpacts of the Deepwater Horizon Oil Spill on Salt Marsh Periwinkles(Littoraria irrorata)Scott Zengel,*,† Clay L. Montague,‡ Steven C. Pennings,§ Sean P. Powers, Marla Steinhoff, Gail Fricano,# Claire Schlemme,# Mengni Zhang,¶ Jacob Oehrig,¶ Zachary Nixon,@ Shahrokh Rouhani,¶and Jacqueline Michel@†Research Planning, Inc. (RPI), Tallahassee, Florida 32303, United StatesDepartment of Environmental Engineering Sciences, University of Florida, Gainesville, Florida 32611, United States§Department of Biology and Biochemistry, University of Houston, Houston, Texas 77204, United States Department of Marine Sciences, University of South Alabama and Dauphin Island Sea Lab, Mobile, Alabama 36688, United States Assessment and Restoration Division, Office of Response and Restoration, National Oceanographic and AtmosphericAdministration (NOAA), Seattle, Washington 98115, United States#Industrial Economics, Inc. (IEc), Cambridge, Massachusetts 02140, United States¶NewFields, Atlanta, Georgia 30309, United States@Research Planning, Inc. (RPI), Columbia, South Carolina 29201, United States‡S Supporting Information*ABSTRACT: Deepwater Horizon was the largest marine oilspill in U.S. waters, oiling large expanses of coastal wetlandshorelines. We compared marsh periwinkle (Littoraria irrorata)density and shell length at salt marsh sites with heavy oiling toreference conditions 16 months after oiling. We alsocompared periwinkle density and size among oiled sites withand without shoreline cleanup treatments. Densities ofperiwinkles were reduced by 80 90% at the oiled marshedge and by 50% in the oiled marsh interior ( 9 m inland)compared to reference, with greatest numerical losses ofperiwinkles in the marsh interior, where densities werenaturally higher. Shoreline cleanup further reduced adult snaildensity as well as snail size. Based on the size of adultperiwinkles observed coupled with age and growth information, population recovery is projected to take several years once oilingand habitat conditions in affected areas are suitable to support normal periwinkle life-history functions. Where heavily oiledmarshes have experienced accelerated erosion as a result of the spill, these habitat impacts would represent additional losses ofperiwinkles. Losses of marsh periwinkles would likely affect other ecosystem processes and attributes, including organic matterand nutrient cycling, marsh-estuarine food chains, and multiple species that prey on periwinkles. INTRODUCTIONThe Deepwater Horizon incident, starting in April 2010, was thelargest marine oil spill in U.S. waters and one of the largestworldwide: 3.19 million barrels of oil were released into theGulf of Mexico1 and over 2100 km of shoreline were oiled,including over 1100 km of coastal wetland shorelines.2,3 As partof the Natural Resources Damage Assessment (NRDA)process, natural resource trustees are tasked with assessingresource injuries and recovery to allow identification ofappropriate restoration. Here, as part of the NRDA injuryassessment, we address the impact of the Deepwater Horizon oilspill on the marsh periwinkle, Littoraria irrorata, one of themost abundant and important macroinvertebrates in saltmarshes of the Gulf to Mid-Atlantic Coasts of the UnitedStates.4 9 2015 American Chemical SocietyMarsh periwinkles are important prey for multiple speciesincluding blue crab (Callinectes sapidus), diamondback terrapin(Malaclemys terrapin), clapper rail (Rallus longirostris), andnorthern raccoon (Procyon lotor).10 16 Periwinkles also haveimportant influences on marsh vegetation, organic detritus,nutrient cycling, microbial communities, other invertebrates,and ecosystem productivity.6,17 23 For example, periwinklegrazing plays a key role in the shredding and decomposition ofsenescent and dead Spartina alternif lora leaves, supportingorganic matter and nutrient cycling and marsh-estuarine er 8, 2015December 24, 2015December 29, 2015December 29, 2015DOI: 10.1021/acs.est.5b04371Environ. Sci. Technol. 2016, 50, 643 652
ArticleEnvironmental Science & Technologychains.17,18 Periwinkle grazing may also regulate plantproductivity, and in some cases, periwinkles may respond orcontribute to marsh vegetation die-back events.6,19,24 Accordingly, oil spill impacts to periwinkles could affect a variety ofother species and overall marsh function.Impacts to salt marsh habitats and biota resulting from theDeepwater Horizon oil spill have been documented in previouspapers.25 30 Silliman et al.27 and Zengel et al.29,30 observedreduced densities of marsh periwinkles at the heavily oiledmarsh edge, where the vegetation was also impacted. Incontrast, McCall and Pennings26 did not observe impacts toperiwinkles in areas just inland of heavily oiled shorelines,where there was less visible oiling and the vegetation appearedunaffected. These prior studies were primarily focused on topicsother than marsh periwinkles and each had either limitedreplication (as few as three oiled sites) or examined relativelysmall areas of shoreline ( 1 km), and were not definitiveconcerning the extent or degree of marsh periwinkle impacts. Afew prior studies have also documented impacts to marshperiwinkles from other oil spills, with effects including increasedmortality, reduced densities, reduced recruitment, and alteredsize distributions.31 34 Potential impacts to periwinkles couldresult from direct oiling of individuals, reductions or losses ofmarsh vegetation caused by oiling, and incorporation of oil intosurficial marsh soils, affecting periwinkles, their habitat, or foodsources. Periwinkles could be particularly affected by changes inthe marsh vegetation due to their close association withSpartina alternif lora,8,35,36 the defining feature of their habitat.Vegetation impacts resulting from the Deepwater Horizonincident have been documented in heavily oiled marshes byseveral investigators.25,27,29,30,37,38 Accelerated marsh erosiondue to vegetation impacts resulting from the oil spill have alsobeen observed.27,30,38,39 Increased erosion would reduce habitatarea, quality, and stability, representing additional impacts toperiwinkles.Our study focused on oil spill impacts to marsh periwinklesat salt marsh sites with heavy oiling, based on sampling 16months after heavy oiling came ashore in June 2010 in BaratariaBay, Louisiana (Supporting Information Figure S1). Becauseshoreline cleanup treatments were applied to many marsheswith heavy oiling in an attempt to minimize damage and fosterhabitat recovery, though at some risk of causing additionalimpacts, we also examined the effects of operational-scaleshoreline treatments on periwinkles (as opposed to priorresearch on smaller-scale treatment tests29,30). We consider thepresent work the definitive study to date on marsh periwinkleimpacts following the Deepwater Horizon oil spill, due to (a) thelarger number of oiled study sites and geographic areaaddressed compared to prior studies (24 oiled sites; 70 kmof oiled marsh shorelines); (b) the examination of both oilingand operational-scale cleanup treatment effects; (c) thesimultaneous sampling of both the oiled marsh edge, theoiled marsh interior, and the marsh interior inland of the mainoiling bands; and (d) the combined consideration of periwinkledensity, size, population structure, and life-history stage. Inaddition to the presentation of our findings, we also synthesizeinformation across this and prior Deepwater Horizon studiestouching on marsh periwinkles.Our main hypothesis was that marsh periwinkle densitieswould be reduced in locations with heavy oiling relative toreference conditions, due to oiling of periwinkles and impactsto the vegetation. If periwinkle densities were reduced as aresult of oiling, their populations could also be shifted towardsmaller (younger) individuals recruited after the spill. Therefore, we also hypothesized that mean snail size would bereduced in locations with heavy oiling relative to reference sites,affecting periwinkle size distributions. Oiled marsh cleanupinvolves difficult balancing among: speeding the removal anddegradation of oil, enhancing habitat recovery, and not causingfurther damage to the habitat or biota.30 Accordingly, wehypothesized that operational-scale cleanup treatments wouldhave an effect on marsh periwinkles, though we were uncertainconcerning the direction of effects, as they could be positive ornegative depending on the effects of oiling, the effectiveness oftreatments, and physical disturbance to the snails, thevegetation, and substrate. However, given the nature of thetreatments (described below in the Materials and Methodssection), we anticipated that treatment could have negativeeffects on periwinkles, at least over the short-term. MATERIALS AND METHODSStudy Sites. Study sites were located in mainlandherbaceous salt marshes in Louisiana dominated by Spartinaalternif lora, stratified by oiling conditions and shorelinetreatment (Figure S1). Our study sites were a subset of alarger NRDA coastal wetland vegetation study,37 with our sitesfocused on reference conditions versus heavy initial oiling,based on Shoreline Cleanup Assessment Technique (SCAT)and NRDA shoreline oiling surveys. The vast majority of ouroiled sites had heavy maximum SCAT oiling, with heavy oilingpersisting on the shoreline for 3 months or longer.2,3 Initialheavy oiling conditions in June 2010 involved thick deposits ofemulsified oil on the marsh vegetation and substrate (FigureS2a).3,40 Our oiled sites each had 90 100% vertical oil coverageon the aboveground vegetation and oiling of marsh soils, basedon site-specific NRDA surveys37 and SCAT observations.3,40Reference sites had no visible oiling documented during a seriesof site-specific NRDA surveys.37 We omitted four original studysites with inconsistent oiling histories which could not bereliably classified as reference or heavy oiling; we also omittedtwo sites that were located in brackish marsh rather than saltmarsh.Oiled sites consisted of two groups. The first group includedsites with heavy oiling that were randomly selected andestablished prior to the onset of oiled marsh shorelinetreatments (as were the reference sites).37 These oiled siteswere designated as no treatment “set-asides” by the DeepwaterHorizon Unified Command (UC; consisting of the U.S. CoastGuard, state governments, and BP). Shoreline treatments werenot applied in these sites and we classified these as “oiled anduntreated”. All of these oiled sites had confirmed forensicmatches to Deepwater Horizon oil based on prior NRDAsampling. The remaining oiled sites were randomly establishedin shoreline areas designated for treatment under the mainShoreline Treatment Recommendation (STR) issued by theUC for Barataria Bay salt marshes (STR S3-04530,40). Weclassified these sites as “oiled and treated” (with the exceptionof two sites that were confirmed as not treated, which wereassigned to the oiled and untreated group). Treatmentsincluded combinations of manual and mechanical removal ofoiled wrack and oiled vegetation mats, cutting and raking ofvegetation, raking and scraping of thick ( 1 cm) oil depositsfrom the marsh substrate, and application of loose organicsorbents.30,40 Most treated sites included the full suite ofintensive treatments described above. Treatments wereconducted between February and August 2011.644DOI: 10.1021/acs.est.5b04371Environ. Sci. Technol. 2016, 50, 643 652
ArticleEnvironmental Science & TechnologyMarsh soils were sampled for total polycyclic aromatichydrocarbons (tPAH) during September November 2010 and2011 as part of a related NRDA sampling program. Marsh soilsampling areas were laterally offset by 20 m from the marshperiwinkle quadrats to avoid interference between multipleNRDA sampling programs that were concurrently underway atthe same study sites (the NRDA marsh study sites were definedas 50 m lengths of shoreline with similar oiling conditions). Soilsamples were collected by hand from the top 2 cm of marshsoils directly into clean glass jars. TPAH in marsh soils wasdetermined using GC/MS-SIM (gas chromatography/massspectrometry in selective ion monitoring mode) based on EPAMethod 8270D. TPAH included the sum of 54 PAHs,including alkylated homologues, presented as mg/kg. Marshsoils were sampled for tPAH in Zones 1 and 2; no samples werecollected in Zone 3 as defined in our study.Data Analysis. Our sampling design included treated anduntreated oiled sites as well as reference sites. The objective ofour study was to assess the effects of both oiling and treatment;therefore, the subsequent analyses were conducted as ANOVAplanned comparisons, also known as planned contrasts or apriori comparisons. Planned comparisons are statisticallypowerful tests which allow researchers to answer specificquestions of interest by focusing on subsets of interest.43 Unlikepost hoc pairwise comparisons, planned comparisons ofindependent subsets do not require any correction of pvalues.43 Furthermore, planned comparisons directly incorporate the ANOVA within-group mean square errors, and thus aresuperior to separate two-sample t tests.44 In this work, twotypes of planned comparisons were conducted: (a) comparisons of oiled versus reference sites to assess the effects of oilingon periwinkles and supporting metrics; and (b) comparisons oftreated and untreated sites to assess the effects of cleanuptreatments on periwinkles and supporting measures in oiledareas.As part of the planned comparisons, Levene’s test was usedto examine homogeneity of variance; when variances wereunequal, Welch’s methodology for generalization of two-sampletests was applied.45 One-tailed tests were used where thedirection of difference was predicted prior to testing. Twotailed tests were used where the direction of difference was notpredicted. We defined statistical significance as p 0.10, basedon guidance regarding balancing Type I and II errors duringenvironmental impact assessments, according to our samplesize.46 Finally, for each planned comparison, the effect size wascalculated using Cohen’s d statistic.47 Effect size thresholdswere d 0.2 (small effect), 0.5 (medium effect), and 0.8 (largeeffect) regardless of direction (i.e., sign).47,48Size-frequency histograms were generated to further examinevariation in periwinkle shell length. Life-history stages wereincorporated into the histograms based on shell length ranges,with individuals 6, 6 13, and 13 mm in length defined asjuveniles, subadults, and adults, respectively.8,49,50 Where weobserved differences in size-frequency distributions, we usedKolmogorov Smirnov tests to determine if such differenceswere statistically significant. Age and growth information fromthe literature51,52 was used to approximate periwinkle ageaccording to shell size, assuming similar growth rates. Based onthis, juvenile snails would be 1 year in age, subadult snailswould be 1 1.5 years, and adult snails would be 1.5 years inage. Considering that most periwinkles present when the oilcame ashore in 2010 would typically be in the adult size rangeIn total, we studied 11 reference sites, 12 oiled and untreatedsites, and 12 oiled and treated sites (24 oiled sites, 35 totalsites). Reference sites spanned the Barataria-TerrebonneEstuary in Louisiana; oiled sites were located in Barataria Bay(Figure S1).Sampling Methods. We sampled marsh periwinkles, marshvegetation, and surface oiling parameters on 16 31 October2011, 16 months after heavy oiling initially came ashore. Foreach sampling site, a linear transect was establishedperpendicular to the shoreline extending from the seawardmarsh edge into the marsh interior (Figure S3). Two 0.25 m2quadrats were located at each of three distances (samplingzones) from the shoreline: Zone 1, seaward marsh edge(quadrats centered an average of 2 m from the shoreline,defined by the erosional scarp at the margin of the marshplatform); Zone 2, the oiled marsh interior, the center of themaximum initial oiling width at each site (quadrats centered anaverage of 9 m from the shoreline, oiling width defined as theinland extent of visible oiling perpendicular to the shoreline);and Zone 3, the marsh interior located 3 m landward of themaximum initial oiling width at each site (quadrats centered anaverage of 21 m from the shoreline). Designations for themarsh edge versus the marsh interior were similar to Petersonand Turner.41 For the oiled sites, Zones 1 and 2 were locatedwithin the original footprint of visible oiling at each site, asdocumented during prior NRDA surveys, whereas Zone 3 waslocated beyond (inland of) the original oiling footprint.Sampling zones in the reference sites were positioned tomirror the sampling zones in the oiled sites, based on the initialoiling widths observed during prior NRDA surveys. Data fromthe two quadrats in each zone at each site were averaged andconverted to 1 m2 basis prior to analyses. Zone 1 quadratscould not be effectively sampled at three sites (two referenceand one oiled and untreated) due to shoreline erosion ordisturbance from human-made debris on the shoreline;however, Zones 2 and 3 were sampled at these locations.We collected all marsh periwinkles visible on the vegetationand marsh substrate within each quadrat to determine meantotal density and shell length. We did not search for smallerjuvenile ( 6 mm shell length) periwinkles hidden between theleaf sheath and the stem of Spartina alternif lora shoots, or inrolled up senescent or dead leaves (the microhabitats where thesmallest snails occur but where larger snails are not found),though we did sample juvenile snails visible on the vegetationor substrate. Thus, juvenile snails were likely under-sampled inour study, as they are in most similar studies. Although undersampling of small juveniles could affect our size comparisons tosome degree, the size ranges and life-stages collected (includinglarger juveniles, subadults, and adults) were still sufficient toexamine our hypotheses given the time since the spill occurred(see the following Data Analysis subsection). Periwinkle shelllengths were measured to the nearest 0.5 mm using calipers.Periwinkles were returned to the quadrats from which theywere collected at the completion of sampling. Supporting datacollected for each quadrat included residual surface oil cover(%), surface oil thickness (cm), and surface oil character (e.g.,emulsified oil, oil residue) based on standard shorelineassessment methods used during spills.42 Spartina alternif loralive cover (%) was visually estimated for each quadrat as anumerical value (rather than as cover ranks or classes).Vegetation height (cm) was measured as “canopy height”based on the predominant height of vegetation within eachquadrat.645DOI: 10.1021/acs.est.5b04371Environ. Sci. Technol. 2016, 50, 643 652
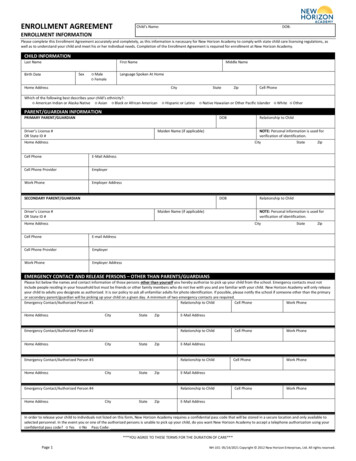
ArticleEnvironmental Science & TechnologyTable 1. Marsh Oiling and Vegetation Characteristicsareferenceoiled treatedNeffect sizereference v.oiledp-valueuntreated v.treatedeffect sizeuntreated v.treatedmean SEN0 0920 101119 7120.002 1.70.9190.120 0110.1 0.1120.3 0.3120.199 0.30.451 0.330 0110 0124 4120.323 0.70.323 0.610.4 0.19312 1158no data0.015 2.121 0.41125 99no data0.016 1.83no data10.5 0.18157 49765 3380.002 2.50.1461.020.4 0.11123 51140 19110.005 1.90.428 0.53no data154 7929 81125 8120.0051.10.6900.2254 81132 91231 8120.0230.80.9390.0355 71147 81242 7120.2720.40.5630.2154 4951 111126 7120.0221.00.0780.9254 61149 71242 6120.1400.40.4460.3359 51159 41251 6120.6030.20.2990.4zonesurface oil cover(%)surface oil cover(%)surface oil cover(%)2010 soil tPAH(mg/kg)2010 soil tPAH(mg/kg)2010 soil tPAH(mg/kg)2011 soil tPAH(mg/kg)2011 soil tPAH(mg/kg)2011 soil tPAH(mg/kg)Spartina alt.cover (%)Spartina alt.cover (%)Spartina alt.cover (%)vegetationheight (cm)vegetationheight (cm)vegetationheight (cm)1no datamean SEp-valuereference v.oiledNparametermean SEoiled untreatedno datano datano dataData are means 1 standard error (SE) with N number of replicates. Zones 1, 2, and 3 refer to the oiled marsh edge, the oiled marsh interior, andthe marsh interior inland of the initial maximum oiling extent, respectively. P-values are provided for ANOVA planned comparisons of referenceversus oiled sites, and untreated versus treated sites (oiled sites with and without marsh cleanup treatments) by zone. Effect sizes based on Cohen’s dstatistic are provided for each planned comparison. Effect size thresholds are d 0.2 (small effect), 0.5 (medium effect), and 0.8 (large effect),regardless of sign.alive cover was reduced by 40 50% in Zone 1 and 2 at the oiledversus reference sites (large effect sizes in both zones), but didnot greatly differ between oiled and reference in Zone 3.Spartina alternif lora cover did not differ between the untreatedand treated oiled sites in any zone. Mean vegetation heights atreference sites were 54 59 cm across all three zones (Table 1).Mean vegetation height was reduced to 51 cm for the oiled anduntreated sites in Zone 1, and was further reduced to 26 cm forthe oiled and treated sites in Zone 1 (effect sizes were large forboth reference versus oiled and for untreated versus treatedsites). Vegetation height did not greatly differ in Zones 2 or 3.Marsh Periwinkles. Marsh periwinkle densities at referencesites increased from a mean of 34 snails m 2 in Zone 1 tomeans of 80 or more snails m 2 in Zones 2 and 3, in closeagreement with reported periwinkle densities for Louisiana saltmarshes (Figure 1, Table 2). Periwinkle densities in the oiledsites were reduced by 80 90% from reference values in Zone 1and were reduced by 50% in Zone 2 (effect sizes were large inboth zones). Densities in Zone 3 did not differ betweenreference and oiled sites. Among the oiled sites, densities in thetreated sites were nearly 60% lower than in the untreated sitesin Zone 1; although this difference was not statisticallysignificant, the effect size was large (Figure 1).Periwinkle mean shell length ranged from 17 to 21 mmacross most combinations of oiling/treatment classification andzone (Figure 2). Shell length did not differ between oiled andat the time we sampled in 2011 (1.3 1.4 years later), we alsoexamined adult periwinkle density. RESULTSOiling Conditions at the Time of Sampling. Surface oilcover was zero in all zones at the reference sites (Table 1). Incontrast, mean surface oil cover for the oiled sites was 19 20%in Zone 1 (a large effect size) (Table 1, Figure S2b). The oilcharacter observed in Zone 1 for the oiled sites waspredominantly surface oil residue (semicohesive heavily oiledsurface soils). Oil thickness was primarily in the thickness classof 0.1 1 cm thick. Zone 2 quadrats had 1% surface oil coverin the oiled sites. A few of the oiled and treated sites also hadobservations of oil in Zone 3, mainly as oil sheen or film.Within the oiled sites, there were no differences in surface oilcover between the untreated and treated sites in any zone.Mean 2010 and 2011 tPAH values in marsh soils were 1 mg/kg for the reference sites and 25 300 times higher for the oiledsites in Zones 1 and 2 (large effect sizes for both zones in bothyears) (Table 1). Although not statistically significant, the effectsize for tPAH in Zone 1 for untreated versus treated sites wasalso large, treated sites tending to have lower tPAH thanuntreated sites.Vegetation Conditions at the Time of Sampling. MeanSpartina alternif lora live cover values at the reference sites were54 55% across all three zones (Table 1). Spartina alternif lora646DOI: 10.1021/acs.est.5b04371Environ. Sci. Technol. 2016, 50, 643 652
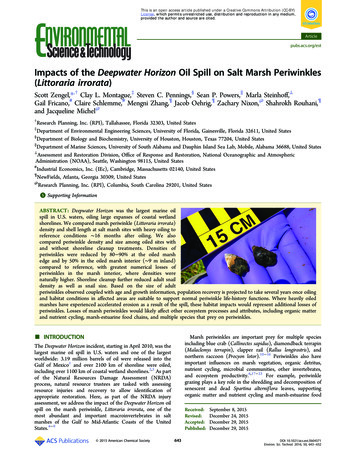
ArticleEnvironmental Science & TechnologyFigure 1. Marsh periwinkle total densities. Data are means 1standard error (SE) with N number of replicates. Zones 1, 2, and 3refer to the oiled marsh edge, the oiled marsh interior, and the marshinterior inland of the initial maximum oiling extent, respectively. Pvalues are provided for ANOVA planned comparisons of referenceversus oiled sites, and untreated versus treated sites (oiled sites withand without marsh cleanup treatments) by zone. *Indicates plannedcomparisons of reference and oiled sites were statistically significant atp 0.10. Effect sizes based on Cohen’s d statistic are provided for eachplanned comparison. Effect size thresholds are d 0.2 (small effect),0.5 (medium effect), and 0.8 (large effect), regardless of sign.Figure 2. Marsh periwinkle shell length. Data are means 1 standarderror (SE) with N number of replicates. Zones 1, 2, and 3 refer to theoiled marsh edge, the oiled marsh interior, and the marsh interiorinland of the initial maximum oiling extent, respectively. P-values areprovided for ANOVA planned comparisons of reference versus oiledsites, and untreated versus treated sites (oiled sites with and withoutmarsh cleanup treatments) by zone. †Indicates planned comparisonsof untreated and treated sites were statistically significant at p 0.10.Effect sizes based on Cohen’s d statistic are provided for each plannedcomparison. Effect size thresholds are d 0.2 (small effect), 0.5(medium effect), and 0.8 (large effect), regardless of sign.Table 2. Reported Marsh Periwinkle Densities fromLouisiana Salt Marshesaconsisted mainly of subadults (though in low numbers). Theoiled and treated sites in Zone 2 were also partly shifted towardsmaller snails (compared to the reference and untreated sites),with a bimodal distribution consisting of peaks in both thesubadult and adult categories.Analysis of adult periwinkle densities gave results similar tothe analysis of total density, although Zone 1 differencesbetween treated and untreated sites were also statisticallysignificant (Figure 4). Adult snail densities were reduced atoiled versus reference sites by 50 90% in Zones 1 and 2 (largeeffect sizes in both zones). In addition, adult snail density was80% lower in Zone 1 in the oiled and treated sites compared tothe untreated sites (also a large effect size).Geographic Versus Oiling Influences. To confirm thatthe multiple differences observed between the reference andoiled sites in Zones 1 and 2 were not driven by geographyrather than oiling (due to the wider geographic spread ofreference sites relative to oiled sites concentrated in BaratariaBay, Figure S1), we compared all measured parameters betweenreference sites in Terrebonne Bay and Barataria Bay. Therewere no differences in oiling parameters, vegetation metrics,total periwinkle density, or adult periwinkle density among bays(all p 0.10). There was a difference in mean shell length inZone 1 (p 0.033). There was a smaller difference in shelllength in Zone 2, although this was not statistically significant(p 0.158). Snails were smaller in the reference sites inTerrebonne versus Barataria Bay, although mean shell lengthcorresponded to the adult size range and adult snails werepredominant in both bays (though dominated by adults,Terrebonne had a larger proportion of juveniles and subadultslocationperiwinkledensityBarataria BayPort FourchonBarataria BaySabine NWR to Bay St. Louis,MSBarataria BayBayou LaFourche24 m 268 82 m 231 34 m 2 40 70 m 2Bayou LaFourcheBarataria Bay34 m 237 183 m 2Port Fourchon27 64 m 2 50 m 2133 m 2sourceAlexander 197953Silliman et al. 200519Spicer 200754McCall and Pennings201226Silliman et al. 201227Stagg and Mendelssohn20128Tong et al. 201355Zengel et al. 2014,201529,30McFarlin et al. 201536aLower values typically from the marsh edge; higher values typicallyfrom the marsh interior or including smaller juveniles in addition tolarger snails. Approximate values estimated from figures. Limited toreference sites for impact studies.reference sites as a whole; however, in Zone 1 there was a sharpreduction in shell length to 11 mm at oiled sites that weretreated (effect size was large for untreated versus treated, andmedium for oiled versus reference sites). Periwinkle shelllength frequency histograms revealed that adult snails werepredominant (mean adult shell length 21 mm), with fewerjuveniles and subadults observed (Figure 3). The exception wasin Zone 1 of the oiled and treated sites (dashed red circle inFigure 3), where periwinkle populations lacked adults and647DOI: 10.1021/acs.est.5b04371Environ. Sci. Technol. 2016, 50, 643 652
ArticleEnvironmental Science & TechnologyFigure 3. Marsh periwinkle shell length histograms. Periwinkle life stage classes were defined as juveniles ( 6 mm), subadults (6 13 mm), andadults ( 13 mm). Zones 1, 2, and 3 refer to the oiled marsh edge, the oiled marsh interior, and the marsh interior inland of the initial maximumoiling extent, respectively. For the oiled and treated sites, the red dashed circle highlights the lack of adult snails and the yellow arrows indicaterelative shifts to smaller subadult snails in Zones 1 and 2, as compared to the reference and oiled and untreated sites. Kolmogorov Smirnov testsindicated that these differences in distributions were statistically significant in both zones (all p 0.001).oiled sites, representing important changes in habitat characteristics for marsh periwinkles.Marsh periwinkles were strongly affected by oiling andassociated habitat alterations in our study, as evidenced by the80 90% reduction in total periwinkle densities at the oiledmarsh edge (Zone 1) and the 50% reduction in total densitiesin the oiled marsh interior (Zone 2). The very low snaildensities at the oiled marsh edge (3 7 snails m 2) wereparticularly striking compared to the typical range of periwinkledensities reported for Louisiana salt marshes (Table 2).Nevertheless, because periwinkle densities were higher in themarsh interior than at the marsh edge, the numerical loss ofperiwinkles in the oiled marsh interior (49 snails m 2 32 SElost to oiling) was greater in comparison to
ingly, oil spill impacts to periwinkles could affect a variety of other species and overall marsh function. Impacts to salt marsh habitats and biota resulting from the Deepwater Horizon oil spill have been documented in previous papers.25 30 Silliman et al.27 and Zengel et al.29,30 observed reduced densities of marsh periwinkles at the .