Transcription
Image description. Cover Image End of image description.NATIONAL CENTER FOR EDUCATION STATISTICSWhat Is IPEDS?The Integrated Postsecondary Education DataSystem (IPEDS) is a system of survey componentsthat collects data from about 6,400 institutions thatprovide postsecondary education across the UnitedStates.These data are used at the federal and state level forpolicy analysis and development; at the institutionallevel for benchmarking and peer analysis; and bystudents and parents, through the College Navigator(https://nces.ed.gov/collegenavigator/), an online toolto aid in the college search process. Additionalinformation about IPEDS can be found on thewebsite at https://nces.ed.gov/ipeds.What Is the Purpose of This Report?The Data Feedback Report is intended to provideinstitutions a context for examining the data theysubmitted to IPEDS. The purpose of this report is toprovide institutional executives a useful resource andto help improve the quality and comparability ofIPEDS data.What Is in This Report?The figures in this report provide a selection ofindicators for your institution to compare with a groupof similar institutions. The figures draw from the datacollected during the 2018-19 IPEDS collection cycleand are the most recent data available. The insidecover of this report lists the pre-selected comparisongroup of institutions and the criteria used for theirselection. The Methodological Notes at the end of thereport describe additional information about theseindicators and the pre-selected comparison group.Where Can I Do More with IPEDS Data?Each institution can access previously released DataFeedback Reports from 2005 and customize this2019 report by using a different comparison groupand IPEDS variables of its choosing. To learn how tocustomize the 2019 report, visit this resource pagehttps://nces.ed.gov/Ipeds/Help/View/2. To downloadarchived reports or customize the current DataFeedback Report, visit the ‘Use the Data’ portal onthe IPEDS website https://nces.ed.gov/ipeds andclick on Data Feedback Report.Nightingale CollegeSalt Lake City, UT
Nightingale CollegeCOMPARISON GROUPComparison group data are included to provide a context for interpreting your institution’s statistics. For this report, you specified a customcomparison group.The custom comparison group chosen by Nightingale College includes the following 32 institutions:Ambria College of Nursing (Hoffman Estates, IL)American College for Medical Careers (Orlando, FL)AmeriTech College-Draper (Draper, UT)Angeles College (Los Angeles, CA)Arizona College-Mesa (Mesa, AZ)Bryant & Stratton College-Akron (Copley, OH)Bryant & Stratton College-Bayshore (Glendale, WI)Bryant & Stratton College-Wauwatosa (Wauwatosa, WI)Career Networks Institute (Santa Ana, CA)Careers Unlimited (Orem, UT)Centura College-Chesapeake (Chesapeake, VA)Chamberlain University-Arizona (Phoenix, AZ)Chamberlain University-Florida (Jacksonville, FL)Chamberlain University-Indiana (Indianapolis, IN)Chamberlain University-Michigan (Troy, MI)Chamberlain University-Missouri (St. Louis, MO)Chamberlain University-Nevada (Las Vegas, NV)Chamberlain University-Ohio (Columbus, OH)Chamberlain University-Texas (Houston, TX)Chamberlain University-Virginia (Arlington, VA)Concorde Career College-Kansas City (Kansas City, MO)Eastern International College-Belleville (Belleville, NJ)Eastern International College-Jersey City (Jersey City, NJ)Eastwick College-Ramsey (Ramsey, NJ)Medical Prep Institute of Tampa Bay (Tampa, FL)National American University-Career Point College Teachout Site (San Antonio, TX)National American University-Overland Park (Overland Park, KS)Platt College-Aurora (Aurora, CO)Platt College-Los Angeles (Alhambra, CA)St Louis College of Health Careers-Fenton (Fenton, MO)Trinity School of Health and Allied Sciences (Gardena, CA)West Coast University-Miami (Doral, FL)The figures in this report have been organized and ordered into the following topic areas:1) Admissions (only for non-open-admissions schools)[No charts applicable]2) Student EnrollmentFig. 1, 2, 3, 4, 5, 6 and 7Pg. 3, 4 and 53) AwardsFig. 8 and 9Pg. 54) Charges and Net Price[No charts applicable]5) Student Financial AidFig. 10, 11 and 12Pg. 5 and 66) Military Benefits*Fig. 13 and 14Pg. 67) Retention and Graduation RatesFig. 15, 16, 17, 18, 19 and 20Pg. 7, 8 and 98) FinanceFig. 21, 22, 23, 24 and 25Pg. 9 and 109) StaffFig. 26, 27 and 28Pg. 10 and 1110) Libraries*Fig. 29Pg. 11*These figures only appear in customized Data Feedback Reports (DFR), which are available through Use the Data portal on the IPEDS website.IPEDS DATA FEEDBACK REPORT2
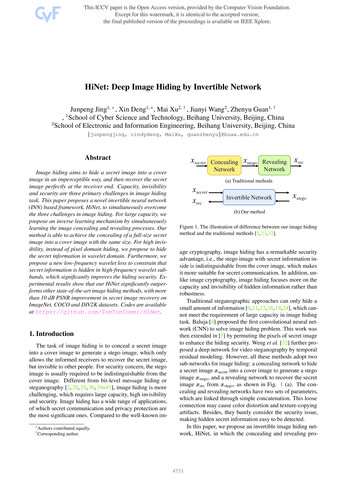
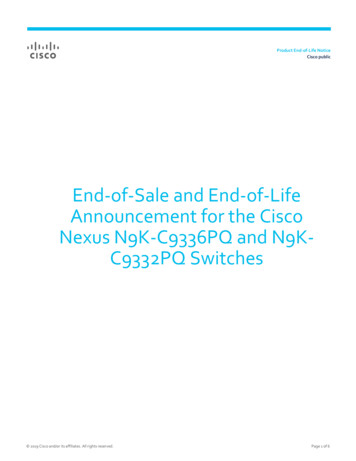
Nightingale CollegeFigure 1.Percent of all students enrolled, by race/ethnicity, and percent of students who are women: Fall 2018Image description.BarchartwithScale10 groupsX scalescaletitledlabel.with 2 items per group.YtitledPercent.GroupAmericanIndianAlaska Native.Item1,1,Yourinstitution1. orItem2,ComparisonGroupMedian (N 32) 0.01.Group2,Asian.Iteminstitution5. Median (N 32) 4.Item 1,2, YourComparisonGroupGroupBlackor AfricanItem1,3,Yourinstitution9. American.Item2,ComparisonGroupMedian (N 32) 23.GroupHispanic/Latino.Item1,4,Yourinstitution9. Median (N 32) 22.Item2,ComparisonGroupGroupNativeHawaiianother Pacific Islander.Item1,5,Yourinstitution1. orItem2,ComparisonGroupMedian (N 32) 0.01.GroupWhite.Item1,6,Yourinstitution73. Median (N 32) 32.Item2,ComparisonGroupGroup7,Twoormoreraces.Item 2,1, ComparisonYour institution2. Median (N 32) ion1.unknown.Item2,ComparisonGroupMedian (N 32) 1.Item 2,10,ComparisonGroup Median (N 32) 0.01.GroupWomen.Item1, ComparisonYourinstitution87. Median (N 32) 87.Item2,GroupRace/ethnicityor : Your institutionShapeComparisonGroupLegend,End of image description. Label: Comparison Group Median (N 20212000American Indian orAlaska NativeAsianBlack or AfricanAmericanHispanic/LatinoNative Hawaiian orother Pacific IslanderWhiteTwo ormore racesRace/ethnicityunknownNonresident alienWomenRace/ethnicity or genderYour institutionComparison Group Median (N 32)NOTE: For more information about disaggregation of data by race and ethnicity, see the Methodological Notes. Median values for the comparison group will not add to 100%. See 'Use ofMedian Values for Comparison Group' for how median values are determined. N is the number of institutions in the comparison group.SOURCE: U.S. Department of Education, National Center for Education Statistics, Integrated Postsecondary Education Data System (IPEDS): Spring 2019, Fall Enrollment component.Figure 2.Unduplicated 12-month headcount of all students and ofundergraduate students (2017-18), total FTE enrollment(2017-18), and full- and part-time fall enrollment (Fall2018)Image description.EnrollmentBarmeasureHorizontalchart with5 groups with 2 items per group.Xscale titledtitled ScaleNumberof students.Yscalelabel.GroupUnduplicatedheadcount - total.Item 2,1,1,Yourinstitution626.ItemComparisonGroupMedian -(N an (N 32) 546.Group3,TotalFTE enrollment.Iteminstitution368.Median (N 32) 360.Item 1,2, em1,4,Yourinstitution415.Median (N 32) ent.Item1,5,Yourinstitution112.Median (N 32) itutionLegend,Label: Your institutionShapeComparisonGroupLegend,End of image description. Label: Comparison Group Median (N 32)Figure 3.Enrollment, by student level: Fall 2018Image description.Student levelHorizontalBarNumberchart with7 groups with 2 items per group.Xscale titledtitledof students.YscaleScale label.GroupTotal.Item 2,1,1,Yourinstitution527.Median (N 32) Yourinstitution527.Median (N 32) certificate-seekingIteminstitution24. Median (N 32) 12. undergraduate.Item 1,2, cateseeking undergraduate.Item1,4,Yourinstitution169.Median (N 32)Item2,ComparisonGroup68. ekingItem1,5,Yourinstitution334.Median (N cate-seekingundergraduate.Item 2,1,6,Yourinstitution0.01.Median (N ourinstitution0.01.Median (N 32) titutionLegend,Label: Your institutionShapeComparisonGroupLegend,End of image description. Label: Comparison Group Median (N 32)Enrollment measureStudent level626Unduplicatedheadcount - total527Total324546527Undergraduate546First-time, degree/certificate-seekingundergraduate368Total FTEenrollment2412Transfer-in, degree/certificateseeking undergraduate36016968Continuing, degree/certificateseeking undergraduate415Full-timefall enrollment224334256Nondegree/certificate-seeking 0undergraduate 0112Part-timefall 00Number of studentsComparison Group Median (N 32)NOTE: For details on calculating full-time equivalent (FTE) enrollment, see CalculatingFTE in the Methodological Notes. Total headcount, FTE, and full- and part-time fallenrollment include both undergraduate and postbaccalaureate students, when applicable.N is the number of institutions in the comparison group.SOURCE: U.S. Department of Education, National Center for Education Statistics,Integrated Postsecondary Education Data System (IPEDS): Fall 2018, 12-monthEnrollment component and Spring 2019, Fall Enrollment component.000Number of studentsYour institution324626Unduplicated headcount- undergraduatesYour institutionComparison Group Median (N 32)NOTE: N is the number of institutions in the comparison group.SOURCE: U.S. Department of Education, National Center for Education Statistics,Integrated Postsecondary Education Data System (IPEDS): Spring 2019, Fall Enrollmentcomponent.IPEDS DATA FEEDBACK REPORT3
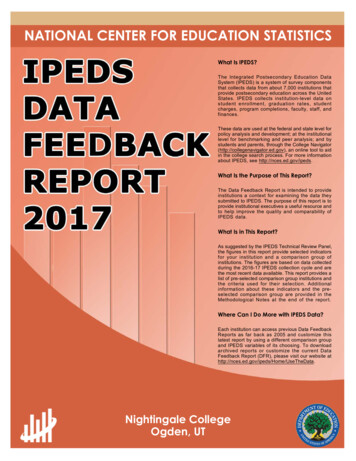
Nightingale CollegeFigure 4.Full-time enrollment, by student level: Fall 2018Image description.StudentlevelHorizontalBarNumberchart with7 groups with 2 items per group.Xscale titledtitledof students.YscaleScale label.GroupTotal.Item1,1,Yourinstitution415.Median (N 32) 224.Item2,ComparisonGroupGroupUndergraduate.Item 2,1,2,Yourinstitution415.Median (N 32) ificateseeking undergraduate.Item1,3,Yourinstitution18. Median (N 32)Item2,ComparisonGroup10. eseekingIteminstitution117.Median (N 32)Item 1,2, YourComparisonGroup39. ekingItem1,5,Yourinstitution280.Median (N cateseeking em2,ComparisonGroup(N 32) ian (N 32) titutionLegend,Label: Your institutionShapeComparisonGroupLegend,End of image description. Label: Comparison Group Median (N 32)Figure 5.Image description.StudentlevelHorizontalBarNumberchart with7 groups with 2 items per group.Xscale titledtitledof students.YscaleScale label.GroupTotal.Item1,1,Yourinstitution112.Median (N 32) 139.Item2,ComparisonGroupGroupUndergraduate.Item 2,1,2,Yourinstitution112.Median (N 32) ificateseeking undergraduate.Item1,3,Yourinstitution6. Median (N 2. Median (N 32)Item 1,2, YourComparisonGroup26. ekingItem1,5,Yourinstitution54. Median (N ateseeking em2,ComparisonGroup(N 32) ian (N 32) titutionLegend,Label: Your institutionShapeComparisonGroupLegend,End of image description. Label: Comparison Group Median (N 32)Student levelStudent level415Total4151810Transfer-in, degree/certificateseeking undergraduate139112Undergraduate224First-time, degree/certificateseeking , degree/certificateseeking undergraduate11761Transfer-in, degree/certificateseeking undergraduate39Continuing, degree/certificateseeking undergraduate2805226Continuing, degree/certificateseeking undergraduate136Nondegree/certificate- 0seeking undergraduate 0GraduatePart-time enrollment, by student level: Fall 20185486Nondegree/certificate- 0seeking undergraduate 000Graduate01002003004005000002550Number of studentsYour institutionComparison Group Median (N 32)Your institutionNOTE: N is the number of institutions in the comparison group.SOURCE: U.S. Department of Education, National Center for Education Statistics,Integrated Postsecondary Education Data System (IPEDS): Spring 2019, Fall Enrollmentcomponent.Figure 6.75100125150Number of studentsComparison Group Median (N 32)NOTE: N is the number of institutions in the comparison group.SOURCE: U.S. Department of Education, National Center for Education Statistics,Integrated Postsecondary Education Data System (IPEDS): Spring 2019, Fall Enrollmentcomponent.Percent of all undergraduate students enrolled, by race/ethnicity, and percent of students who are women: Fall 2018Image description.BarchartwithScale10 groupsXscaletitledlabel.with 2 items per ska Native.Iteminstitution1. orItem 1,2, YourComparisonGroupMedian (N 32) 0.01.GroupAsian.Item1,2,Yourinstitution5. Median (N 32) 4.Item2,ComparisonGroupGroupBlackor AfricanItem1,3,Yourinstitution9. American.Item2,ComparisonGroupMedian (N 32) 23.GroupHispanic/Latino.Item1,4,Yourinstitution9. Median (N 32) 22.Item2,ComparisonGroupGroupNativeHawaiianother Pacific Islander.Item1,5,Yourinstitution1. orItem2,ComparisonGroupMedian (N 32) 0.01.Group6,White.Iteminstitution73. Median (N 32) 32.Item 1,2, YourComparisonGroupGroupTwoinstitutionor moreraces.Item1,7,Your2. Median (N 32) an(N 32) 1.Median (N 32) institution87. Median (N 32) 87.Item2,ComparisonGroupRace/ethnicityor : Your institutionShapeComparisonGroupLegend,End of image description. Label: Comparison Group Median (N 20212000American Indian orAlaska NativeAsianBlack or AfricanAmericanHispanic/LatinoNative Hawaiian orother Pacific IslanderWhiteTwo ormore racesRace/ethnicityunknownNonresident alienWomenRace/ethnicity or genderYour institutionComparison Group Median (N 32)NOTE: For more information about disaggregation of data by race and ethnicity, see the Methodological Notes. Median values for the comparison group will not add to 100%. See 'Use ofMedian Values for Comparison Group' for how median values are determined. N is the number of institutions in the comparison group.SOURCE: U.S. Department of Education, National Center for Education Statistics, Integrated Postsecondary Education Data System (IPEDS): Spring 2019, Fall Enrollment component.IPEDS DATA FEEDBACK REPORT4
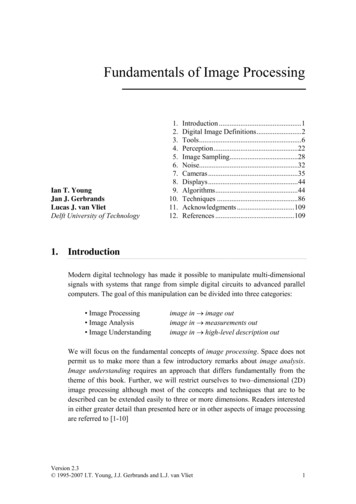
Nightingale CollegeFigure 7.Percent of students enrolled in distance educationcourses, by amount of distance education and studentlevel: Fall 2018Image hartparticipationwith6 groups with 2 items per group.Xscale titledtitledof students.YscaleScale label.GroupUndergraduatesexclusively in distance education (N upGroupUndergraduatesinMedianat least1.one but not all distance education courses (N 32).Item nGroupUndergraduatesnotin any33.distance education (N oupMedian61. in distance education (N onNo data.Item 1,2, YourComparisonGroupMedianNo data.GroupGraduatestudentsin at leastone but not all distance education courses (N 0).Item1,5,YourinstitutionNo data.Item2,ComparisonGroupMedianNo data.GroupGraduatestudentsnot enrolledin any distance education (N 0).Item1,6,YourinstitutionNo data.Item2,ComparisonGroupMedian No data.Shapeline,Label:ShapeInstitutionLegend,Label: Your ison Group MedianEnd of image description.Figure 8.Number of degrees awarded, by level: 2017-18Image description.DegreelevelHorizontalBarNumberchart with6 groups with 2 items per group.Xscale titledtitledof omparisonGroup(N 32) 0.01.GroupDoctor'sProfessionalPractice.Item p(N 32) 1.Median (N 32) itution0.01.Median (N 32) 0.01.Item 1,2, titution5. Median (N 32) ourinstitution173.Median (N 32) tutionLegend,Label: Your isonGroup Median (N 32)End of image description.Distance education participationDegree level100Undergraduates exclusivelyin distance education (N 32)Doctor's Research/ 0Scholarship 01Undergraduates in at least one but not all distance 0education courses (N 32)Doctor's Professional 0Practice 033Undergraduates not in 0any distance education (N 32)Doctor's 0Other 061Graduate students exclusively indistance education (N 0)Master'sGraduate students in at least one but not all distanceeducation courses (N 0)Bachelor'sGraduate students not enrolledin any distance education (N t of studentsYour institution150200Number of degreesComparison Group MedianYour institutionComparison Group Median (N 32)NOTE: N is the number of institutions in the comparison group. Medians are not reportedfor comparison groups with less than three values.SOURCE: U.S. Department of Education, National Center for Education Statistics,Integrated Postsecondary Education Data System (IPEDS): Spring 2019, Fall Enrollmentcomponent.NOTE: For additional information about postbaccalaureate degree levels, see theMethodology Notes. N is the number of institutions in the comparison group.SOURCE: U.S. Department of Education, National Center for Education Statistics,Integrated Postsecondary Education Data System (IPEDS): Fall 2018, Completionscomponent.Figure 9.Figure 10. Percent of full-time, first-time degree/certificate-seekingundergraduate students who were awarded grant orscholarship aid from the federal government, state/localgovernment, or the institution, or loans, by type of aid:2017-18Number of students completing a degree, by level: 201718Image description.Degree levelHorizontalBarNumberchart with4 groups with 2 items per group.Xscale titledtitledof students.YscaleScale label.GroupDoctor's.Item 2,1,1,Yourinstitution0.01.Median (N 32) institution0.01.Median (N 32) stitution5. Median (N 32) 20.Item 1,2, stitution173.Median (N 32) tutionLegend,Label: Your institutionShapeComparisonGroupLegend,End of image description. Label: Comparison Group Median (N 32)Image description.Type of aidBar chart with 8 groups with 2 items per group.HorizontalXscale titledtitled ScalePercentof students.YscaleGroupAnyinstitutiongrant label.aid.79.Item 2,1,1,YourItemComparisonGroup Median (N 29) 72.GroupFederalgrants.Item1,2,Yourinstitution74. Median (N 29) oupItem74. Median (N 29) 67.Item 1,2, Yourinstitution11. Median (N 29) .Item1,5,Yourinstitution3. Median (N 29) 4.Item2,ComparisonGroupAnyinstitutionloans. GroupItem 2,1,6,Your92. Median (N 29) urinstitution92. Median (N 29) urinstitution13. Median (N 29) 0.01.Item 2, Comparison GroupShapeline,Label:ShapeInstitutionLegend,Label: Your institutionShapeComparisonGroupLegend,End of image description. Label: Comparison Group Median (N 29)Degree levelType of aidAny 6774Master's0State/localgrants 0Institutionalgrants5Bachelor's201134Any loansFederalloans17392849282Associate's20013Other loans 050100150200010Number of studentsYour institution30405060708090100Percent of studentsComparison Group Median (N 32)NOTE: For additional information about postbaccalaureate degree levels, see theMethodology Notes. N is the number of institutions in the comparison group.SOURCE: U.S. Department of Education, National Center for Education Statistics,Integrated Postsecondary Education Data System (IPEDS): Fall 2018, Completionscomponent.20Your institutionComparison Group Median (N 29)NOTE: Any grant aid above includes grant or scholarship aid awarded from the federalgovernment, state/local government, or the institution. Federal grants includes Pell grantsand other federal grants. Any loans includes federal loans and other loans awarded tostudents. For details on how students are counted for financial aid reporting, see CohortDetermination in the Methodological Notes. N is the number of institutions in thecomparison group.SOURCE: U.S. Department of Education, National Center for Education Statistics,Integrated Postsecondary Education Data System (IPEDS): Winter 2018-19, StudentFinancial Aid component.IPEDS DATA FEEDBACK REPORT5
Nightingale CollegeFigure 11. Average amounts of awarded grant or scholarship aidfrom the federal government, state/local government, orthe institution, or loans awarded to full-time, first-timedegree/certificate-seeking undergraduate students, bytype of aid: 2017-18Figure 12. Average amount of aid awarded to all undergraduates, bytype of aid: 2017-18Image description.Typeof aidBar chart with 8 groups with 2 items per group.HorizontalXscale titledtitled ScaleAid dollars.YscaleGroupAnyinstitutiongrant label.aid 5765.(N 25).Item1,1,YourItem2,ComparisonGroupMedian 5203.GroupFederalgrants(N 25).Item 2,1,2,Yourinstitution 5233.ItemComparisonMedian 4676.GroupPellinstitutiongrants Group(N 25).Item1,3,Your grants(N 13). 4480.Iteminstitution 5610.Item 1,2, N 16). 3500.Item1,5,Yourinstitution 4000.Item2,ComparisonMedian 1409.GroupAnyinstitutionloans Group(N 28).Item1,6,Your 11819.Item2,ComparisonGroupMedian 7380.GroupFederalloans(N 28).Item1,7,Yourinstitution 10255.Item2,ComparisonMedian 6406.GroupOtherloansGroup(N 12).Item1,8,Yourinstitution 10952.Item2,ComparisonGroupMedian 9014.Shapeline,Label:ShapeInstitutionLegend,Label: Your institutionShapeComparisonGroupLegend,End of image description. Label: Comparison Group MedianImage description.Typeof aidBar chart with 3 groups with 2 items per group.HorizontalXscale titledtitled ScaleAid dollars.YscaleGroupAnyinstitutiongrant label.aid. 4861.Item1,1,YourItem2,ComparisonMedian (N 32) 4678.GroupPellinstitutiongrants.GroupItem 2,1,2,Your 4691.ItemComparisonGroupMedian (N 32) 3918.GroupFederalloans.Item1,3,Yourinstitution 8778.Item2,ComparisonGroupMedian (N 32) 8048.Shapeline,Label:ShapeInstitutionLegend,Label: Your institutionShapeComparisonGroupLegend,End of image description. Label: Comparison Group Median (N 32)Type of aidType of aidAny grantaid (N 25) 5,765 5,203 4,861Federalgrants (N 25) 5,233 4,676Pellgrants (N 25) 5,233 4,480State/localgrants (N 13)Any grant aid 4,678 5,610 4,691 3,500Pell grantsInstitutionalgrants (N 16) 4,000 1,409 3,918Any loans(N 28) 11,819 7,380Federalloans (N 28) 10,255Other loans(N 12) 2,000 4,000 6,000 8,000 8,048 10,952 9,014 0 8,778Federalloans 6,406 10,000 12,000 0 2,000 4,000Aid dollarsYour institution 6,000 8,000 10,000Aid dollarsComparison Group MedianYour institutionComparison Group Median (N 32)NOTE: Any grant aid above includes grant or scholarship aid awarded from the federalgovernment, state/local government, or the institution. Federal grants includes Pell grantsand other federal grants. Any loans includes federal loans and other loans awarded tostudents. Average amounts of aid were calculated by dividing the total aid awarded by thetotal number of recipients in each institution. N is the number of institutions in thecomparison group.SOURCE: U.S. Department of Education, National Center for Education Statistics,Integrated Postsecondary Education Data System (IPEDS): Winter 2018-19, StudentFinancial Aid component.NOTE: Any grant aid above includes grant or scholarship aid from the federal government,state/local government, the institution, or other sources. Federal loans includes federalloans to students. Average amounts of aid were calculated by dividing the total aidawarded by the total number of recipients in each institution. N is the number ofinstitutions in the comparison group.SOURCE: U.S. Department of Education, National Center for Education Statistics,Integrated Postsecondary Education Data System (IPEDS): Winter 2018-19, StudentFinancial Aid component.Figure 13. Number of students receiving military educationalbenefits, by benefit type and student level: 2017-18Figure 14. Average amount of military educational benefitsreceived, by benefit type and student level: 2017-18Image description.Benefit typeandstudentlevelHorizontalBarchartwith4 groups with 2 items per group.Xscale titledtitledNumberof ates(N 32).Item 2,1,1,Yourinstitution38. Median 12.ItemComparisonGroupGroupPost-9/11graduates(N 0).Item1,2,YourinstitutionNo data.Item2,ComparisonGroupMedianNo data.Group3,TAPinstitutionundergraduates(N 32).Item1. MedianItem 1,2, esItem1,4,YourNo(N 0).data.Item2,ComparisonGroupMedian No data.Shapeline,Label:ShapeInstitutionLegend,Label: Your institutionShapeComparisonGroupLegend,End of image description. Label: Comparison Group MedianImage description.Benefit typeandstudentlevelHorizontalBarchartwith4 groups with 2 items per group.Xscale ost-9/11undergraduates(N 30).Item an13061.GroupPost-9/11graduates(N 0).Item1,2,YourinstitutionNo data.Item2,ComparisonGroupMedianNo data.Group3,TAPinstitutionundergraduates(N 5).Item3750.Item 1,2, YourComparisonGroupMedian 2750.GroupTAPinstitutiongraduatesItem1,4,YourNo(N 0).data.Item2,ComparisonGroupMedian No data.Shapeline,Label:ShapeInstitutionLegend,Label: Your institutionShapeComparisonGroupLegend,End of image description. Label: Comparison Group MedianBenefit type and student levelBenefit type and student level38Post-9/11 undergraduates (N 32)13,759Post-9/11 undergraduates (N 30)1213,061Post-9/11 graduates (N 0)Post-9/11 graduates (N 0)1TAP undergraduates (N 32)3,750TAP undergraduates (N 5)02,750TAP graduates (N 0)TAP graduates (N 0)0102030400Number of studentsYour institution5,0007,50010,00012,50015,000Benefit dollarsComparison Group MedianNOTE: N is the number of institutions in the comparison group. Post-9/11 refers to theDepartment of Veteran Affairs Post-9/11 G.I. Bill educational benefit. TAP refers to theDepartment of Defense Tuition Assistance Program educational benefit. Medians are notreported for comparison groups with less than three values.SOURCE: U.S. Department of Education, National Center for Education Statistics,Integrated Postsecondary Education Data System (IPEDS): Winter 2018-19, StudentFinancial Aid component.2,500Your institutionComparison Group MedianNOTE: N is the number of institutions in the comparison group. Post-9/11 refers to theDepartment of Veteran Affairs Post-9/11 G.I. Bill educational benefit. TAP refers to theDepartment of Defense Tuition Assistance Program educational benefit. Medians are notreported for comparison groups with less than three values.SOURCE: U.S. Department of Education, National Center for Education Statistics,Integrated Postsecondary Education Data System (IPEDS): Winter 2018-19, StudentFinancial Aid component.IPEDS DATA FEEDBACK REPORT6
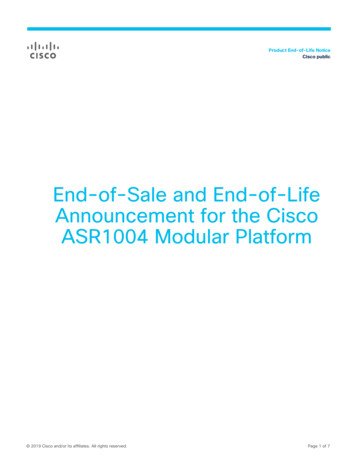
Nightingale CollegeFigure 15. Award and enrollment rates of first-time, full-time, degree/certificate-seeking undergraduates after 8 years of entry, by Pell status:2010-11 cohortPell(N 21)Image description.BarchartwithScale10 groupsX scalescaletitledlabel.with 2 items per group.YtitledPercent.GroupReceivedawardin 4 roup66.GroupReceivedawardinMedian6 years.Item upReceivedawardinMedian8 institution.Item0.01.Item 1,2, YourComparisonMedian0.01.GroupEnrolledat n 4 roup54.GroupReceivedawardinMedian6 roup54.GroupReceivedawardinMedian8 .Item 2,1, ComparisonYour institution0.01.Median 0.01.ItemGroupGroupEn
The custom comparison group chosen by Nightingale College includes the following 32 institutions: Ambria College of Nursing (Hoffman Estates, IL) American College for Medical Careers (Orlando, FL) AmeriTech College-Draper (Draper, UT) Angeles College (Los Angeles, CA) Arizona College-Mesa (Mesa, AZ) Bryant & Stratton College-Akron (Copley, OH)