Transcription
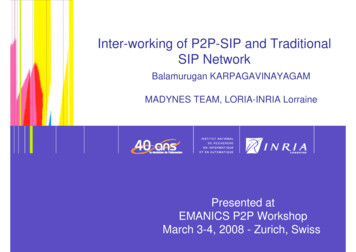
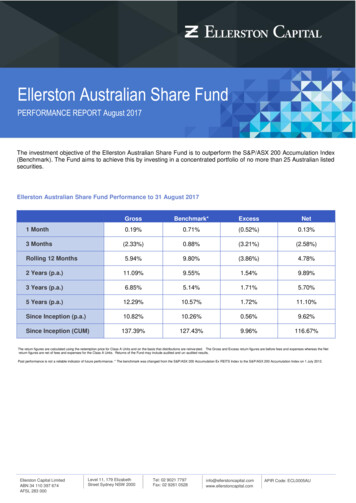
Ellerston Overlay Australian Share Fund (OASF)Performance Report June 19PERFORMANCE SUMMARY1Month3Months1Year3 Yearsp.a.5 Yearsp.a.Strategy SinceInception p.a.OASF0.47-1.79-8.045.625.148.55The Investment objective for theEllerston Overlay ASF is tooutperform the S&P/ASX 200Accumulation Index vestment StrategyNet %Investment ObjectiveThe Fund uses a benchmarkindependent, high convictionapproach that looks beyond investingin the Top 20 Australian equitystocks in order to capture theneglected opportunities and usesderivatives to enhance incomePast performance is not a reliable indicator of future performance.MARKET COMMENTARYMarket OverviewGlobal equity markets rallied strongly in June, delivering their second best monthly gain in a decade, as majorcentral banks signalled an easing bias. Developed Markets rose 6.6% and outperformed Emerging Markets by0.3% (in US terms). The main geopolitical event at month’s end was the G20 summit in Osaka. The summitconcluded with news that US President Trump and Chinese President Xi agreed to a “ceasefire” in the trade warbetween their two countries. Markets which anticipated a conciliatory outcome, have interpreted this as goodnews and have continued to rally in early July. In June, bonds rallied sharply too, with US 10-year bond yieldsfalling to 2.00% from 2.12%. Also of note was the continued strength in the iron ore price which was up anotherUS 11/t to close the month at US 116.5/t.USAKey InformationStrategy Inception 4 January 2012DateFund Net AssetValue 1.0451LiquidityWeeklyApplication Price 1.0477The S&P 500 Index and the Dow Jones Industrial Average Index were sharply higher in June, returning 7.1%(reaching a record high) and 7.3% respectively. The NASDAQ performed even better, 7.5%, with UberTechnologies raising US 8.1 billion in its IPO.Redemption Price 1.0425Key US economic activity indicators for May were mixed: manufacturing ISM missed, falling to 52.1 (consensus:53.0, previous: 52.8), non-farm payrolls also missed, but composite non-manufacturing ISM beat expectations,rising to 56.9 (consensus: 55.4). An easing bias indicated by the Fed was enough to lift markets.No Stocks19Management Fee0.90%EuropeBuy/Sell Spread0.25%European equities also delivered positive returns, with the Euro Stoxx 50 rising 6.0% in June, led by the BasicResources and Chemicals sectors. Leadership confusion continued in the UK post Theresa May’s resignation,with Boris Johnson in a strong position to take over as the UK’s next prime minister. The Europeans began topublically voice disagreements on who would steer the European Commission, the European Council and theECB. Uncertain political leadership dovetailed with moderating activity indicators: the flash Eurozonemanufacturing PMI for June came in at 47.8,misseing consensus expectations of 48.0.Performance Fee15%Firm AUMOver 5 BillionBut the ECB indicated that it was preparing fresh stimulus measures, buoying equity markets, with the FTSE100 returning 4.0%, France’s CAC 40 returning 6.8%, and Germany’s DAX doing 5.7%AsiaAsian equities also delivered very strong returns in the period. Chinese PMI held at 49.4, Chinese CPI came inat 2.7% (in line) and the May surplus of 41.7 billion beat consensus expectations of 22.3 billion. But it was theprospect of additional stimulus – the PBoC announcing further measures to boost the economy and the BoJaltering its bond buying – together with hopes of a resolution to the US-China trade that encouraged equityEllerston Capital LimitedABN 34 110 397 674AFSL 283 000Level 11179 Elizabeth StreetSydney NSW 2000Ph: 61 2 9021 7797Fax: 61 2 9261 comAPIR Code: ECL0012AU
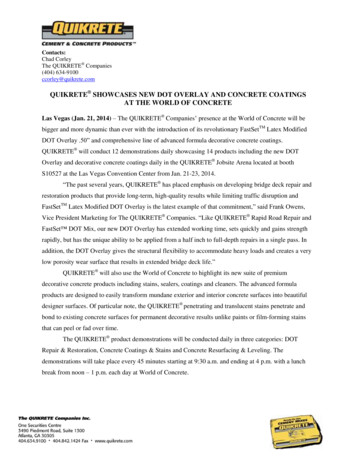
markets. Political tensions and riots in Hong Kong had no impact on the Hang Seng, with the Index rallying by 6.7%, while Japan’s Nikkei 225 was up 3.5%,Korea’s KOPSI Composite Index was up 4.4% and the Chinese SEE Total Market Index was up 5.6%.Global Equity Markets’ Performance in the month of June 2019Source: JP Morgan, Bloomberg.CommoditiesBulk commodities were mixed, but the outperformer was again iron ore, up US 11/t to US 116.5/t. While supply has been constrained due to the Vale disaster,in June, Brazil’s Superior Court removed the suspension imposed by the Minas Gerais State Court on the Laranjeiras dam, Brucutu’s main iron ore tailing facility.So Vale was allowed to restart wet processing capacity at Brucutu, a step-change to its full 30Mtpa (dry and wet processing). However, at the same time, Rioannounced a cut to its calendar year 2019 shipment guidance by 4% from 333-343Mt to 320-333Mt on mine supply issues, squeezing iron ore prices higher.Thermal coal and hard coking coal both retraced in June, with coking coal the worst performing commodity, falling 5.1%. Brent oil prices rose US 2.06/bbl toUS 66.55/bbl on a weaker US dollar and increased tensions between Iran and the US. And gold prices rallied 8% to US 1,409/oz during the month as concernsover global growth increased and record low interest rates reduced holding costs.Commodity Performance in June 2019Source: JP Morgan, Bloomberg.2 Ellerston Overlay Australian Share Fund (OASF)
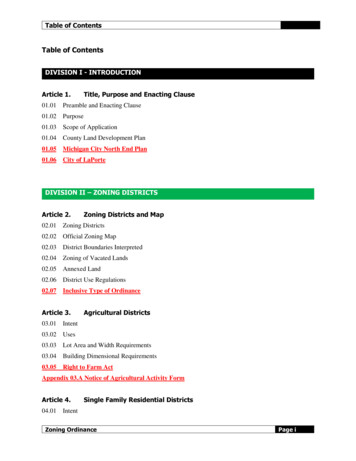
BondsGlobal growth concerns saw bonds rally in June with US 10-year bond yields falling to 2.00% and Australian 10-year bond yields down to 1.32%. Australian 10year bond yields have now widened their gap to US 10-year bond yields. Expectations of further rate cuts to stimulate a flagging economy are pushing the yieldcurve lower.AustraliaThe S&P/ASX 200 Accumulation Index ended the month up 3.7%, capping off an impressive 1H return of 19.7%, the best since 1991 and closingwithin 2% of its all-time high of 6829 pts (set on Nov 1st, 2017). The market returned 11.6% for FY19 and has yielded 24% from the December 21, 2018lows.ASX 200 Sector PerformanceSource: RIMES, S&P, Morgan Stanley ResearchFY19 performance pre and post 21-Dec-2018 low – the ASX has rallied 24% from 21-Dec-2018 lowSource: Bloomberg, Morgan StanleyFor June, the best three performing sectors were Materials ( 6.7%), Financials ( 3.5%) and Industrials ( 5.4%). The bottom three sectors were ConsumerDiscretionary (-1.5%), Information Technology ( 1.0%) and Utilities ( 3.2%).3 Ellerston Overlay Australian Share Fund (OASF)
In June, the Small Ordinaries Accumulation Index was the worst performer for the second month running despite a positive return of 0.9%, while the ASX 200Resources Accumulation Index was the best performer, up 6.4%. The ASX 200 Industrials Accumulation Index returned a solid 3.0%.The top five stocks that detracted from the performance of the S&P/ASX 200 Accumulation Index were Wesfarmers (-5 points), Vocus Group (-5 points),Challenger (-5 points), Lendlease (-5 points) and South32 (-4 points).The top five stocks that added to the positive index return were BHP Group ( 58 points), Commonwealth Bank of Australia ( 45 points), CSL ( 25 points),Newcrest Mining ( 21 points) and Westpac Banking Corporation ( 19 points).While business confidence bounced in May after the surprise re-election of the Coalition government, 1Q GDP data showed that the economy grew at a listless0.4% on the back of weak domestic demand. The annual growth rate of GDP dropped to 1.8% from 2.4%, the lowest since the negative effects of the GFC in2009.After holding rates steady for three years, the RBA cut the cash rate to a historic low of 1.25% in June. The RBA claimed that it took the decision to supportemployment growth and provide confidence that inflation will be consistent with its medium-term target. The consensus expectation is for further rate cuts in thecoming months. Following its meeting on 2nd of July (at the time of writing), the RBA cut cash rates by another 25 basis points to 1.00%. The RBA’s July statementsaid: the easing of monetary policy will support employment growth and provide greater confidence that inflation will be consistent with the medium-term target.The statement also noted that global financial conditions remain accommodative, but “consumption growth remains subdued”, and “demand for credit by investorscontinues to be subdued”.The AUD was up against the USDbut was among the weakest “risk on” currencies, underperforming the Canadian dollar, Norwegian Krone and New Zealanddollar. It ended the month at 0.7020 against the USD.4 Ellerston Overlay Australian Share Fund (OASF)
COMPANY SPECIFIC NEWSThe Market MissesVocus Group (VOC, -28.8%)Two potential acquirers walked away from their takeover bids in June. First it was the Swedish private equity outfit EQT withdrawing its 2.3bn offer, and thenAGL. Several parties have now conducted due diligence on VOC and not liked what they have seen. Another takeover bid seems increasingly unlikely. So themanagement team will have to execute on their turnaround strategy if shareholders are to generate a satisfactory return on their investment.Pilbara Minerals (PLS, -24.3%)This lithium miner warned customer demand for its materials in the June quarter had been softer than initially anticipated. A key customer in China has beenslow to ramp up their processing capacity. This news only compounded the impact of recent weakness in lithium prices.Challenger Limited (CGF, -17.7%)At its investor day, CGF reset its earnings and ROE targets. CGF guided to a lower equities normalised growth rate assumption, softer sales from the ongoingdisruption to financial planners and walked away from its pre-tax ROE target of 18%. This resulted in FY20 earnings being downgraded and caused a de-ratingof the stock, causing it to perform poorly in the month. CGF shares slumped to a three year low.Link Administration (LNK, -16.3%)LNK issued an earnings downgrade in the month and attributed it mainly to one-off factors, namely business delays caused by Brexit and higher costs fromearlier than anticipated implementation of “Protecting Your Super” legislation. Earnings were downgraded by double digits in FY19 and FY20 and a shadowwas cast over management’s credibility. It’s likely that the stock will be in the “sin bin” until confidence in its earnings prospects and management returns.Ardent Leisure Group (ALG, -12.9%)Dave & Buster’s Entertainment, a competitor to ALG’s Main Event business in the United States, issued a quarterly earnings report below market expectationsand downgraded its earnings guidance for the full year. The 19% fall in the Dave and Buster’s share price unfortunately dragged ALG down with it.The Market HitsNanosonics Limited (NAN, 24.9%)Some fresh broker research reminded investors there is potentially a significant opportunity to grow revenue from the company’s unique ultrasound probedisinfection technology. The stock price has now doubled since January.Ausdrill (ASL, 24.6%)The mining services company announced a material contract win to construct and operate a copper-silver mine in Botswana, Africa.Bingo Industries (BIN, 22.5%)Shares in Bingo rallied during the month as the company seeks 20-25% price increases across its NSW business to compensate for QLD landfill levies, othercost increases and increased demand for its post-collections capacity.Northern Star Resources (NST, 20.0%), Regis Resources (RRL, 18.7%), Newcrest Mining (NCM, 17.4%)The surge in the gold price, to record levels in AUD terms, on the expectation for monetary easing across the globe and heightened geopolitical tensionshelped most gold miners. NST also confirmed it is on track to meet its production guidance (850-900koz) at an average cost of A 1,225-1,275/oz.Eclipx Group (ECX, 17.0%)This fleet leasing company continued to re-rate as the market reacted to the newly appointed CEO’s plans to sell non-core assets (Grays Online andRight2Drive) and simplify its fleet business.Austal Limited (ASB, 24.6%)Austal was admitted to the S&P/ASX 200 index during the month and the latest US Congress report appears supportive of Austal’s workload beyond thecurrent Littoral Combat Ship (LCS) program.5 Ellerston Overlay Australian Share Fund (OASF)
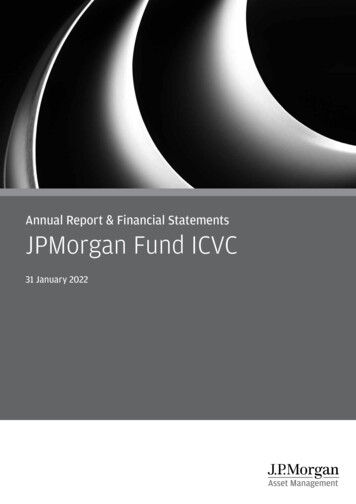
FUND PERFORMANCEThe Fund delivered a return of 0.56% in the month of June, capping off a very disappointing financial year where we significantly underperformedthe benchmark return of 11.55%.Returns1 (%)GrossBenchmarkExcessNet1 Month0.563.70-3.140.473 Months-1.517.97-9.49-1.79Rolling 12 Months-7.0611.55-18.61-8.043 Years (p.a.)6.5112.88-6.375.625 Years (p.a.)6.118.85-2.755.14Since Inception* (p.a.)9.6511.43-1.788.55Source: Ellerston Capital LimitedSecurities HeldSecurities Not HeldSource: Ellerston Capital LimitedFor the month of June, the main detractors were overweight positions in Fletcher Building (FBU -5.5%), JB Hi-Fi (JBH -8.1%), Computershare (CPU -2.3%), StarEntertainment (SGR -7.8%) and Treasury Wine Estates (TWE -0.9%).Having a zero holding in BHP (BHP 9.0%) and Newcrest (NCM 17.4%) also contributed to the Fund’s underperformance.The main positive contributors to this month’s performance and again, not enough to effectively cover the weight of the detractors, were overweight positions inBluescope Steel (BSL 14.3%) and Aristocrat Leisure (ALL 5.5%).Having zero holdings in Westfarmers (WES -2.4%), National Australia Bank (NAB 0.9%), ANZ Bank (ANZ 1.2%), South32 (S32 -4.2%) and Lendlease (LLC-8.8 %) also contributed positively, albeit marginally.Returns are calculated using the Fund's redemption price and are net of fees and expenses. Returns are also calculated on the basis that distributions are reinvested.Returns of the Fund may include audited and un-audited results.The benchmark was changed to the S&P/ASX200 Accumulation Index on 4 January 2012. Past performance is not a reliable indicator of future performance.*Since Inception is 4 January 2012.Source: Ellerston Capital Limited16 Ellerston Overlay Australian Share Fund (OASF)
The Fund’s 12 month performance has been totally unsatisfactory with market conditions not suiting our valuation-disciplined approach. In thefinancial year to end of June 2019, there have been some clear stock specific factors that have contributed to underperformance, coupled with nonstock specific factors like momentum, size and dividend yield.At the start of the financial year, we expected volatility and we thought that we were well positioned for the reflation trade and anticipated higher interest rates in2H18, but disappointingly, we unwound all our previous alpha generation and underperformed. The strategy which had been working until mid-way throughCY2018, unravelled when we encountered the “perfect storm”: Poor stock selection this year predominantly in the Materials sector was the major performance detractor:‒ Namely, Nufarm, Bluescope, Fletcher Building.‒ Many of our core stocks suffered significant de-ratings (despite delivering on earnings e.g. Treasury Wine Estates). Momentum, Size and Dividend Yield were also key detractors:‒ Momentum worked against us with some of our biggest positions falling in share price at the same time, but for different reasons(correlation impact).‒ Size worked against us with Large Caps (ASX Top 20) significantly outperforming their Mid Cap peers by over 1,000 basis points andSmall Ords by over 1,200 basis points during the year.Performance for the 12-months to 30 June 2019. Our Ex-Top 20 Mid-Cap orientation hurt performanceSource: RIMES, Morgan Stanley Research, Accumulation Returns‒ Dividend Yield worked against us (not banks) with our big underweight position in miners (BHP Group, RIO Tinto, Fortescue MetalsGroup) which paid special dividends to clear franking credits ahead of the federal election, particularly hurting. These stocks subsequentlycapitalised on the unforeseen immediate spike in iron ore prices post the Vale dam disaster in January 2019 and continued to pay healthydividends.Our zero Banks position has not impacted performance, as the Banking sector was broadly a market performer for FY19 (Banks TR 10.1%versus the ASX 200 Accumulation Index return of 11.6%). The CBA return of 20.4% was the main driver, with ANZ, NAB and WBC allunderperforming, with a total return of 6.0%, 4.8% and 3.9% respectively.Our selectively contrarian and valuation disciplined approach worked against us in FY19, as investors chased Growth and Momentum.Global Value spread has jumped above the previous dot.com peak as the Growth mega-cycle rolls on.Off the Charts! Valuation spread between value and growth stocks breaks though previous dot.com bubble peak.Source: UBS European Equity Strategy, UBS Quant Group, 1 July 2019.NB – P/Book spread between top and bottom tercile of stocks ranked by a Value composite measure of P/Book, PE and Dividend Yield. This is measured sector-neutral.7 Ellerston Overlay Australian Share Fund (OASF)
FUND ACTIVITYIn June, we strengthened Core positions (Treasury Wine Estates, BlueScope Steel, Orica, Macquarie Group and Flight Centre) and took further profitsin JB Hi-Fi as the shares spiked towards 28.00 (we have now halved the position in JBH from where it was in January) as we look to reduce theportfolio’s consumer discretionary, domestic retail exposure. We also trimmed the Fletcher Building position ahead of its investor day, as the sharesrallied in anticipation of expected capital management initiatives to be announced.NEW STOCKS ADDEDSTOCKS EXITED NoneNonePOSITIONS INCREASEDPOSITIONS DECREASED Treasury Wine Estates JB Hi-Fi Bluescope Steel Macquarie Group Orica Flight Centre8 Ellerston Overlay Australian Share Fund (OASF)Fletcher Building
FUND STRATEGY AND OUTLOOKWe remain committed to our bottom up, stock focussed strategy as we seek to identify mispriced stocks where earnings growth is underappreciated.This month we have provided write-ups on two stocks – namely, Aristocrat Leisure and Woodside Petroleum – that are Core holdings in your portfolioand the reasons we consider them good long-term investments. We have also provided an updated view on the banks sector and the reasons westill remain cautious.We reiterate our concerns on the sustainability of earnings ahead of the upcoming reporting season, which we approach with some trepidation given the marketscomplacency and valuation insensitivity.Following the extended run of positive prints, taking CY19 gains to 20%, valuations continue to squeeze higher, despite a subdued earnings growth profile.Forward consensus multiples are now 22.5 times for the Industrials ex-Financials and may be justified in a historically low interest rate environment.The conundrum facing all investors of course, is: what is the correct discount rate to input?ASX 200 Industrials ex FinancialsAnnual consensus EPS Growth FY18 - FY21Source: RIMES, IBES, Morgan Stanley Research.We target the best longer-term stock opportunities and it is worth restating our segmented portfolio positioning:9 Ellerston Overlay Australian Share Fund (OASF)
Aristocrat Leisure (ALL)Aristocrat made a return to your portfolio in December 2018 following a sharp pull back from recent highs of over 32.00. Since then, the share price hasoutperformed the S&P/ASX 200 Index by 20%. So why is it still 6% of the portfolio? In short, the investment case is playing out as we expected. There isstill a long runway of growth ahead and that growth is not being appropriately reflected in the share price.Aristocrat share price (A uced to Portfolio19.0017.00Jun 17Jul 17Aug 17Sep 17Oct 17Nov 17Dec 17Jan 18Feb 18Mar 18Apr 18May 18Jun 18Jul 18Aug 18Sep 18Oct 18Nov 18Dec 18Jan 19Feb 19Mar 19Apr 19May 1915.00Source: Bloomberg, Ellerston Capital Limited.In the slot machine and game industry, the product cycle is all important. The number of machines and games sold in key markets (eg US and Australia) istypically stable from year to year. What does change, is manufacturer market share based on relative game performance. The significant operating leverage inthese businesses means changes in customer preference (revenue) will have a material impact on earnings.Aristocrat’s game performance and best in class content remain market leading. In our view, ALL will continue to take market share from its rivals. In theUS, the rollout of the Lightning Link family of games is nearing completion. But the Dragon Link franchise is far from saturation. The installation of more DragonLink games at attractive fixed fee per day rates will continue to see Aristocrat build its base of recurring revenue. Aristocrat’s total portfolio of gamescontributes approximately 28% of revenue for casinos, but only makes up 22% of the installed base (source: Eilers-Fantini game performance database). Itmakes economic sense for casino customers to add more Aristocrat games to their floor than to switch to a new game from most other manufacturers. Aristocratis also expanding successfully into market adjacencies and regions where it previously had little or no presence - stepper, bar top, Washington CDS, CanadianVLT.In Australia, both the Lightning and Dragon Link franchises are near saturation. But importantly, it is Aristocrat that has the best performing new title in the market- Welcome to Fantastic Jackpots. Aristocrat should be able to sustain its clear number one position in the Australian market in the near term. One just has to lookat the Ainsworth Game Technology (AGI) share price, which has fallen from 4.00 to 67 cents (with a market cap of only 225m) to reach that conclusion. Thatsaid, Australia only makes up 15% of earnings for Aristocrat.Aristocrat’s Digital business is a market leader in an industry that is set to grow at circa high single digits for several more years. Misunderstanding of the digitalbusiness’s earnings profile created the opportunity for us to buy back into Aristocrat in December. The market had seriously underestimated the amount Aristocratneeded to spend on user acquisitions to support new game releases and to sustain the revenue growth trajectory.10 Ellerston Overlay Australian Share Fund (OASF)
Early signs from that user acquisition spend are encouraging. The revenue uplift is coming through for new game releases Raid: Shadow Legends and Toy StoryDrop. The social casino titles remain strong performers, aided by the release of new game features (collectibles, leagues).Source: Evans & Partners, selected Aristocrat new social casual games - gross revenue ranking in Apple App StoreThe investment case for Aristocrat has evolved over the last few years from the successful launch of the Lightning and Dragon franchises, the companytransforming acquisition of VGT, Digital social casino growth and new adjacencies. The investment case still has at least one more evolution to play out.Aristocrat’s Digital business has a very strong position in the social casino market and emerging presence in some segments of the social casual market. Thesocial casual market is enormous and remains largely untapped/underpenetrated by Aristocrat. We would expect Aristocrat to enter additional segments of thesocial casual market, largely through content partnerships with small scale game development studios and even possibly through further M&A, just as thecompany successfully did in the land based market.One of the beauties of the Aristocrat investment case is the strength of the balance sheet and the optionality it provides the management team who have in thepast, executed well. The business is highly cash generative and gearing is declining at a rapid rate - ND/EBITDA should be less than 1.0x by FY20. The need tomake acquisitions in the digital arena appears to have subsided, as Aristocrat looks to enter more content partnerships with smaller game design studios. A buyback or some other form of capital management may not be far away.Market share gains in the land based casino market in the US, stable earnings in Australia and the Rest of the World and continued growth from the digitalbusiness is likely to deliver earnings growth at approximately 13% pa for the next three years. Yet Aristocrat continues to trade at a discount to AustralianIndustrials and on earnings multiples that imply an imminent sharp earnings decline. The recent listing of the digital business SciPlay from close competitorScientific Games, trading at 14-15x EBITDA, only reinforces the relative attractiveness of Aristocrat’s valuation, less than 13x EBITDA.ALL vs S&P/ASX200 ex Resources, Financials & Property - Prospective Relative PERPrem/Disc (%)ALL 12M Fwd PE 20.6,80S&P/ASX200 ex Resources, Financials & Property 22.3,7.6%)PER Relative 92.4% (Discount of7060504030 1 StDev: 127.1% 42.5920Ave REL PER: 112.8%100-1 StDev: 98.5% 37.81 33.02 30.87-10-20-30Jun-09Apr-10Feb-11Dec-11Source: Datastream, FactSet, CLSA11 Ellerston Overlay Australian Share Fund g-18Jun-19Prices: 27-Jun-2019
Further evidence of the relative attractiveness of Aristocrat is visible in a comparison with the ‘traditional high PE’ and ‘hyper-PE’ stocks. Aristocrat’srevenue growth and return on capital profile is at the upper end of the range for the group but trades at a more attractive multiple than the peer group.Source: JP MorganAristocrat represents relatively attractively priced growth in an Australian market where growth is prohibitively expensive.Aristocrat will remain a significant position in your portfolio while the market underestimates the delivery of its growth profile.Woodside (WPL): Why it’s still 7.5% of your PortfolioWPL’s Burrup Hub concept to drive medium to long term growth potential:We view WPL as a tier 1, quality defensive stock within the Australian E&P sector given its solid leadership, low-cost operations, strong balance sheetand ability to pay healthy, fully franked dividends (payout range 50-80%).Over the past 12 months, WPL has outperformed its closest ASX-listed Energy peer Oil Search (OSH) by 28% as its business benefitted from relative capitalflexibility, a stable regulatory outlook and strong cash flows to progress on its three Horizons of growth to 2025.WPL is in a privileged position of generating a globally competitive EBITDAX Margin of 70%, with its superior production CAGR of 7% from Calendar 2018 to2025 to be phased over the next decade. The first phase of growth will be driven by the ramp up of Wheatstone and start-up of Greater Enfield (in 2H of 2019).WPL’s Australian LNG projects - North-West Shelf, Pluto T1 plus T2, and Wheatstone account for the bulk of the company’s valuation and attraction.Ramp-up of Wheatstone will progress over the next 12 months, combined with commissioning Greater Enfield oil to support a 6% production CAGR to 2020,ahead of its ASX-listed peers, followed by Senegal, Scarborough and Browse. WPL’s two largest brownfield development projects, Scarborough and Browse,which will be leveraging off existing infrastructure, are long-dated. Both present significant upside when fully commissioned (guided capex of US 11bn on thedevelopment of Scarborough and US15bn on the development of Browse in 2018 real terms, with FIDs targeted for 2020 and 2021 respectively).The key to a re-rating of the stock rests with the progression of these major projects. WPL is gradually de-risking from this current capex cycle and we believethis is not reflected in the current share price.Next steps to de-risking these projects include the signing of a tolling agreement in the 2H 2019 to support alignment of the infrastructure JV partners in theBurrup Hub with the upstream field developers. After which FID on Scarborough and Browse is expected in 2020 and 2021 respectively.Finally, ahead of FID on Scarborough, we expect Woodside to farm-down some of its interest in the development. Woodside currently owns a 75% interest andthe farm-down is expected to support a de-risking of valuation for the asset.In the near term, production growth is comfortably ahead of its peers at 7% from 2019 to 2020, versus a sector average of 1.3%.12 Ellerston Overlay Australian Share Fund (OASF)
WPL’s strong earnings and production growth profile.The Burrup Hub project and the development of the Scarborough and Browse projects combine with Senegal development and Woodside’s baseportfolio to deliver 45% production from 2019 to 2025.Our DCF for the company increases steadily to A 49.97 over time (2025 forward valuation).Production CAGR growth versus peers2018-21/23: normalised for Santos acquisition of Quadrant Energy13 Ellerston Overlay Australian Share Fund (OASF)EBITDA CAGR growth versus peers2018-21/23: normalised for Santos acquisition of Quadrant Energy
EV/EBITDA versus peersEV/2P versus peersConversion of Scarborough and Browse to 2P Reserves lowersWoodside’s EV/2P multiple to 12.1x on current capex guidanceSource: Goldman Sachs Research, June 2019WPL’s balance sheet remains pristine and should have limited funding requirements ahead of target FID. On an 80% EPS payout ratio and aUS 65/bbl brent oil price to 2025, Woodside (on our current estimates), is expected to cumulatively yield 17.04 per share by 2025,equivalent to an average annual yield of 7.7% versus the ASX-listed peers trading on an average yield of 2.9% on a 12 month forward basis.Target gearingWoodside raised US 1.95bn in February 2018 to strengthen its balance sheet ahead of its next phase of growthDividend Yield versus peers14 Ellerston Overlay Australian Share Fund (OASF)FCF yield verses peers
Risks:Any major production or timing disruption to a key facility or to a new project, would have serious ramifications for earnings and valuation.WPL is exposed to the cyclicality of the Oil and LNG markets, where periods of short term over/under supply drive price volatility.Global LNG Supply-Demand Balance, China’s environmental andcleaner air drive should underpin the longer term demand for LNG.Source: CLSA, FGE, Dr. Fereidun Fesharaki, May 2019Downside risks to LNG spot prices and contractrepricing with new Trains listed
Europe Buy/Sell Spread European equities also delivered positive returns, with the Euro Stoxx 50 rising 6.0% in June, led by the Basic Resources and Chemicals sectors. Leadership confusion continued in the UK post Theresa May's resignation, . Vocus Group (-5 points), Challenger (-5 points), Lendlease (-5 points) and South32 (-4 points).