Transcription
THE JOURNALOF FINANCE* VOL. L, NO. 1 * MARCH 1995Size and Book-to-Market Factors inEarnings and ReturnsEUGENE F. FAMA and KENNETH R. FRENCH*ABSTRACTWe study whether the behavior of stock prices, in relation to size and book-tomarket-equity (BE/ME), reflects the behavior of earnings. Consistent with rationalpricing, high BE/ME signals persistent poor earnings and low BE/ME signalsstrong earnings. Moreover, stock prices forecast the reversion of earnings growthobserved after firms are ranked on size and BE/ME. Finally, there are market, size,and BE/ME factors in earnings like those in returns. The market and size factorsin earnings help explain those in returns, but we find no link between BE/MEfactors in earnings and returns.FAMAAND FRENCH (1992) FIND that two variables,market equity (ME) and theratio of book equity to market equity (BE/ME) capture much of the crosssection of average stock returns. If stocks are priced rationally, systematicdifferences in average returns are due to differences in risk. Thus, withrational pricing, size (ME, stock price times shares outstanding) and BE/MEmust proxy for sensitivity to common risk factors in returns. Fama andFrench (1993) confirm that portfolios constructed to mimic risk factors related to size and BE/ME add substantially to the variation in stock returnsexplained by a market portfolio. Moreover, a three-factor asset-pricing modelthat includes a market factor and risk factors related to size and BE/MEseems to capture the cross-section of average returns on U.S. stocks.The evidence that size and book-to-market-equity proxy for sensitivity torisk factors in returns is consistent with a rational-pricing story for the roleof size and BE/ME in average returns. But return tests cannot tell acomplete economic story. Size and BE/ME remain arbitrary indicator variables that, for unexplained economic reasons, are related to risk factors inreturns. The goal here is to begin to fill this economic void. Specifically, westudy whether the behavior of stock prices, in relation to size and book-tomarket-equity, is consistent with the behavior of earnings.We first ask whether stock prices properly reflect differences in the evolution of profitability when stocks are grouped on size and BE/ME. We confirmthat, as predicted by simple rational-pricing models, BE/ME is related to* Graduate School of Business, University of Chicago, 1101 East 58th St., Chicago, IL 60637,and Yale School of Management, Box 208200, New Haven, CT 06520. The comments of DavidBooth, Josef Lakonishok, Stephen Penman, Rex Sinquefield, Rene Stulz, and two referees aregratefully acknowledged. This research is supported by the National Science Foundation (Fama)and the Center for Research in Securities Prices (French).131
132The Journal of Financepersistent properties of earnings. High BE/ME (a low stock price relative tobook value) signals sustained low earnings on book equity. High-BE/MEstocks are less profitable than low-BE/ME stocks for four years before and atleast five years after ranking dates. In a nutshell, low BE/ME (a high stockprice relative to book value) is typical of firms with high average returns oncapital (growth stocks), whereas high BE/ME is typical of firms that arerelatively distressed.Size is also related to profitability. Controlling for BE/ME, small stockstend to have lower earnings on book equity than do big stocks. The size effectin earnings is, however, largely due to the low profits of small stocks after1980. Until 1981, profitability shows little relation to size. But the recessionof 1981 and 1982 turns into a prolonged earnings depression for small stocks.For some reason, which remains unexplained, small stocks do not participatein the boom of the middle and late 1980s.Like Penman (1991), we find that low-book-to-market-equity firms remainmore profitable than high-BE/ME firms for at least five years after portfoliosare formed on BE/ME. Like Lakonishok, Shleifer, and Vishny (LSV, 1994),however, we find that the growth rates of earnings of low- and high-BE/MEstocks become more similar in the years after portfolio formation. LSV arguethat the market does not understand this convergence of earnings growth.They hypothesize that in the years after portfolio formation, the marketextrapolates the strong pre-formation earnings growth of low-BE/ME stocksand the poor growth of high-BE/ME stocks. Low-BE/ME stocks then havelow average returns because future earnings growth is weaker than themarket expects, and high-BE/ME stocks have high average returns becauseearnings growth is stronger than expected. In short, LSV hypothesize thatthe higher average returns of high-book-to-market stocks simply correctirrational pricing.Our tests do not support the LSV story. The behavior of earnings/priceratios and stock returns suggests that once stocks are allocated to portfoliosbased on size and BE/ME, the market makes unbiased forecasts of earningsgrowth. Specifically, the market understands that the vastly different earnings growth rates of low- and high-book-to-market stocks prior to portfolioformation tend to converge in the post-formation period.Our evidence on the evolution of profitability and earnings/price ratios inrelation to size and book-to-market-equity is consistent with rational pricing.It also provides an interesting picture of how size and BE/ME relate toeconomic fundamentals. But this initial analysis does not address the specificasset-pricing issue raised by the size and BE/ME risk factors in stockreturns. Rational stock prices are discounted expected future earnings (netcash flows). If the size and BE/ME risk factors in returns (unexpectedchanges in stock prices) are the result of rational pricing, they must be drivenby common factors in shocks to expected earnings that are related to size andBE/ME.We document size and book-to-market factors in earnings like those inreturns. The earnings of firms in different size-BE/ME groups load on
Size and Book-to-Market Factors in Earnings and Returns133market, size, and BE/ME factors in earnings in much the same way thattheir stock returns load on the market, size, and BE/ME factors in returns.The fact that the common factors in returns mirror common factors inearnings suggests that the market, size, and book-to-market factors in earnings are the source of the corresponding factors in returns. The tracks of themarket and size factors in earnings are clear in returns. The weak link in ourrational asset-pricing story is, however, the absence of evidence that thebook-to-market factor in earnings drives the book-to-market factor in returns.We speculate that this negative result is caused by noise in our measure ofshocks to expected earnings.The tests center on six portfolios formed on ranked values of size andBE/ME for individual stocks. The first step (Sections I and II) is to describethe portfolios and our measure of profitability. We then (Section III) examinethe behavior of earnings for the 11 years around portfolio formation. Thepurpose is to study the evolution of profitability for a long period before andafter firms are ranked on size and BE/ME. Section IV examines profitabilityin chronological time, to show how the performance of different size andbook-to-market combinations relates to business conditions. Section V usesearnings/price ratios, earnings growth rates, and stock returns to study theLSV extrapolation story. Having established in Sections III and IV that thelevel of earnings is related to size and BE/ME, we show in Section VI thatthere are market, size, and BE/ME factors in shocks to earnings that look alot like those in stock returns. Section VII then examines the links betweenreturns and these common factors in earnings.I. The Size-BE / ME PortfoliosWe focus on six portfolios, formed yearly from a simple sort of firms into twogroups on ME and another simple sort into three groups on BE/ME. In Juneof each year t from 1963 to 1992, we rank all New York Stock Exchange(NYSE) stocks in the Center for Research in Securities Prices (CRSP) databaseon size, ME (price times shares outstanding). We then use the median NYSEsize to allocate NYSE, American Stock Exchange (AMEX), and (after 1972)NASDAQ Stock Market stocks to two groups, small or big (S or B). MostAMEX and NASDAQ stocks are smaller than the NYSE median, so the smallgroup contains many more stocks (3626 of 4878 in 1992). But the small groupcontains far less than half (about 7.3 percent in 1992) of the combined valueof the two size groups.We also break NYSE, AMEX, and NASDAQ stocks into three book-tomarket groups based on the breakpoints for the bottom 30 percent (Low),middle 40 percent (Medium), and top 30 percent (High) of the ranked valuesof BE/ME for NYSE stocks. BE/ME is book common equity for the fiscalyear ending in calendar year t - 1, divided by market equity at the end ofDecember of year t - 1. We do not use negative BE firms, which are rare onCOMPUSTAT prior to 1980, when calculating the breakpoints for BE/ME orwhen forming the size-BE/ME portfolios.
134The Journal of FinanceThe final portfolios are the six intersections of the two ME and the threeBE/ME groups (S/L, S/M, S/H, B/L, B/M, and B/H). For example, theS/L portfolio contains the stocks in the small-ME group that are also in thelow-BE/ME group, while the B/H portfolio contains the big stocks that alsohave high BE/ME. Monthly value-weighted stock returns for the six portfolios are calculated from July of year t to June of year t 1, and the portfoliosare reformed in June of year t 1. We calculate returns beginning in July ofyear t to be sure that book equity for year t - 1 is known.To be included in the returns tests, a firm must have CRSP stock prices forDecember of year t - 1 and June of year t, and COMPUSTAT book equity foryear t - 1. When we examine profitability and other fundamentals, we alsorequire that firms have COMPUSTAT earnings and sales for year t. Thisadded data requirement is not imposed when we calculate stock returns,however, so it does not lead to look-ahead bias in the returns. Moreover, toreduce the survival bias inherent in the way COMPUSTAT adds firms to itstapes (Banz and Breen (1986)), we do not include firms until they are onCOMPUSTAT for two years. Finally, we choose 1962 as the start date for thetests because COMPUSTAT data prior to 1962 have a strong bias toward big,successful firms.II. Profitability:Earningson Book EquityOur measure of profitability is EI(t)/BE(t - 1), the ratio of commonequity income for the fiscal year ending in calendar year t to the book valueof common equity for year t - 1. EI(t) is earnings before extraordinary itemsbut after depreciation, taxes, interest, and preferred dividends. EI(t) is areasonable proxy for the economic income for year t on the book equity ofyear t - 1 if depreciation (book not tax) is a reasonable measure of the valueof assets used up in generating sales. We can report, however, that measuring income before depreciation, or before depreciation and taxes, producesresults like those for EI(t)/BE(t - 1).EI(t)/BE(t - 1) is the sum of EIi(t) for all firms i in a portfolio, divided bythe sum of BEi(t - 1). EI(t)/BE(t - 1) is thus the return on book equity of afirm that would result from merging all firms in the portfolio.We would prefer an inflation-adjusted measure of book common equity inEI(t)/BE(t - 1), but it is not generally available. For our purposes, this isnot a problem if the effect of inflation on EI(t)/BE(t - 1) does not differsystematically across the six size-BE/ME portfolios.III. The Persistenceof ProfitabilityA simple model is useful for thinking about the relation between book-tomarket-equity and expected stock return, and between BE/ME and earningson book equity. Consider an all-equity firm that finances its investmentsentirely with retained earnings. Dividends paid by the firm in any year t
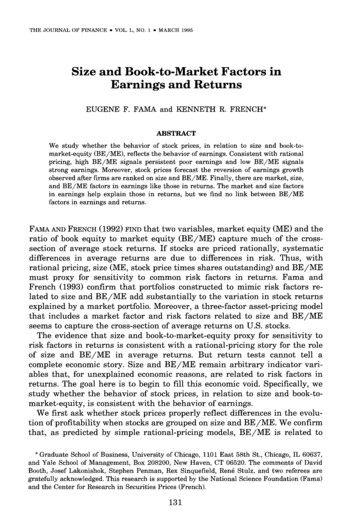
Size and Book-to-Market Factors in Earnings and Returns135(D(t)) are equal to equity income plus depreciation (DP(t)) minus investmentoutlays (I(t)),D(t) EI(t) DP(t)-I(t).Suppose that at time t expected depreciation and investment for any yeart i are proportional to expected future equity income, that is,EtD(t i) Ej[EI(t i) DP(t i) EtEI(t i)(1 k -k2),-I(t i)]where k1 and k2 are the proportionality factors. If the discount rate, r, forexpected dividends is constant, the value of market equity at t is,ME(t) (1 k1-00 E EI(t i)(1 r)k2) E(1)and the ratio of market-to-book-equity is,BE?(t).i 1(1 r)(2This simple model predicts that firms with higher required equity returns,r, will have higher book-to-market ratios. The prediction is consistent withthe positive relation between average stock return and BE/ME observed byFama and French (1992, 1993) and others. More important for currentpurposes, equations (1) and (2) say that brief periods when equity income isexpected to be high or low relative to book equity do not have much effect onmarket equity and the book-to-market ratio. Thus, the prediction is that highBE/ME should be associated with a persistently low ratio of earnings to bookequity, while low BE/ME should be associated with persistently strongEI/BE. Figure 1 supports this prediction.Figure 1 shows mean values of EI(t i)/BE(t i - 1) for 11 years aroundportfolio information. For each portfolio formation year t, the ratios arecalculated for year t i, i -5, . , 5, using firms with accounting data foryears t and t i, but not necessarily for other years. The ratio for year t iis then averaged across portfolio formation years. The plots capture averageprofitability, as a function of size and BE/ME, for a long period aroundportfolio formation. The question addressed is: how do earnings behave beforefirms are classified as small or big on ME and low or high on BE/ME, andhow does profitability evolve in the years after portfolio formation?Like Tables 2 and 3 in Penman (1991), Figure 1 shows that book-tomarket-equity is associated with persistent differences in profitability, measured by EI/BE. Low-BE/ME stocks are on average more profitable thanhigh-BE/ME stocks for four years before and at least five years afterportfolio formation. Moreover, although the simple model of equations (1) and
The Journal of 4.0.00-5,,-4-3,-2-1Year i Relative0I,12345to Ranking YearFigure 1. The 11-year evolution of earnings on book equity, EI(t i) /BE(t i - 1),for size-BE/MEportfolios formed in June of year t (year 0 on the horizontal axis). Foreach portfolio formation year t 1963 to 1991, the ratios are calculated for t i, i - 5,., 5.The ratio for t i is then averaged across portfolio formation years t. EI(t i) is earningsbefore extraordinary items but after interest, depreciation, taxes, and preferred dividends for thefiscal year ending in calendar year t i. BE(t i - 1) is book common equity for t i - 1. S orB indicates that the portfolio contains NYSE, AMEX, and NASDAQ stocks below (S) or above (B)the median size (ME) of NYSE stocks. L or H indicates that the portfolio contains NYSE, AMEX,and NASDAQ Stocks in the bottom 30 percent (L) or top 30 percent (H) of the values ofbook-to-market-equity (BE/ME) for NYSE stocks.(2) makes no prediction on the matter, Figure 1 shows that profitability isalso related to size. Small stocks have persistently lower EI/BE than bigstocks.BE/ME is, however, a stronger indicator of profitability than size. The sizeeffect in profitability is conditional. Given that BE/ME is high (or low), smallstocks on average have lower EI/BE than big stocks. In contrast, the relationbetween BE/ME and EI/BE is unconditional. From four years before to atleast five years after portfolio formation, both low-BE/ME portfolios aremore profitable than either high-BE/ME portfolio.Although low-BE/ME stocks tend to be highly profitable long before andafter they are sorted into portfolios, Figure 1 shows that their profitabilityimproves prior to portfolio formation, and deteriorates a bit thereafter. Thereverse pattern of decay and then improvement in EI/BE is observed forhigh-BE/ME stocks. Moreover, the tendency of profitability to revert isstronger for small stocks than for big stocks.
Size and Book-to-Market Factors in Earnings and Returns137Table I characterizes the reversion of EI/BE in terms of the behavior of EI,BE, and total book assets (A) in the 11 years around portfolio formation.Because EI is sometimes negative for the small-stock portfolios, we cannotuse percentage changes to describe the growth of earnings. Instead weexamine the path of EIp(t i)/EIm(t i), the ratio of equity income forportfolio p to equity income for the market. We standardize the ratios so thatthey are 1.0 for all portfolios in the year of portfolio formation (i 0). Forconsistency, this approach is also used to measure the growth of BE and A.Table I shows why EI(t i)/BE(t i - 1) peaks around the year ofportfolio formation (i 0) for the two low-book-to-market portfolios. Theearnings of low-BE/ME stocks, small and big, grow a lot relative to marketearnings through the year of portfolio formation. The earnings of smalllow-BE/ME stocks continue to grow relative to market earnings but lessrapidly. The earnings of big low-BE/ME stocks grow about like marketearnings after year t 1. Why then does EI/BE fall for low-BE/ME stocksafter portfolio formation? Because book equity grows faster than earnings. Inshort, in the years preceding portfolio formation, the earnings of low-BE/MEstocks grow faster than book equity, causing EI/BE to increase, but theopposite is true in the years after portfolio formation.The whole story reverses for high-book-to-market stocks. Their earningsdrop faster than book equity in the years preceding portfolio formation (TableI), so EI/BE declines (Figure 1). In the years after portfolio formation, theearnings of big high-BE/ME stocks decline a bit relative to market earnings,but the decline in earnings is weaker than the decline in book equity, soEI/BE increases. After an abysmal decline through the year of portfolioformation, the earnings of small high-BE/ME stocks rebound a bit, but theirbook equity declines relative to market BE. The result is a stronger postportfolio-formation increase in EI/BE for small high-BE/ME stocks than forbig high-BE/ME stocks.We suggest a simple economic story for the behavior of earnings, bookequity, and assets (which behave much like book equity). Sometime prior toportfolio formation low-BE/ME firms experience a demand or supply shockthat increases their average return on capital. The profit-maximizing response is to expand output and investment until, at the margin, earnings oninvestment return to competitive-equilibriumlevels. Conversely, highBE/ME firms experience a demand or supply shock that decreases theiraverage return on capital. The profit-maximizing response is to restructure,that is, to let output and investment contract until, at the margin, earningson investment return to competitive-equilibrium levels.Note, however, that the rebound in earnings for small high-book-to-marketstocks in the five years after portfolio formation (Table I) recaptures only asmall part of the earnings lost in the years preceding portfolio formation. Fiveyears after portfolio formation, the ratio of earnings to book equity for smallhigh-BE/ME stocks is still below that of big high-BE/ME stocks, which inturn is much below the EI/BE ratios of the two low-BE/ME portfolios(Figure 1). Thus, despite the reversion of profitability after portfolio forma-
138The Journal of FinanceTable IEconomicin the 11 Years aroundFundamentalsPortfolio FormationAt the end of June of each year t (1963 to 1992), New York Stock Exchange (NYSE), AmericanStock Exchange (AMEX), and NASDAQ stock market stocks are allocated to two groups (small orbig, S or B) based on whether their June market equity (ME, stock price times sharesoutstanding) is below or above the median ME for NYSE stocks. NYSE, AMEX, and NASDAQstocks are allocated in an independent sort to three book-to-market-equity (BE/ME) groups (low,medium, or high; L, M, or H) based on the breakpoints for the bottom 30 percent, middle40 percent, and top 30 percent of the values of BE/ME for NYSE stocks. BE is the COMPUSTATbook value of stockholders' equity, plus balance sheet deferred taxes and investment tax credit (ifavailable), minus the book value of preferred stock. Depending on availability, we use theredemption, liquidation, or par value (in that order) to estimate the book value of preferred stock.Book-to-market-equity (BE/ME) is then book common equity for the fiscal year ending incalendar year t - 1, divided by market equity at the end of December of year t - 1. The sixsize-BE/ME portfolios (S/L, S/M, S/H, B/L, B/M, B/H) are the intersections of the two MEand the three BE/ME groups.We do not use negative BE firms, which are rare prior to 1980, when calculating thebreakpoints for BE/ME or when forming the size-BE/ME portfolios. Also, only firms withordinary common equity (as classified by the Center for Research in Securities Prices, (CRSP))are included in the tests. This means that American depositary receipts, real estate investmenttrusts, and units of beneficial interest are excluded. The market portfolio (Mkt) includes allstocks in the six size-BE/ME portfolios, plus the negative BE stocks excluded from the portfolios.A(t) is total assets, and EI(t) is earnings before extraordinary items but after interest,depreciation, taxes, and preferred dividends for the fiscal year ending in calendar year t. For aportfolio, A, BE, and El are the sums for the stocks in the portfolio.In Panel A, El, BE, and A for the size-BE/ME portfolios are measured relative to the values ofthe variables for the market portfolio, and then standardized so the ratios are 1.0 in the portfolioformation year. For example, if p is a size-BE/ME portfolio and m is the market, we calculateEIp(t j)/EIm(t i) and EIp(t)/EIm(t) for each portfolio formation year t and each lead or lagusing firms that have data in years t and t i. The two ratios are theni, i -5,.,5,averaged, separately, across portfolio formation years t 1963 to 1991. The table showsfor i -5,.,5.Mean[EIp(t i)/EIm(t i)]/Mean[EIp(t)/EIm(t)]In Panel B, EI(t i)/ME(t i - 1) is the ratio of the sums of El for year t i and ME forDecember of year t i - 1 for all firms in a portfolio that have the required data for t i andthe portfolio formation year t. Mean[ EI(t i)/ME(t i - 1)] is the average of EI(t i)/ME(t i - 1) across the portfolio formation years t 1963 to 1991.In Panel C, i 0 is the 12 months preceding portfolio formation, at the end of June of eachyear from 1963 to 1992. Value-weighted monthly returns on the portfolios formed in each year tare calculated for years t - 5 to t 5. The average monthly value-weighted returns for eachyear relative to portfolio formation are then averaged across all portfolio formation years.Year i Relative to Portfolio 1.4381.0380.921Panel A. Mean of Ratio-to-Market for t i Divided by Mean for tS/LS/HB/LB/H0.6495.4420.7001.459Earnings: 0.8211.4661.4251.343 i)/EIm(t 001.1730.9500.9510.909
Size and Book-to-Market Factors in Earnings and Returns139Table I-ContinuedYear i Relative to Portfolio Formation-5-4-3-2-1012435Panel A. Mean of Ratio-to-Market for t i Divided by Mean for tS/LS/HB/LB/HS/LS/HB/LB/HBook Equity: Mean[ BEp(t i - 1)/BEm(t i - 1)]/Mean[ 1.0391.0391.0421)/BEm(t1.3410.9001.1220.893Assets: Mean[Ap(t i - 1)/An(t i - 1)]/Mean[Ap(t - 370.9091.0351.0000.9681.0371.0361.034Panel B. Average 0.127Ratio, Mean[ EI(t 740.1220.0940.0670.0960.0750.123 0720.1090.0780.116Panel C. Average Monthly Percent Portfolio Return, 6/1963 to 1.160.991.131.420.931.150.991.161.320.921.11tion, low-BE/ME firms remain much more profitable than high-BE/MEfirms for at least five years.Figure 2 shows that, like profitability, the book-to-market ratio is persistent. The distressed firms in the high-BE/ME portfolios tend to have highBE/ME for at least five years before and five years after portfolio formation.Conversely, low-BE/ME firms have sustained high profitability, and themarket responds by persistently pricing their equity at a premium to book.It is no surprise that book-to-market-equity is associated with persistentproperties of earnings. Simple models like equations (1) and (2) show thatwith rational pricing, poor (or strong) earnings that are short term do nothave much effect on stock price and BE/ME. (Penman (1991, 1992) emphasizes this point.) But asset pricing need not be rational. With irrationalpricing, stock prices and BE/ME can be driven by swings in investor sentiment that have little to do with long-term earnings (Shiller (1984)). Figure 1does not support the irrational view; at least on average, differences inBE/ME line up well with long-term future profitability.
140The Journal of L-0.4B/L0 .2-5-4'lllIllllI-3-2-1012345Year i Relativeto Ranking YearFigure 2. The 11-year evolutionof book-to-market-equity,BE(t i-1)/ME(t i-1),for size-BE/MEportfolios formed in June of year t (year 0 on the horizontal axis). Foreach portfolio formation years t 1963 to 1991, the ratios are calculated for t i, i - 5,., 5.The ratio for t i is then averaged across portfolio formation years t. BE(t i - 1) is bookcommon equity for the fiscal year ending in calendar year t i - 1. ME(t i - 1) is marketequity (stock price times shares outstanding) at the end of December of year t i - 1. S or Bindicates that the portfolio contains NYSE, AMEX, and NASDAQ stocks below (S) or above (B)the median size (ME) of NYSE stocks. L or H indicates that the portfolio contains NYSE, AMEX,and NASDAQ stocks in the bottom 30 percent (L) or top 30 percent (H) of the values ofbook-to-market-equity (BE/ME) for NYSE stocks.IV. Profitability: Time-Series EvidenceDo the strong patterns in earnings on book equity in Figure 1 show upwhen EI/BE is examined chronologically? The answer to this question comesfrom Figure 3, which shows time-series plots of EI(t)/BE(t - 1). BecauseFigure 3 is meant to capture the chronology of profitability, we use only firmswith a common December fiscal year-end. The behavior of the ratio is similar,however, when all fiscal year-ends are included.Like Figure 1, Figure 3 shows that conditional on size, a low book-to-marketratio is associated with high profitability. For big stocks, in every year t ofthe 1963 to 1991 period, the B/L portfolio has much higher EI(t)/BE(t - 1)than the B/H portfolio. Thus, in boom times or recessions, the typical biglow-book-to-market firm is more profitable than the typical big high-BE/MEfirm. For small stocks, the S/L portfolio has higher earnings on book equity
Size and Book-to-Market Factors in Earnings and Returns-0.25n141200/', \B/L0.105-0.100/-0.05-0.10-0.1562 64I,666870,I,,,l727476788082,,I8486889092Year- 1), for size-BE/MEFigure 3. Earnings on book common equity, EI(t)/BE(tportfolios formed in June of year t. The horizontal axis is t, the year for EI. EI(t) is earnings beforeextraordinary items but after interest, depreciation, taxes, and preferred dividends for the fiscalyear ending in calendar year t. BE(t - 1) is book common equity for year t - 1. S or B indicatesthat the portfolio contains NYSE, AMEX, and NASDAQ stocks below (S) or above (B) the mediansize (ME) of NYSE stocks. L or H indicates that the portfolio contains NYSE, AMEX, andNASDAQ Stocks in the bottom 30 percent (L) or top 30 percent (H) of the values of book-tomarket-equity (BE/ME) for NYSE stocks. Only firms with December fiscal year ends areincluded.than the S/H portfolio in every year but 1986, so again low BE/ME isassociated with higher profitability.Unlike Figure 1, however, the time-series plots in Figure 3 do not showthat conditional on BE/ME, small stocks are much less profitable than bigstocks, at least prior to 1980. Given BE/ME, EI(t)/BE(t - 1) tends to be abit higher for big stocks before 1980. But the recovery of small firms from therecession of 1981 and 1982 aborts. After a rise in profitability in 1983 and1984, their earnings on book equity drop and remain at historically low levelsthrough 1991.In short, for some unexplained reason, the recession 1981 and 1982 turnsinto a prolonged earnings depression for small stocks. The depression isgeneral. It hits high-BE/ME small stocks, which typically have weak earnings, and low-BE/ME small stocks, which in normal times have strongearnings. The poor earnings of small stocks after 1980 are largely responsiblefor the evidence in Figure 1 that, conditional on BE/ME, small stocks areless profitable than big stocks in the 11 years around portfolio formation.
142The Journal of FinanceV. Does the Market I
NASDAQ Stock Market stocks to two groups, small or big (S or B). Most AMEX and NASDAQ stocks are smaller than the NYSE median, so the small group contains many more stocks (3626 of 4878 in 1992). But the small group contains far less than half (about 7.3 percent in 1992) of the combined value of the two size groups. We also break NYSE, AMEX, and NASDAQ stocks into three book-to- market groups .