Transcription
(NYSE American: RLGT)GLOBAL TRANSPORTATION & LOGISTICSOverview through FQ3 March 31, 2021
DisclaimerFORWARD-LOOKING STATEMENTThis presentation and discussion includes forward-looking statements within the meaning of Section 21E of the Securities Exchange Act of 1934, as amended, andSection 27A of the Securities Act of 1933, as amended, and such statements are subject to the safe harbor created by those sections and the Private SecuritiesLitigation Reform Act of 1995, as amended. All statements, other than statements of historical fact, including without limitation statements regarding the financialposition, strategic plan and other plans, projections, future industry characteristics, growth expectations, future ability to identify, consummate, and integrateacquisitions, and objectives for our future operations, are forward-looking statements. Such statements may be identified by their use of terms or phrases such as“may,” “could,” “expects,” “estimates,” “projects,” “believes,” “anticipates,” “plans,” “intends,” and similar terms and phrases. Forward-looking statements arebased upon the current beliefs and expectations of our management and are inherently subject to risks and uncertainties, some of which cannot be predicted orquantified, which could cause future events and actual results to differ materially from those set forth in, contemplated by, or underlying the forward-lookingstatements. Although we believe that such forward-looking statements are based on reasonable assumptions, we give no assurance that our expectations will infact occur. For examples of risks, uncertainties, and events that may cause our actual results to differ materially from the expectations we describe in our forwardlooking statements, see “Risk Factors” in the prospectus to which this offering relates and the documents incorporated by reference therein. Existing andprospective investors are cautioned not to place undue reliance on forward-looking statements, which speak only as of the date hereof. We undertake noobligation to publicly update or revise any forward-looking statements after the date they are made, whether as a result of new information, future events orotherwise, except for the extent required by applicable securities laws.NON-GAAP FINANCIAL DATAThis presentation may include the use of net revenues, EBITDA, adjusted EBITDA, adjusted net income, and adjusted net income per share, which are financialmeasures that are not in accordance with generally accepted accounting principles (“GAAP”). Each such measure is a supplemental non-GAAP financial measurethat is used by management and external users of our financial statements, such as industry analysts, investors and lenders. While management believes suchmeasures are useful for investors, they should not be used as a replacement for financial measures that are in accordance with GAAP.We define net revenues as revenues less directly related operations and expenses attributed to the company’s services. We define EBITDA to exclude the effects ofpreferred stock dividends, interest and taxes, and excludes the “non-cash” effects of depreciation and amortization on long-term assets. Companies have somediscretion as to which elements of depreciation and amortization are excluded in the EBITDA calculation. We exclude all depreciation charges related to furnitureand equipment, all amortization charges, including amortization of leasehold improvements and other intangible assets. We define adjusted EBITDA to excludechanges in contingent consideration, expenses specifically attributable to acquisitions, severance and lease termination costs, F/X gains and losses, extraordinaryitems, share-based compensation expense, non-recurring litigation expenses, and other non-cash charges. For adjusted net income and adjusted net income pershare, management uses a 24.5% tax rate commencing with FY2019 and a 31% tax rate for prior periods for calculating the provision for income taxes beforepreferred dividend requirement to normalize the Company's tax rate to that of its competitors and to compare the Company's reporting periods with differenceeffective tax rates. In addition, in arriving at adjusted net income, the Company adjusts for significant items that are not part of regular operating activities. Theseadjustments include acquisition costs, transition, severance and lease termination costs, non-recurring litigation expenses as well as depreciation and amortizationand certain other non-cash charges.Our presentation of net revenues, EBITDA, adjusted EBITDA, adjusted net income, and adjusted net income per share should not be construed as an inference thatour results will be unaffected by unusual or non-recurring items. Our computations of net revenue, EBITDA, adjusted EBITDA, adjusted net income, and adjustednet income per share may not be comparable to other similarly titled measures of other companies.Reconciliations of our non-GAAP financial measures presented to our GAAP-based financial measures are included on the last slide of this presentation.2
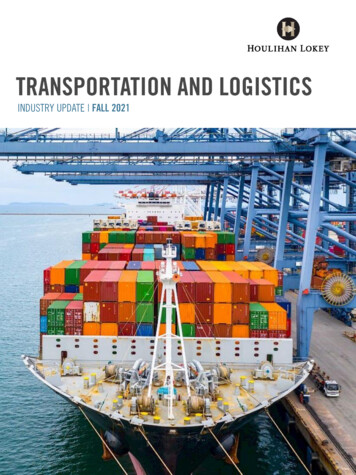
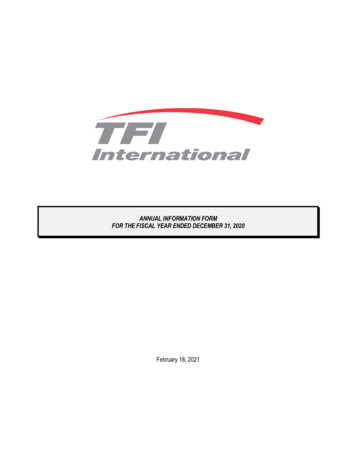
Leading Multi-Modal 3PL Service ProviderLeading Multi-Modal 3PL Service ProviderRadiant is a leading non-asset based provider of domestic and int’l transportation and logistics solutions.Ø Radiant provides global supply chain services, including domestic and international air and oceanfreight forwarding and truckload, less-than-truckload, and intermodal freight brokerage services Strong network of company-owned locations and strategic operating partners (agents) in the United States andCanada as well as additional global partners to facilitate international shipmentsØ Radiant continues to build out a compelling multi-modal offering, leveraging its technology andbundling value-added logistics solutions with its core transportation service offerings The Company continues to optimize its best-in-class operating platform (people, processes, and technology) in orderto provide exceptional operational and back-office infrastructure to its network participantsØ The Company has generated impressive financial results, with revenues of 906.7 million, net revenuesof 208.2 million and adjusted EBITDA of 47.8 million for the trailing twelve months ended Mar. 31,2021.NET REVENUE For the Trailing Twelve Months Ended March 31, 2021 ( in millions)COMPELLING DIVERSITY OF NET REVENUE BY SERVICE OFFERINGFREIGHT FORWARDINGBROKERAGE BY MODE11%VALUE-ADDEDSERVICE OFFERING3% 208.2 165.952%20%Domesti cInternational 208.2MNet RevenueTTM Ended 3/31/21 47.8MAdj. EBITDATTM Ended 3/31/21IntermodalTruckloadLess-Than-Truckload2 0 16-2021EBITDA CAGR100 20 18.465%80%Freight Forwardi ngBrokerageValue Added Servi ce (VAS) 23.9Gross RevenueTTM Ended 3/31/21Agent Stations10%28%35% 906.7M15.2%SERVICE OFFERING9%KEY STATISTICS87%Materials Management & DistributionCustoms House Brok etedAcquisitions3
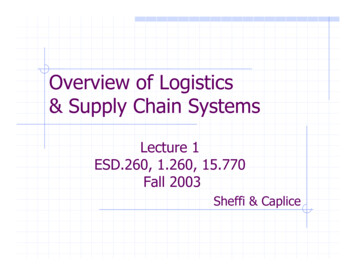
A Proven Growth PlatformSince its inception in 2006, Radiant has continued to deliver profitable growth with a track recordof executing and integrating acquisitions. 906.7MMTTM Ended 3/31/21RevenueFY E 2 0 0 6 – 2 0 2 1T T M E nded 3 / 3 1 C AG R sGross Revenue: 27.0%Adj. EBITDA: 35.3% 500MMFY2015 Revenue 300MMLargestacquisition todate, providingintermodaland brokeragecapabilitiesFY2012 Revenue202Phoenix Cartage(Agent station) 25MMFY2006 RevenueRadiantembarks onmulti-brandstrategyRadiant islaunched withinitialinvestment inAIRGROUP2006CopperLogistics(Agent station))Lomas,DedicatedLogistics Tech,SandiferValley(Agent stations)Radiantacquires itsfirst companyownedlocationsthrough DBADon Cameron& Associates(Agent station)ISLA Intl(Agent station)200820112015201420132012202Highways & Skyways(Agent station)2012016ALBSLogistics(Agent station)FriedwayEnterprises and CIC2(Agent stations)Radiant remainsopportunistically acquisitive,seeking companies withcomplementarygeographical andlogistics serviceofferings201571 0100 AgentStations andCompanyLocations2014201334 Agent Stations4
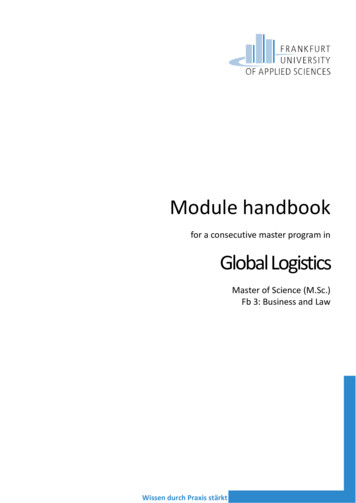
A Track Record of Profitable GrowthRadiant has consistently generated solid financial results and is well positioned for future growth.Ø For the Trailing Twelve Months Ended March 31, 2021, Radiant generated 208.2 million in net revenue and 47.8 million in adjusted EBITDAØ A track record of seamlessly integrating company-owned locations and realizing meaningful post-acquisitionsynergies, combined with an active M&A pipeline, creates compelling levers to further accelerate growthØ Radiant’s adjusted EBITDA margin (i.e. adjusted EBITDA as a percentage of net revenues) improved to a record23.0% for the Trailing Twelve Months Ended March 31, 2021CONSISTENT FINANCIAL PERFORMANCENET REVENUE & NET REVENUE MARGIN 230.1 209.4 208.2 40.8 38.3 123.7 24.4201520162017201820192020TTM3/31/21Net RevenueNet Revenue Margin3/31/212020TTM3/31/212020 17.323.0%14.0% 13.1% 15.2% 14.4% 17.7% 18.3%TTM2019201820172015201624.6% 23.9% 25.0% 23.8% 25.8% 24.5% 23.0% 502.7 47.8 29.6 29.22019 186.7 194.6 200.12018 890.5 855.2 906.7 842.4For the Fiscal Years Ended 2015 – 2021( in millions)2015 782.6 777.6For the Fiscal Years Ended 2015 – 2021( in millions)ADJ. EBITDA & ADJ. EBITDA MARGIN2017For the Fiscal Years Ended 2015 – 2021( in millions)2016GROSS REVENUEAdj. EBITDAAdj. EBITDA Margin5
First to Market AdvantageStructural changes within the freight forwarding community, resulting from industry deregulation in the1970s and the natural “graying” of industry pioneers, provide an opportunity to support the logisticsentrepreneur in transition.Ø Radiant enjoys a 10 year first to marketadvantage in leveraging a multi-brand strategy toconsolidate the agent based forwardingcommunityØ Uniquely positioned to bring value to the logisticsentrepreneurMULTI-BRAND STRATEGY Leveraging our status as a public company to providenetwork participants with a framework to share in thevalue that they help create Solid platform in terms of network, people, processand technology to “scale” the business Ideal long-term partner in terms of successionplanning and liquidityØ Systematically, we plan to convert key agentbased offices to company-owned offices andstrategically acquire and integrate otheradditional non-asset based operationsØ Radiant has identified and is in varying stages ofdue diligence with a number of potentialacquisitions6
A Robust Technology PlatformRadiant enjoys a robust, scalable technology platform to support its future growth.CUSTOMER PORTALAGENT PORTALSAP TM ROLL-OUTØ Radiant maintains a highlycustomizable, enterprise IT platformto support its multi-brand strategyØ The Company has chosen SAP TM asits platform going forward and iseffectively and methodically deployingthe system across its networkØ Direct integration with SAP TMØ Visual tracker providing status of shipmentsØ Highly versatile dashboard allows user toquickly search and filter data to see recordsfor pertinent activitiesØ Radiant-developed, with a continuousfeature set as business expandsØ Robust platform supporting all key modesØ Separate, integrated modules for booking,routing, settlementØ User configurable screens and worklistsØ Extensive data elements for analytics andcustomer reportingRadiant is one of the first 3PLs in North America to deploy SAP TM, a competitiveadvantage in targeting the installed customer base of shippers operating on SAP.Ø The Company’s IT team developed a“middleware” solution that allows anyTMS to quickly integrate into Radiant’sfinancial system– Acts as a transmission between anyother TMS and SAP ECC and allowsagent stations and company-ownedlocations to use legacy systemsconcurrently with the new systemas they transition, facilitating aseamless integrationTo meet our current and future growth, Radiant’s production environments aredeployed in AMAZON WEB SERVICES (AWS). AWS is a premier hyperscaler providingstable and scalable global infrastructure with the capabilities to expand our footprint.7
A Talented and Experienced Management TeamRadiant is led by a deep management team with extensive industry experience, a long track record of successand is aligned with shareholders. The Founder/CEO continues to own 20% of the shares outstanding.EXECUTIVE LEADERSHIP TEAMB oh n Crai nFounder,Chairman,& CEOT od d M acomb erSVP, CFO, andTreasurerJoh n S obbaSVP, General Counseland SecretaryArn i e G ol d s t ei nSVP and CCOM ark Row eSVP of TechnologySolutionsHarry S mi tSVP and CountryManager, CanadaChristopher BrachSVP and GeneralManager, Clipper/8
Diversified Customer BaseRadiant provides customized time critical domestic and international transportation and logistics solutions toa diversified customer base of manufacturers, distributors and retailers.HIGHLY DIVERSIFIED CUSTOMER BASENET REVENUE BY STATION TYPE(1)Ø Over 12,000 individual customers(1)Agency vs Company-OwnedØ No single agency station accounts for more than 10%of net revenuesØ Top 5 agency stations account for less than 20% of netrevenuesØ Top 10 customers account for less than 30% of netrevenues47% 208.253%Ø No single customer accounts for more than 5% of netrevenuesAgent Stations(1) For TTM Ended Mar. 31, 2021 and in millionsCompany-Owned LocationsINDUSTRIES SERVEDAviation& AutomotiveMilitary &GovernmentManufacturing &Consumer GoodsIndustrial & FarmMedical,Healthcare &PharmaceuticalsElectronics & High TechOil & Gas/EnergyTrade Shows,Events &AdvertisingRetail9
Uniquely Positioned in the MarketplaceUNIQUE MULTI-BRAND STRATEGYØ Radiant has maintained the brands from its agent network acquisitions including AIRGROUP (2006),ADCOM (2008), Distribution by Air (2011), and SBA (2015)Ø Provides multiple on-ramps for agents to join the network while centralizing back-office operations andcreating a pipeline of attractive tuck-in acquisitionsØ Company-owned locations operate as Radiant Global Logistics, including agency locations as they convertto company-owned storesSCALABLE INFRASTRUCTUREØ Scalable platform with infrastructure and team in place to support a much larger organizationØ Track record of on-boarding acquisitions and capturing significant synergies through absorption of backoffice functionsBEST-IN-CLASS TECHNOLOGYØ Have utilized SAP ERP since inception, providing robust analytics and functionalityØ One of the first 3PLs in North America to implement SAP TM, providing seamless integration with the vastuniverse of shippers operating on SAPBUILT-IN ACQUISITION PIPELINEØ Opportunity to continue to selectively convert agent stations to company-owned operationsØ Limited integration risk as agent stations are already operating as part of the networkØ Incremental cost synergies available at the station level10
Multiple Opportunities for Future GrowthSTR ONG ,CONSISTENTR ECORD O FOR G A N I CGR O W T HØ Entrepreneurialcharacteristics of theleading agent-basednetwork, underpinned byManagement’s focus onincreasing companyowned same-store-sales,provides consistentorganic growthØ Recent investment inSalesforce platform isexpected to drivecontinued organic growthmomentumØ Recent investment in Xsuite driving productivitygains in the back-officeand margin expansion (adj.EBITDA as a function ofgross margin)V E R T IC A LS PECIALIZATIONSER V IC EO FFERINGEXPANSIONNE W AG E N TO NBOARDINGINTERNA LEXTERNALANDM&AS TRONG F REEC ASH F LOWANDF INANCIALFLEXIBILITYØ Recently initiated verticalstrategy focusing on keyend markets such asmilitary & government,healthcare & life sciences,and humanitarian / NGO,reaping early rewardsØ Former operators inrespective industries serveas vertical experts,providing deepinstitutional knowledge toagents and internal salesforceØ Vertical experts typicallybring an existing book ofbusiness with them whenjoining Radiant, bolsteringorganic revenue growthØ Leveraging competenciesgained through Wheels,Management continues tobuild out freightbrokerage, intermodal,and value-added servicesto enhance and deepencustomer relationshipsØ Continuing to focus ongrowing through astrategy of bundlingvalue-added logisticssolutions with its coretransportation serviceofferingØ Significant opportunityexists to cross-sellservices to existingcustomers only utilizingone or two serviceofferingsØ Radiant’s multi-brandstrategy provides anumber of ways to addnew agent stations /locations into the networkØ The Company’s threeRegional Vice Presidentsare each charged withrecruiting agents to theRadiant platform.Ø Incremental cost ofsupporting the next agentstation is very smallØ Continuing to replenish apipeline of potential tuckin acquisitions as agentstations ultimatelyconvertØ Active M&A pipeline, without-of-networkopportunities currently inprogressØ 100 agent stationsprovide embeddedpipeline of potentialacquisition targetsØ Opportunity toconsolidate operationsinto one of 20 companyowned locations providesadditional synergypotentialØ U.S. Forwarding, U.S.Brokerage and Canadaprovide three discreetplatforms to supportM&A effortsØ Through the trailingtwelve months endedMarch 31, 2021, Radiantgenerated 34.9 million incash from operationsØ December 2018, Radiantredeemed 21.0 millionpreferred stockØ Low leverage with 10.27M drawn on 150million facility at 3/31/21,not including access to anadditional 50.0 millionaccordion feature tosupport our future M&AactivitiesØ 100M Equity Shelfdeclared effective andavailableSCALABLE PLATFORMWorld-class IT system, corporate infrastructure, and multi-brand strategy provide ability to efficientlyadd new agents to the network, grow existing locations and agents organically, and realizesignificant back-office synergies from acquisitions11
Key Investment HighlightsINVESTMENT HIGHLIGHTSüüüüüüLEADING MULTI-MODAL 3PL SERVICE PROVIDERA PLATFORM FOR GROWTH WITH A PROVEN TRACK RECORD OF PROFITABLE GROWTH THROUGH A NETWORK OFCOMPANY - OWNED LOCATIONS10 YEAR FIRSTTO MARKETADVANTAGEANDUNIQUELY POSITIONED120 AGENT ANDIN THE MARKETPLACET HE PREFERRED PARTNER FOR LOGISTICS ENTREPRENEURS WITH A ROBUST SERVICE OFFERING AND BUILT - IN EXIT STRATEGY FROM ITSM ULTI -B RAND P LATFORMHIGHLY DIVERSIFIED CUSTOMER BASES IGNIFICANT LONG - STANDING CUSTOMER RELATIONSHIPS ACROSS THE PLATFORM – NO ONE CUSTOMER REPRESENTS MORE THAN 5% OFT RAILING T WELVE M ONTHS E NDED M AR . 31, 2021 N ET R EVENUEROBUST IT PLATFORMM EANINGFUL INVESTMENTS IN IT INFRASTRUCTURE TO SUPPORT SCALE AND ENHANCE OPERATIONAL EXECUTION AND EFFICIENCIESTALENTEDANDEXPERIENCED MANAGEMENT TEAMWITHSIGNIFICANTEQUITY OWNERSHIPM ANAGEMENT HAS DEEP EXPERIENCE AND ALIGNED WITH SHAREHOLDERS ( FOUNDER /CEO OWNS 20% OF THE SHARES OUTSTANDING ) ISCOMMITTED TO CONTINUING TO GROW THE PLATFORMMULTIPLE OPPORTUNITIESFORFUTURE GROWTHANDMARGIN EXPANSIONSCALABLE PLATFORM IN TERMS OF PEOPLE , PROCESS AND TECHNOLOGY WITH FINANCIAL FLEXIBILITY ( LOW LEVERAGE ANDSHELF ) TO SUPPORT M&A 100M EQUITYATTRACTIVE GROWTH TRAJECTORYGROSS REVENUEFor the Fiscal Years Ending 2006 – 2021 ( in millions) 26 76 100200620072008 1372009 1472010 210 207 554 608 650 664 7122017201820192020TTM3/31/21 5032015 204 3492011201220132014Freight Forwardi ng Gross Revenues 907 245 311Brokerage and Intermodal Gross Revenues 891 31 161 783 778 297 842 855FY E 2 0 0 6 – T T M E nded3 / 3 1 / 2 1 C AG R sGross Revenue: 27.0% 25 33 224 5382016Value Added Servi ces Gross Revenues 27 16712
Pivoting our Focus in Response to COVIDLow leverage, a diversified portfolio of services and a focused action plan has helped us successfully navigatethe pandemic.ENSURING THE HEALTH AND SAFETY OF OUR EMPLOYEESØ Using our industry-leading technology, we were able to shift the majority of our 450 U.S. based employees towork from home reducing the risk of community spread and disruption to our operationsPROVIDING SUPPLY CHAIN CONTINUITY FOR OUR CUSTOMERS AND OPERATING PARTNERSØ The diversified nature our account base allowed for significant work in delivering essential PPE, food andbeverage, consumer goods, technology and other essential products.RAMPING BACK UP AS THE ECONOMY IMPROVESØ In late March 2020, we initiated a series of work force reduction and rationalization measures in response toCOVID. Radiant is now re-growing its workforce in line with business expansion.Ø To preserve our liquidity we tabled any acquisition opportunities, suspended our stock buy-back program,deferred discretionary technology investments, reduced discretionary operating expenses. Radiant is nowpositioned to explore acquisitions and/or stock buy backs as the opportunities present themselves.13
Reconciliations of Non-GAAP Financial MeasuresReconciliation of Total Revenues to Net Revenues, Net Income Allocable to Common Stockholdersto EBITDA and Adjusted EBITDA.14
It’s the Network that Delivers!THANK YOU
Radiant is a leading non-asset based provider of domestic and int'l transportation and logistics solutions. COMPELLING DIVERSITY OF NET REVENUE BY SERVICE OFFERING SERVICE OFFERING FREIGHT FORWARDING BROKERAGE BY MODE VALUE-ADDED SERVICE OFFERING NET REVENUE For the Trailing Twelve Months Ended March 31, 2021 ( in millions) KEY STATISTICS .