Transcription
Internet Traffic Monitoringand Analysis:Wireshark Tutorial
OutlineWhat is Wireshark?Capturing PacketsAnalyzing PacketsFiltering PacketsSaving and Manipulating PacketsPacket StatisticsColorizing Specific PacketsReferences
What is Wireshark?The De-Facto Network Protocol Analyzer Open-Source (GNU Public License)Multi-platform (Windows, Linux, OS X, Solaris, FreeBSD, NetBSD, and others)Easily extensibleLarge development groupPreviously Named “Ethereal”
What is Wireshark?Features Deep inspection of thousands of protocolsLive capture and offline analysisStandard three-pane packet browserCaptured network data can be browsed via a GUI, or via the TTY-modeTShark utilityThe most powerful display filters in the industryRich VoIP analysisLive data can be read from Ethernet, IEEE 802.11, PPP/HDLC, ATM, Bluetooth,USB, Token Ring, Frame Relay, FDDI, and othersColoring rules can be applied to the packet list for quick, intuitive analysisOutput can be exported to XML, PostScript , CSV, or plain text
What is Wireshark?What we can: Capture network trafficDecode packet protocols using dissectorsDefine filters – capture and displayWatch smart statisticsAnalyze problemsInteractively browse that trafficSome examples people use Wireshark for: Network administrators: troubleshoot network problemsNetwork security engineers: examine security problemsDevelopers: debug protocol implementationsPeople: learn network protocol internals
Tools OverviewTcpdump Unix-based command-line tool used to intercept packets Including filtering to just the packets of interest Reads “live traffic” from interface specified using -i option or from a previously recorded trace file specified using -r option You create these when capturing live traffic using -w optionTshark Tcpdump-like capture program that comes w/ Wireshark Very similar behavior & flags to tcpdumpWireshark GUI for displaying tcpdump/tshark packet traces6
Tcpdump example Ran tcpdump on a Unix machine First few lines of the output:01:46:28.808262 IP danjo.CS.Berkeley.EDU.ssh adsl-69-228-2307.dsl.pltn13.pacbell.net.2481: . 2513546054:2513547434(1380) ack1268355216 win 1281601:46:28.808271 IP danjo.CS.Berkeley.EDU.ssh adsl-69-228-2307.dsl.pltn13.pacbell.net.2481: P 1380:2128(748) ack 1 win 1281601:46:28.808276 IP danjo.CS.Berkeley.EDU.ssh adsl-69-228-2307.dsl.pltn13.pacbell.net.2481: . 2128:3508(1380) ack 1 win 1281601:46:28.890021 IP adsl-69-228-230-7.dsl.pltn13.pacbell.net.2481 danjo.CS.Berkeley.EDU.ssh: P 1:49(48) ack 1380 win 165607
What does a line convey?TimestampThis Sourceis an IPhostpacketnameSourceport number (22)01:46:28.808262 IP danjo.CS.Berkeley.EDU.ssh adsl-69-228-230-7.dsl.pltn13.pacbell.net.2481: .2513546054:2513547434(1380) ack 1268355216 win 12816Destination host nameDestination port numberTCP specific information Different output formats for different packet types8
Similar Output from Tshark1190003744.940437 61.184.241.230 - 128.32.48.169 SSHEncrypted request packet len 481190003744.940916 128.32.48.169 - 61.184.241.230 SSHEncrypted response packet len 481190003744.955764 61.184.241.230 - 128.32.48.169 TCP 6943 ssh [ACK] Seq 48 Ack 48 Win 65514 Len 0 TSV 445871583TSER 6325354931190003745.035678 61.184.241.230 - 128.32.48.169 SSHEncrypted request packet len 481190003745.036004 128.32.48.169 - 61.184.241.230 SSHEncrypted response packet len 481190003745.050970 61.184.241.230 - 128.32.48.169 TCP 6943 ssh [ACK] Seq 96 Ack 96 Win 65514 Len 0 TSV 445871583TSER 6325355029
Demo 1 – Basic RunSyntax:tcpdump [options] [filter expression]Unfortunately, Eustis machine does not allow normal users to runtcpdumpI will demonstrate it on my group’s Unix machine: acnserver.fils.edu sudo tcpdump –i eth0 On your own Unix machine, you can run it using “sudo” or directly run“tcpdump”Observe the output10
FiltersWe are often not interested in all packets flowing through the networkUse filters to capture only packets of interest to us11
Demo 21.Capture only udp packets 2.tcpdump “udp”Capture only tcp packets tcpdump “tcp”12
Demo 2 (contd.)1.Capture only UDP packets with destination port 53 (DNS requests) 2.tcpdump “udp dst port 53”Capture only UDP packets with source port 53 (DNS replies) 3.tcpdump “udp src port 53”Capture only UDP packets with source or destination port 53 (DNSrequests and replies) tcpdump “udp port 53”13
Demo 2 (contd.)1.Capture only packets destined to quasar.cs.berkeley.edu 2.tcpdump “dst host quasar.cs.berkeley.edu”Capture both DNS packets and TCP packets to/fromquasar.cs.berkeley.edu tcpdump “(tcp and host quasar.cs.berkeley.edu) or udp port 53”14
How to write filtersRefer the tcpdump/tshark man pageMany example webpages on the Internet15
Running tcpdumpRequires superuser/administrator privileges on Unix http://www.tcpdump.org/ You can do it on your own Unix machine You can install a Linux OS in Vmware on your machineTcpdump for Windows WinDump: http://www.winpcap.org/windump/ Free software16
So What is WireShark?Packet sniffer/protocol analyzerOpen Source Network ToolLatest version of the ethereal tool
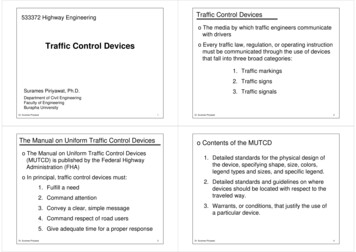
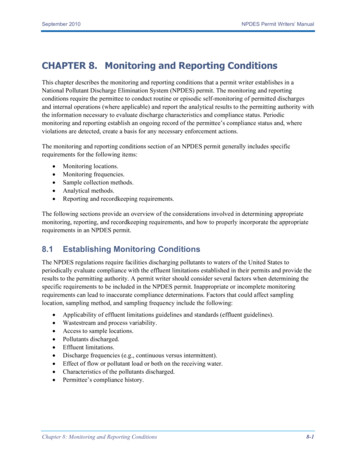
Wireshark Interface18
Wireshark Interface19
InterfacesPacketListPacketDetailsPacketBytes
Status Bar21
Capturing Packets (1/3)
Capture Options
Capture Filter
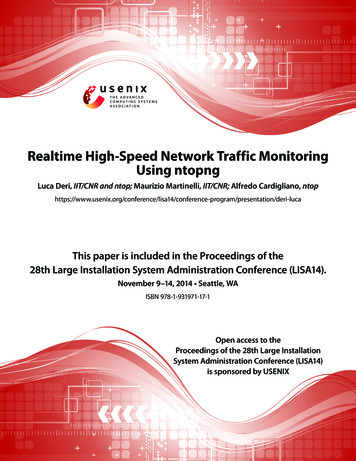
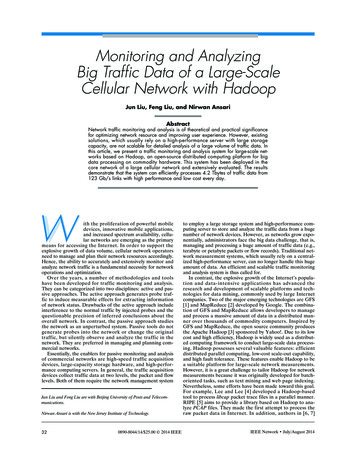
Capturing Packets (2/3)Capture all packets on thenetworkCapture filterCapture inmultiple filesWhen toautomaticallystop thecaptureBuffer size – in order notto fill your laptop diskDisplayoptionsNameresolutionoptions
Capturing Packets (3/3)Example (W-LAN):Received Signal StrengthIndication (RSSI) and Linkspeed (BW)
Capture Filter exampleshost 10.1.11.24host 192.168.0.1 and host 10.1.11.1tcp port httpipnot broadcast not multicastether host 00:04:13:00:09:a3
Capture Buffer Usage
Capture Interfaces
Interface Details: Characteristics
Interface Details: Statistics
Interface Details: 802.3 (Ethernet)
Display Filters (Post-Filters)Display filters (also called post-filters) only filter the view of what youare seeing. All packets in the capture still exist in the traceDisplay filters use their own format and are much more powerful thencapture filters
Display Filter
Display Filter Examplesip.src 10.1.11.00/24ip.addr 192.168.1.10 && ip.addr 192.168.1.20tcp.port 80 tcp.port 3389!(ip.addr 192.168.1.10 && ip.addr 192.168.1.20)(ip.addr 192.168.1.10 && ip.addr 192.168.1.20) && (tcp.port 445 tcp.port 139)(ip.addr 192.168.1.10 && ip.addr 192.168.1.20) && (udp.port 67 udp.port 68)tcp.dstport 80
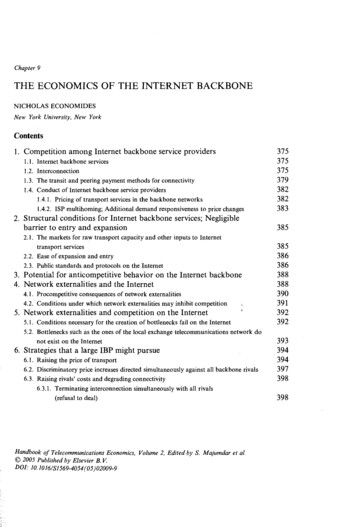
Display Filter37
Display FilterString1, String2 (Optional settings): Sub protocol categories inside the protocol. Look for a protocol and then click on the " " character. Example: tcp.srcport 80 tcp.flags 2 SYN packet Tcp.flags.syn 1 tcp.flags 18 SYN/ACK Note of TCP Flag field:38
Display Filter Expressionssnmp dns icmp Display the SNMP or DNS or ICMP traffics.tcp.port 25 Display packets with TCP source or destinationport 25.tcp.flags Display packets having a TCP flagstcp.flags.syn 0x02 Display packets with a TCP SYN flag.If the filter syntax is correct, it will be highlighted in green,otherwise if there is a syntax mistake it will be highlighted in red.Correct syntaxWrong syntax39
Save Filtered Packets After Using Display FilterWe can also save all filtered packets in text file forfurther analysisOperation:File Export packet dissections as “plain text” file1). In “packet range” option,select “Displayed”2). In choose “summary line” or“detail”40
Analyzing Packets (1/9) Ethernet Frame Example
Analyzing Packets (2/9)IP Packet Example
Analyzing Packets (3/9)TCP Packet Example
Analyzing Packets (4/9)TCP 3-way Handshake
Connection-OrientedBefore any data transfer, TCP establishes a connection: One TCP entity is waiting for a connection (“server”) The other TCP entity (“client”) contacts the serverThe actual procedure for setting up connections is more complex.Each connection isfull duplexCLIENTSERVERRequest a connectiononnectionAccept a cData TranserDisconnect45waiting forconnectionrequest
ReliableByte stream is broken up into chunks which are called segmentsReceiver sends acknowledgements (ACKs) for segmentsTCP maintains a timer. If an ACK is not received in time,the segment is retransmittedDetecting errors:TCP has checksums for header and data. Segments withinvalid checksums are discardedEach byte that is transmitted has a sequence number46
Byte Stream ServiceTo the lower layers, TCP handles data in blocks, the segments.To the higher layers TCP handles data as a sequence of bytes and does not identifyboundaries between bytesSo:Higher layers do not know about the beginning and end of segments !ApplicationApplication1. read 40 bytes2. read 40 bytes3. read 40 bytes1. write 100 bytes2. write 20 bytesTCPqueue ofbytes to betransmitted47SegmentsTCPqueue ofbytes thathave beenreceived
TCP FormatTCP segments have a 20 byte header with 0 bytes of data.IP header TCP header20 bytesTCP data20 bytes015 16Source Port Number31Destination Port NumberSequence number (32 bits)headerlength0Flagswindow sizeTCP checksumurgent pointerOptions (if any)DATA4820 bytesAcknowledgement number (32 bits)
TCP header fieldsPort Number: A port number identifies the endpoint of a connection. A pair IPconnection.address, port number identifies one endpoint of a Two pairs clientIP address, server port number and server IP address, server port number identify aTCP connection.ApplicationsPorts:Applications23 80 104780 16TCPTCPIPIP49Ports:
TCP header fieldsSequence Number (SeqNo): Sequence number is 32 bits long. So the range of SeqNo is0 SeqNo 232 -1 4.3 Gbyte Each sequence number identifies a byte in the byte stream Initial Sequence Number (ISN) of a connection is set during connectionestablishment50
TCP header fieldsAcknowledgement Number (AckNo): Acknowledgements are piggybacked, I.ea segment from A - B can contain an acknowledgement for a data sent in the B - A direction A hosts uses the AckNo field to send acknowledgements. (If a host sendsan AckNo in a segment it sets the “ACK flag”) The AckNo contains the next SeqNo that a hosts wants to receiveExample:The acknowledgement for a segment withsequence numbers 0-1500 is AckNo 150151
TCP header fieldsAcknowledge Number (cont’d) TCP uses the sliding window flow protocol (see CS 457) to regulate the flowof traffic from sender to receiver TCP uses the following variation of sliding window: no NACKs (Negative ACKnowledgement) only cumulative ACKsExample:Assume: Sender sends two segments with “1.1500” and “1501.3000”, butreceiver only gets the second segment.In this case, the receiver cannot acknowledge the second packet. It can onlysend AckNo 152
TCP header fieldsHeader Length ( 4bits): Length of header in 32-bit words Note that TCP header has variable length (with minimum 20 bytes)53
Analyzing Packets (5/9)Flow Graph Giving us a graphical flow, for better understanding of what we see
Analyzing Packets (6/9)Flow Graph
Analyzing Packets (7/9)Filtering Specific TCP Stream
Analyzing Packets (8/9)Filtering Specific TCP Stream
Analyzing Packets (9/9)RTP Stream AnalysisStablestream BW
Filtering Packets (1/4)Applying Filter when Capturing PacketsCapture Interfaces Options:
Filtering Packets (2/4) Applying Filter when Analyzing Packets
Filtering Packets (3/4)Examples: Capture only traffic to or from IP address 172.18.5.4 host 172.18.5.4 Capture traffic to or from a range of IP addresses net 192.168.0.0/24 net 192.168.0.0 mask 255.255.255.0 Capture traffic from a range of IP addresses src net 192.168.0.0/24 src net 192.168.0.0 mask 255.255.255.0 Capture traffic to a range of IP addresses dst net 192.168.0.0/24 dst net 192.168.0.0 mask 255.255.255.0 Capture only DNS (port 53) traffic port 53 Capture non-HTTP and non-SMTP traffic on your server host www.example.com and not (port 80 or port 25) host www.example.com and not port 80 and not port 25
Filtering Packets (4/4)Examples: Capture except all ARP and DNS traffic port not 53 and not arp Capture traffic within a range of ports (tcp[2:2] 1500 and tcp[2:2] 1550) or (tcp[4:2] 1500 and tcp[4:2] 1550) tcp portrange 1501-1549 Capture only Ethernet type EAPOL ether proto 0x888e Capture only IP traffic(the shortest filter, but sometimes very useful to get rid of lower layer protocols like ARP and STP) ip Capture only unicast traffic(useful to get rid of noise on the network if you only want to see traffic to and from your machine,not, for example, broadcast and multicast announcements) not broadcast and not multicast
Protocol Hierarchy
Protocol Hierarchy
Follow TCP Stream
Follow TCP Streamred - stuff you sentblue - stuff you get
Filter out/in Single TCP StreamWhen click “filter out this TCP stream” in previous page’s box, new filter stringwill contain like: http and !(tcp.stream eq 5)So, if you use “tcp.stream eq 5” as filter string, you keep this HTTP session67
Saving and Manipulating Packets (1/3)Save only displayed packets
Saving and Manipulating Packets (2/3)Export to CSV file
Saving and Manipulating Packets (3/3)Exported CSV File
Packet Statistics (1/8)Protocol Hierarchy
Packet Statistics (2/8)Conversation Traffic between two specific endpointsWith some manipulation
Packet Statistics (3/8)I/O Graph
Packet Statistics (4/8)Configurable Options I/O Graphs Graph 1-5: enable the specific graph 1-5 (graph 1 by default) Filter: a display filter for this graph (only the packets that pass this filter will be taken intoaccount for this graph) Style: the style of the graph (Line/Impulse/FBar/Dot) X Axis Tick interval: an interval in x direction lasts(10/1 minutes or 10/1/0.1/0.01/0.001 seconds) Pixels per tick: use 10/5/2/1 pixels per tick interval View as time of day: option to view x direction labels as time of day instead of seconds orminutes since beginning of capture Y Axis Unit: the unit for the y direction(Packets/Tick, Bytes/Tick, Bits/Tick, Advanced.) Scale: the scale for the y unit (Logarithmic,Auto,10,20,50,100,200,.)
Packet Statistics (5/8)TCP Stream Graph
Packet Statistics (6/8)Round-Trip Time GraphRTT Vs. Sequence numbers gives us the time that taketo Ack every packet.In case of variations, it can cause DUPACKs and evenRetransmissionsUsually will happen on communications lines:Over the InternetOver cellular networks
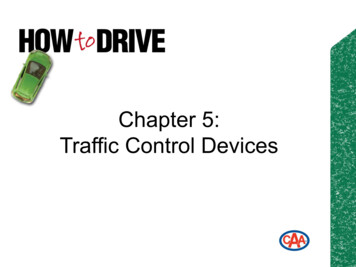
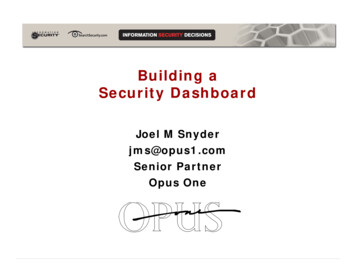
Packet Statistics (7/8)Seq No [B]Time / Sequence GraphTime / Sequence representes how sequence numbersadvances with timeIn a good connection (like in the example), the line willbe linearThe angle of the line indicates the speed of theconnection. In this example – fast connectionTime [Sec]
Packet Statistics (8/8)Seq No [B]Time / Sequence GraphIn this case, we see a noncontiguous graphCan be due to:Severe packet lossServer response (processing)timeTime [Sec]
Colorizing Specific Packets (1/4)Packet Colorization Colorize packets according to a filter Allow to emphasize the packets interested in A lot of Coloring Rule examples at the Wireshark Wiki Coloring Rules page athttp://wiki.wireshark.org/ColoringRulesWe want to watch aspecific protocol throughout the capture file
Colorizing Specific Packets (2/4)
Colorizing Specific Packets (3/4)
Colorizing Specific Packets (4/4)TLS Connection Establishment
Basic usage of GrepCommand-line text-search program in LinuxSome useful usage: Grep ‘word’ filename # find lines with ‘word’Grep –v ‘word’ filename # find lines without ‘word’Grep ‘ word’ filename # find lines beginning with ‘word’Grep ‘word’ filename file2 # output lines with ‘word’ to file2ls -l grep rwxrwxrwx # list files that have ‘rwxrwxrwx’ featuregrep ' [0-4]‘ filename # find lines beginning with any of the numbers from 0-4Grep –c ‘word’ filename # find lines with ‘word’ and print out the number of theselines Grep –i ‘word’ filename # find lines with ‘word’ regardless of caseMany tutorials on grep online d-in-linux-unix/ nix-grep-command-examples/83
ReferencesWireshark Website http://www.wireshark.orgWireshark Documentation http://www.wireshark.org/docs/Wireshark Wiki http://wiki.wireshark.orgNetwork analysis Using Wireshark Cookbook harkCookbook/dp/1849517649
Q&A
Tcpdump-like capture program that comes w/ Wireshark Very similar behavior & flags to tcpdump Wireshark GUI for displaying tcpdump/tshark packet traces. 7 . If the filter syntax is correct, it will be highlighted in green, otherwise if there is a syntax mistake it will be highlighted in red. Correct syntax