Transcription
The Global InternetPhenomena ReportOctober 2018 ENTER
The Global InternetWelcome!Phenomena ReportOctober 2018A word from Lyn Cantor, CEO, SandvineThe new Sandvine is a combination of the former Sandvine and Procera businesses, now fullyintegrated and aligned as a global leader in the Network Intelligence market segment. Our customerbase represents over 150 T1 and T2 global network operators and our solutions touch over 2.1Binternet subscribers worldwide.The foundation of our business model is being ‘the best’ telco networkdata analytics company with use cases that help our customersunderstand, optimize, and manage subscriber quality ofexperience (QoE). Fundamentally, our objective is to alwaysprovide the best vendor agnostic granularity and accuracy forthe data flowing across our customers’ networks and helpthem intelligently act on that data.You will see an ongoing commitment to deliver the preeminent view of global trends and distilled insights on whatour operator eco-system sees and manages in terms ofservices delivered to subscribers. As our global reachcontinues to expand across fixed, mobile, cable, satellite, andWiFi network domains, we will bring you viewpoints on thelatest trends and ‘special topics’ through our report series.Our goal with this report is to inform the global communityon the ‘Internet Phenomena’ we live in every day and toexpose both challenges and opportunities to build a morecollaborative eco-system, providing a robust connectedexperience for subscribers.We hope you will enjoy the report as well as the enhancedpresentation of the data. If you have any suggestions on how wecan make this report better, we would appreciate your input.Please feel free to reach out to phenomena@sandvine.com.Lyn Cantor, CEO, SandvineAbout the Global InternetPhenomena DataWelcome to the New Phenomena ReportI’d like to reintroduceyou to the SandvineGlobal InternetPhenomena Report!We have workedhard on this editionto bring you acomprehensive viewof what is happening on the internet to helpthe industry as a whole get a reality checkon how the hype on specific applicationstranslates to network impact. With theattention of both consumers and networkoperators focused on network quality, itis more important than ever for operators tounderstand how their bandwidth isbeing consumed.This edition of the report will cover bothglobal macro and regional micro views ofthe composition of traffic on the internet.Sandvine’s value proposition to our customersis the accuracy and granularity of our networkintelligence, so we focus on identifying asmany applications as we can, despite how theinternet is becoming more encrypted.Why is this important?STARTThe Global Internet Phenomena Report ranksapplications based on their “traffic share.” Thefascinating data that fuels the report illustratesthe disconnect between “market share” forcompanies defined by subscriber counts andhow often subscribers use a service. Trafficshare is defined as the percentage of networkresources used by a specific application relativeto other applications.For Global and Regional overall reports, werank all applications that Sandvine can see. Forthe Spotlight reports, we compare applicationsof a specific type (streaming video, messaging,etc.) to see which ones lead their categories.Cam Cullen,VP of Marketing, SandvineWhen networks get congested (and theyalways end up congested), the solution to theproblem depends on the root cause. That PREVIOUSsounds logical, but network operators arelimited today by both regulatory issues and alack of visibility, and are struggling to retain thevisibility that they need to make the rightnetwork investments that deliver a high qualityexperience to their subscribers. Differentapplications require different network resourcesto achieve good quality, and without accuratevisibility into network traffic composition, networkoperators cannot deliver for consumers.NEXT The data in this edition of the Global InternetPhenomena Report is drawn from Sandvine’sinstalled base of over 150 Tier 1 and Tier 2 fixed andmobile operators worldwide. The report does notinclude significant data from either China or India,but the data represents a portion of Sandvine’s 2.1Bsubscribers installed base, a statistically significantsegment of the internet population.This edition combines fixed and mobile data into asingle comprehensive view of internet traffic acrossall network types. A future edition will break outseparate fixed and mobile traffic composition.Within each section, Sandvine measured the globaltraffic share for applications from several differentperspectives:Downstream: This is the traffic volume downloadedfrom the internet. Examples would be a video stream,a file download, or an app download from iTunes.Upstream: This is the traffic volume uploadedto the internet. It could be requests for content(i.e., browsing the Netflix library), an interactivemessaging session, or a Twitch stream of a gamingsession from a console.Connections: This represents the number of“conversations” occurring for an application. Someapplications use a single connection for all traffic,others (like Netflix, BitTorrent, or Pokemon Go) usemany connections to transfer data or video to theend user.Copyright 2018 Sandvine. All rights reserved. All other trademarks are property of their respective owners.2
The Global InternetSection OverviewSection 1: Global News4HIGHLIGHTS IN THIS EDITIONA brief overview of some of key findings in this issue of theGlobal Internet Phenomena Report.EXECUTIVE OVERVIEWWhat are the phenomena that are dominating the internet5in 2018? You can bet the video streaming is one, but whichvideo providers, and what other applications are heating up?6GLOBAL APPLICATION TRAFFIC SHAREWhat application categories are the leading consumers ofinternet bandwidth? The real question is how much traffic on theinternet is video?7GLOBAL APPLICATION RANKINGSDrilling a bit deeper, what specific applications are internetusers engaging with and spending their valuable gigabytes on? Theusual suspects are on the lists, but in what order?8GLOBAL TRENDS: BEYOND THE TOP 10What happens outside the top 10? With over 5300 signaturespresent in this Global Internet Phenomena Report, there arebound to be some interesting factoids out there. We look at Nestthermostats, Alexa versus Siri, Ethereum and Bitcoin, as well assome other apps that caught the eye in the data.Phenomena ReportOctober 2018Section 2: Regional News9Section 3: SpotlightsAMERICAS DOWNSTREAM TRAFFIC SHARENetflix once again takes the Americas crown, despite improvements in efficiency, video trafficmanagement, and increased competition. Who else is in the top 10?101112131418SPOTLIGHT STREAMING VIDEONot all regions are created equal when it comes to streamingvideo traffic share. Netflix and YouTube are everywhere, but localstreaming is increasing.AMERICAS UPSTREAM TRAFFIC SHAREVideo is the top upstream source of traffic in the Americas – how can that be?SPOTLIGHT: CONNECTED FITNESSEver heard of Peloton? If you run a network, you should check it out.19What individual games are generating the most traffic onnetworks? Since the number of players does not always align withtraffic share, we look at each region to determine the winners.20EMEA DOWNSTREAM TRAFFIC SHAREGaming is having major impact on networks in EMEA, with 3 in the top 10.SPOTLIGHT GAMINGSPOTLIGHT SOCIAL NETWORKINGFacebook or Instagram? What about Snapchat? Or VK andYouKu? Although the leaders are obvious, there are some surprisingnames that pop up in this edition.EMEA UPSTREAM TRAFFIC SHAREBitTorrent leads EMEA upstream traffic share by a large margin.SPOTLIGHT: WORLD CUP 2018The 2018 World Cup was a major force on the internet, with impact felt not only with the gamesthemselves streaming online, but also in social networking and other video streaming sites.21SPOTLIGHT MESSAGINGSkype is the global traffic share in messaging, but there areother strong contenders not far behind that may shift the sharerankings in the next edition.22 SPOTLIGHT STREAMING AUDIO151617APAC DOWNSTREAM TRAFFIC SHARESocial networking is a driving force in APAC networking, with Facebook Video leading YouTube.“And the winner in streaming audio is.Spotify.” The marketshare numbers for streaming audio do not align with the traffic share,so what services are being used by consumers more often?APAC UPSTREAM TRAFFIC SHAREP2P applications besides BitTorrent make an appearance in the Phenomena report in APAC.SPOTLIGHT: GOOGLEHow dominant is Google in APAC? It has over 40% of all connections in the region. PREVIOUSSTARTNEXT 23INFOGRAPHIC COLLECTION AND RESOURCESWant to use some of this data? We have a handy collection ofresources to simplify re-use of the data in the Phenomena report, aswell as links to more information if you have questions for us.Copyright 2018 Sandvine. All rights reserved. All other trademarks are property of their respective owners.3
The Global InternetHighlights in this editionVideo is almost58%Phenomena ReportOctober 2018More than50%of the total downstream volumeof traffic on the internet15%of internet trafficis encrypted, andTLS 1.3 adoptionis growingisof the total downstream volume of trafficacross the entire internetBITTORRENTis almost22%of total upstream volumeof traffic, and overin EMEA aloneAlphabet /applications make up overof the total internetconnections in APAC40%GAMINGis becoming a significant force in traffic volumeas gaming downloads, Twitch streaming, andprofessional gaming go mainstreamPlus spotlights on:Traffic share leaders for video,social networking, messaging,audio streaming, and gaming31% PREVIOUSSTARTNEXT Copyright 2018 Sandvine. All rights reserved. All other trademarks are property of their respective owners.4
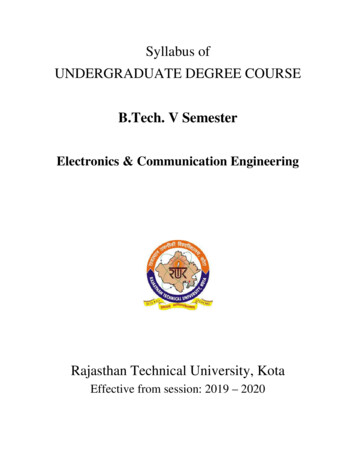
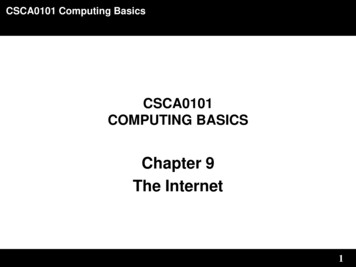
The Global InternetExecutive OverviewHIGHLIGHTSIN THIS EDITIONThe trends driving the internet this yearare showing significant changes fromprevious years: Video is still dominant with almost 58%of overall downstream traffic, despiteoperators more aggressively managingvideo traffic. Over 50% of traffic on the internet isencrypted, and it will continue to grow.The majority of web traffic is encrypted,and more applications are leveragingsecure connections from end-to-end. Gaming is becoming a significantcontributor to traffic. More games aredelivering a good mobile experienceand are designed with ubiquitousconnectivity, capturing more mind sharewith consumers. File sharing is not dead. With morecontent choices and channels than everbefore, consumers do not have goodoptions to get access to all the contentthat may interest them and are stillresorting to piracy. Live events are beginning to have anoticeable effect on networks. The WorldCup and Super Bowl generate spikes innetworks worldwide, exceeding YouTubeand other video applications.Phenomena ReportOctober 2018The internet is more diverse than everPrevious Global Internet Phenomena reports highlighted a few applications that dominated the worldscene: Netflix, YouTube, Facebook, and BitTorrent were the biggest historical traffic sources. All ofthose applications are still big players, but the internet landscape has significantly diversified; regionalvariations are showing up throughout this report, creating a new tenet for network operators that “allinternet trends are local.”If there is one common theme to this Global InternetPhenomena, it is that the traffic on the internet ismore encrypted than ever. A conservative estimateof the data shows that over 50% of the traffic onthe internet is encrypted. Some applications arenot always encrypted, and Sandvine did not countthese as part of that 50% number. Even with theconservative view, TLS traffic has grown (showing ashift to a more secure protocol than SSL).For consumers, this is great – their traffic has betterprivacy than ever before. This does not protect themfrom hacks or data breaches, but at least ensuresthat their traffic cannot be “read” by anyone thatgets access to network traffic, especially with theincreasing use of public WiFi connectivity.For network operators, this trend creates a hugechallenge. Network operators – fixed, mobile,WiFi, and even satellite – need to understand thecomposition of traffic (not the content) so thatthey can build out a network capable of meetinga consumer’s quality expectations. With a higherpercentage of traffic encrypted every day, operatorsare struggling to gain a holistic view of their networks.We will talk quite a bit about video in this report,but it is important to highlight the diversity ofvideo streaming traffic around the world. AlthoughNetflix and YouTube are still the largest names instreaming (as you will see in the reports) there is anever growing number of other streaming providerscapturing consumer screen time.Over 50% of the traffic on the internet is encryptedUnencrypted TrafficEncrypted TrafficThis video diversity trend has led directly to thecontinued relevance of file sharing, which is still a majorsource of internet traffic. Consumers that cannotafford to subscribe to all of the different servicesturn to file sharing to get the latest content, even asgovernments attempt to shut down sharing sites.Gaming traffic continues to grow. This report has aspecific highlight on gaming, which is now the thirdlargest contributor to downstream bandwidth usage.#1#1#2Finally, live events are registering on the “internetRichter scale,” causing major traffic spikes duringthe World Cup and Super Bowl. These traffic spikesare truly “local,” and they need to be planned for byoperators, or else quality of experience (QoE) willsuffer for consumers.File sharing is not dead: BitTorrent is #1 inEurope and APAC, and #2 in Americas forupstream bandwidth consumption. PREVIOUSSTARTNEXT Copyright 2018 Sandvine. All rights reserved. All other trademarks are property of their respective owners.5
The Global InternetGlobal Application Traffic ShareGLOBAL APPLICATIONCATEGORY TRAFFICSHARE1VIDEO 5.10%5MARKETPLACE4.61%1.90%6FILE 1%7.48%9STORAGE1.41%20.98%2.68%3.73%9.37%AUDIO STREAMING0.46%10 1.05%Phenomena ReportOctober 2018Video is bigger than everIt is not a surprise that streaming video is the top application type on the internet. If you had askedanyone what category of application they thought would be at the top, video would win by a landslide.What might not have been expected is the gains that other application types have made even whilevideo continues to drive downstream bandwidth usage. Gaming has gained in relevance, and filesharing has experienced a bit of a resurgence.Streaming Video: Streaming video includes notonly over-the-top (OTT) video streaming serviceslike Netflix, YouTube, and Amazon Prime, but alsooperator-based streaming and direct consumerstreaming. Many operators offer streaming ofthe content that they own the rights to (DirectTV,Comcast, etc.) as well as just about every networkstreaming their content in some way. Social networkvideo sharing and direct video connectivity (likeFaceTime) are also included.Social: The largest social networks worldwide (43for this edition) were uniquely tracked in this report.Web: Web traffic is the container for all web trafficthat Sandvine does not attribute to an individualapplication. This includes web browsing, HTTPdownloads, mobile applications that are simplyweb front ends, or applications that have notbeen classified by Sandvine yet that use HTTPas a transport protocol. However, with over 5300signatures making up the data for this report, that“bucket” is pretty small.Storage: Cloud storage usage is becoming aubiquitous service for consumers. Dropbox, iCloud,Google Drive, SharePoint, and many others havebecome an integral part of the mobile experience.Gaming: Gaming traffic includes downloads frommajor gaming networks (PlayStation Network, XboxLive, Steam, Nintendo, etc.) as well as traffic fromspecific games. The actual “gaming” traffic on thenetwork when downloads are included is likelyhigher due to marketplace downloads.Marketplace: Includes iTunes, Google Play, andWindows Store, as well as updates for major devicetypes.File Sharing: BitTorrent is the dominant file sharingprotocol on the internet, and continues to remain asignificant source of internet traffic.Almost 58% of downstream traffic on the internet is videoAMERICAS TOP 5EMEA TOP 4APAC TOP 3#1#1#1#2#2#2#3#3#3#4#4#5Security: This category is a bucket for securitynetwork infrastructure traffic as well as VPN traffic.Messaging: Messaging includes both VoIP as wellas chat applications; whether this is an operatordelivered voice service, an OTT offering, or a socialnetwork offering, consumers use these apps daily.Audio Streaming: Spotify, Apple Music, GooglePlay Music, and other audio streaming services areincluded in this category. PREVIOUSSTARTNEXT Copyright 2018 Sandvine. All rights reserved. All other trademarks are property of their respective owners.6
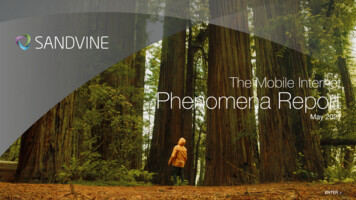
The Global InternetGlobal Application Traffic ShareGLOBAL APPLICATIONTRAFFIC SHARE1NETFLIX14.97%2HTTP MEDIA STREAM13.07%4.84%3YOUTUBE11.35%2.92%3.03%4RAW MPEG-TS4.39%4.11%5HTTP (TLS)4.06%6QUIC3.87%7AMAZON PRIME3.69%0.87%8HTTP DOWNLOAD3.69%1.45%9HTTP3.22%4.80%PLAYSTATION DOWNLOAD0.45%10 2.67%October 2018Web and video traffic dominateThe top 9 applications worldwide are either web or video, clearly indicating where consumers spendtheir data allowances on networks, if not necessarily their time.Netflix: No introduction is needed for Netflix. Thestreaming giant is available in all but four countriesworldwide, and appears in the top 10 of all theregions in this report. The sheer volume of Netflixon fixed networks propels it to this spot as the topvideo site in the world.HTTP Media Stream: A “protocol” category ratherthan a specific application that collects videostreaming not separately classified by Sandvine.This category has been growing rapidly as morevideo services are launched.2.06%1.43%Phenomena ReportYouTube: YouTube is still the dominant videostreaming application consumed on mobile.Netflix takes the lead due to sheer volume in fixednetworks as well as higher resolution videos beingthe norm. YouTube benefits from being the mostcommonly “embedded” video on other sites,including Facebook.Raw MPEG-TS: Another video “protocol” used bystreaming services, MPEG-TS is commonly used byoperators streaming video to their subscribers frombroadcast channels, as well as for many securityvideo camera systems.QUIC: QUIC is a User Datagram Protocol (UDP)protocol championed by Google. QUIC has securityprotection equivalent to TLS/SSL, and can supportmultiplexed connections to reduce latency. Althoughnot exactly a proxy, the most popular sites that useQUIC are Google sites.14 hours Amazon Prime: Amazon’s Prime service has beena huge market success, and Prime Video has beenincreasing its footprint not only in the US, but isnow available in 200 countries worldwide and isincreasing its share of global traffic.HTTP Download: Sandvine breaks out HTTPdownload from web browsing, as it has different QoEexpectations. Examples of HTTP download wouldbe when you download a PDF or file directly from awebsite, which is a very common user activity.HTTP: Plain old HTTP browsing with no security.Google has aggressively moved to penalize sitesthat do not offer secure connections, but manyapplications that use HTTP as a transport protocolstill use plain text for data.101GB downloadVIDEO7GB per hourCall of Duty: Black Ops 3 is a 101GB download. In contrast, an hour of 4K video on Netflix is about7GB per hour, making a Call of Duty download equivalent to watching over 14 hours of 4K video!PlayStation Network Download: Most games aresold via download now, and some games are huge.Call of Duty: Black Ops 3 is 101GB, and GrandTheft Auto V is 65GB. In contrast, an hour of 4Kvideo on Netflix is about 7GB per hour, making aCall of Duty download equivalent to watching over14 hours of 4K video! PREVIOUSSTARTNEXT Copyright 2018 Sandvine. All rights reserved. All other trademarks are property of their respective owners.7
The Global InternetGlobal Trends: Beyond the Top 10Phenomena ReportOctober 2018Mobile AdvertisingApplications in Top 200HIGHLIGHTSNest Thermostat: The most significantIoT device pops up as 55th on the list ofconnections at .16% and .01% of uploadbandwidth.Voice Assistants: Alexa versus Siri isa network dead heat, with each onerepresenting .05% of connectionsworldwide, and Alexa at 97th and Siri at102nd.Nest Thermostat:55th of all connectionsat 0.16%344th of all uploadbandwidth at 0.01%Mobile Advertising: DoubleClick(Google), Flurry, AppsFlyer, Adjust,and AppLovin all made the top 200applications, showing that advertising isstill powering the monetization of a lot ofmobile applications.Mobile Crashes: Crashlytics was .32%of all connections (40th worldwide), andit was also .05% of upload traffic (137thworldwide) for upstream bandwidth.Cryptocurrency: Bitcoin and Ethereumhave been in the news quite a bit lately.They are also growing on the internet.Bitcoin was .02% (224th worldwide)of upstream traffic, likely representingBitcoin miners reporting back to servers.Ethereum was .01% of all connections(277th worldwide), showing it is gainingmarket momentum.Alexa0.32% of all connections0.05% of Upstream Bandwidth0.01% of all connectionsvs0.05% of all connections97th worldwide277th worldwideSiri0.05% of all connections102nd worldwide0.02% of Upstream Bandwidth224th worldwide 0.01% of all Upstream448th worldwide0.04% of all Upstream143rd worldwide PREVIOUSSTARTNEXT Copyright 2018 Sandvine. All rights reserved. All other trademarks are property of their respective owners.8
Americas: Downstream Application Traffic ShareAMERICAS TRAFFICSHARE TOP 101NETFLIX19.10%2HTTP MEDIA STREAM16.51%3RAW MPEG-TS10.05%4AMAZON PRIME7.74%5YOUTUBE7.53%6HTTP (TLS)4.49%7HTTP DOWNLOAD4.87%8HTTP4.46%9XBOX LIVE DOWNLOAD2.09%QUIC10 2.07%The Global InternetPhenomena ReportOctober 2018Netflix, anyone?Netflix has consistently been at the top of therankings in the Americas, and that continueswith 19.10% of total downstream traffic beingNetflix. The sheer volume of Netflix traffic inthe Americas is what propels it to worldwideleadership. At peak hour on fixed networks,this number can spike as high as 40% on someoperator networks in the region.Although Netflix is at the top, other video servicesare starting to make an impact. HTTP Media Streamand Raw MPEG-TS represent a generic bucket forother OTT or operator streaming video services,showing diversity outside the top OTT services.Amazon Prime continues to grow their bandwidthshare in the Americas, and several other major OTTplayers sit right outside the top 10 – more on that later!YouTube sits fifth, and has a much stronger showingon mobile networks than on fixed, and since thisreport has more fixed bandwidth than mobile forthe Americas, it biases the Americas numbers forthe OTT content providers.Gaming makes an appearance, with Xbox Livedownloads making up 2.09% of downstream traffic,narrowly beating out the PlayStation Network at1.56% (13th) in the region. Gaming downloads arean increasing amount of downstream, and Twitch isalso in this ecosystem.Netflix’s dominance is even more impressive when you examine how they havethe best efficiency for video streaming of the major video providers.The top left image shows Netflix’s Hot Fuzz at 459MB for a 2 hour movie.The top right shows iTunes download – 4.6GB for 1080, 4.15GB for 720, and1.86GB for SD. The bottom right shows a few Amazon Prime videos, whichrange from 579MB for 1hr 29mins to 1.5GB for 2hr 7min.Even with Netflix’s efficiency, they are still the leader not only in the Americas,but worldwide. Netflix deserves a lot of credit for reducing the throughputneeded to stream their services. This means that Netflix could easily be 3x theircurrent volume and at 40% of network traffic — all the time.It also bears mentioning that the number of mobile operators managing videotraffic by offering unlimited viewing for reduced resolutions, which is alsodepressing the volume of video traffic worldwide. PREVIOUSSTARTNEXT Copyright 2018 Sandvine. All rights reserved. All other trademarks are property of their respective owners.9
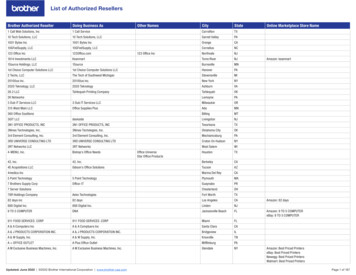
Americas: Upstream Application Traffic ShareAMERICAS TRAFFICSHARE TOP 101RAW MPEG-TS9.99%2BITTORRENT UPLOAD9.21%3NETFLIX5.13%4RTP4.82%5HTTP4.79%6HTTP MEDIA STREAM3.63%7GOOGLE3.48%8HTTP (TLS)3.20%9ICLOUD PHOTO STREAM3.07%The Global InternetPhenomena ReportOctober 2018Video on the upstream?We often think of video as a downstreamphenomena on networks, but consumers arealso sending more video into the internet thanever before.Raw MPEG-TS is the top upstream application, andit is joined by Netflix and HTTP media streaming inthe top 10. MPEG (video cameras/surveillance) andHTTP media streaming (many different live streamingservices) make sense, but why Netflix? Netflix isconstantly “bookmarking” your location; as usersbrowse the library, Netflix interactively starts videopreviews, which has had a huge impact on theupstream. This has made video a major player in theupstream, even with social networking video havingless impact than expected on networks.DOWN1Netflix user watching video2UPUser’s sytem sends abookmark for locationFile sharing appears on the upstream at #2, butwe’ll talk more about file sharing in other regionswhere it is the dominant force for upstream trafficutilization.RTP also pops us, representing a collection ofVoIP services using generic VoIP protocols, mainlyoperator-branded VoIP services (not OTT VoIP).3UPUser moves cursor tonew movieiCloud Photo Stream makes the first appearance foran Apple product as well as a storage application,illustrating the popularity of mobile photos thatimmediately get uploaded to the cloud. Photo trafficis also part of the Google number from Androids.There are also lots of VPNs in the Americas, asIPSec is 10th on the list at 2.65%, representing bothbusiness users and privacy VPN services.DOWN4Netflix updates screenand shows previewIPSEC VPN10 2.65% PREVIOUSSTARTNEXT Copyright 2018 Sandvine. All rights reserved. All other trademarks are property of their respective owners.10
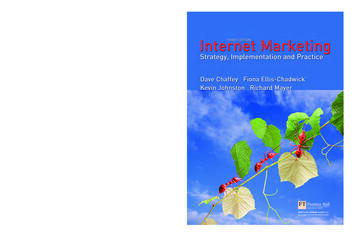
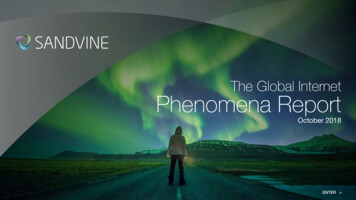
The Global InternetAmericas Spotlight: Connected FitnessPhenomena ReportOctober 2018Get on your bikes and ride!Peloton’s All For One online rideLive:18,000 participants 144Gbps throughput 14.4TB of volumeOverall:56,000 participants 45TB of volumeThere is a new “streaming” service on the horizon that has the potential to change streaming patternson networks worldwide. In the US, a new service has achieved cult status, and is rapidly movinginto the mainstream as followers pile on behind it. That trend is connected fitness. I am not talkingabout Fitbit-style connected fitness, I am talking about “let me workout with a streaming video from aremote class” connected fitness.The pioneer in this space is Peloton, who has oneof the highest Net Promoter Scores (NPS) in themarket, for their connected bike. The bike comeswith a gorgeous 22 in HD display with a resolutionof 1080 x 1920 pixels, and all of the video contentis streamed in 1080p HD. Peloton streams up to 14classes a day, and has an ever-changing library of 4000 on demand classes. Peloton is valued at 4B– highlighting the growing popularity of connectedfitness, and Peloton boasts over one million payingsubscribers in the US. Most classes show severalthousand participants within the first week afterbeing recorded, and many continue to get ridesfor months or even a few years (theme rides areextremely popular — Jennifer Jacob’s Guns andRoses Ride is highly rated!).over 45TB of volume. Some riders have taken theride multiple times, but only their top score is shownand they are only counted once as a participant.With a growing installed base, a connected treadmillon the way, and many competitors following theconnected fitness craze, operators should keepan eye on connected fitness as a trend to watchout for. Global expansion begins with Canada andEurope in the fall of 2018.Why are we covering them in the Global InternetPhenomena report? In July, during their “All ForOne” ride, over 18,000 people joined in live tostream a single workout. Since each stream is anHD stream ( 8Mbps and over 800MB of volume),this is a pretty significant live event on par withother sporting events. For their provider, that was144Gbps of throughput and 14.4TB of volume.Since then (as shown in the screenshot), over56,000 people have streamed that ride, totalling PREVIOUSSTARTNEXT Copyright 2018 Sandvine. All rights reserved. All other trademarks are property of their respective owners.11
The Global InternetEMEA: Downstream Application Traffic ShareEMEA APPLICATIONTRAFFIC SHARE TOP 101YOUTUBE16.10%2NETFLIX12.99%3HTTP MEDIA STREAM10.30%4AMAZON PRIME6.06%5QUIC5.41%6PLAYSTATION DOWNLOAD3.75%7TWITCH3.11%8HTTP (TLS)2.93%9STEAM DOWNLOAD2.84%Phenomena ReportOctober 2018Got time for a game?Video is huge in EMEA just like the rest of theworld, but with a different order than others, andgaming contributes a significant portion of trafficto the overall downstream traffic volume.YouTube reigns in EMEA, which is a very mobilecentric market. Netflix, HTTP streaming, andAmazon appear in the top 10, albeit with lower1UPUser sends purchaseinformation when buyinga gamepercentages than they had in the Americas dueto more diversity in content. Twitch, owned byAmazon, appears at #7 in the list as a videosource. Twitch’s biggest content draw is actuallygaming, which makes two other appearances in theEMEA top 10 – PlayStation download and Steamdownload. Twitch is a popular platform for gamersto stream their games live, as well as the platformthat is most often utilized by gaming companies tobroadcast their sponsored tournaments.Steam makes an appearance in the Phenomenafor the first time in EMEA, and can be
single comprehensive view of internet traffic across all network types. A future edition will break out separate fixed and mobile traffic composition. Within each section, Sandvine measured the global traffic share for applications from several different perspectives: Downstream: This is the traffic volume downloaded from the internet.