Transcription
SUGI 27Statistics and Data AnalysisPaper 247-27Discriminant Analysis, A Powerful Classification Technique in Data MiningGeorge C. J. FernandezDepartment of Applied Economics and Statistics / 204University of Nevada - RenoReno NV 89557ABSTRACTData mining is a collection of analytical techniquesused to uncover new trends and patterns in massivedatabases. These data mining techniques stressvisualization to thoroughly study the structure of dataand to check the validity of the statistical model fitwhich leads to proactive decision making.Discriminant analysis is one of the data miningtechniques used to discriminate a single classificationvariable using multiple attributes. Discriminantanalysis also assigns observations to one of thepre-defined groups based on the knowledge of themulti-attributes. When the distribution within eachgroup is multivariate normal, a parametric method canbe used to develop a discriminant function using ageneralized squared distance measure. Theclassification criterion is derived based on either theindividual within-group covariance matrices or thepooled covariance matrix that also takes into accountthe prior probabilities of the classes. Non-parametricdiscriminant methods are based on non-parametricgroup-specific probability densities. Either a kernel orthe k-nearest-neighbor method can be used togenerate a non-parametric density estimate in eachgroup and to produce a classification criterion. Theperformance of a discriminant criterion could beevaluated by estimating probabilities ofmis-classification of new observations in thevalidation data. A user-friendly SAS applicationutilizing SAS macro to perform discriminant analysisis presented here.Car93 data containingmulti-attributes is used to demonstrate the features ofdiscriminant analysis in discriminating the three pricegroups, “LOW”, “MOD”, and “HIGH” groups.INTRODUCTIONData mining is the process of selecting,exploring, and modeling large amounts of data touncover new trends and patterns in massivedatabases. These analyses lead to proactivedecision making and knowledge discovery in largedatabases by stressing data exploration tothoroughly study the structure of data and to checkthe validity of statistical models that fit.Discriminant Analyis (DA), a multivariatestatistical technique is commonly used to build apredictive / descriptive model of groupdiscrimination based on observed predictorvariables and to classify each observation into oneof the groups. In DA multiple quantitativeattributes are used to discriminate singleclassification variable. DA is different from thecluster analysis because prior knowledge of theclasses, usually in the form of a sample from eachclass is required. The common objectives of DAare i) to investigate differences between groups ii)to discriminate groups effectively; iii) to identifyimportant discriminating variables; iv) to performhypothesis testing on the differences between theexpected groupings; and v) to classify newobservations into pre-existing groups.Stepwise, canonical and discriminantfunction analyses are commonly used DAtechniques available in the SAS systems STATmodule [SAS Inst. Inc. 1999]. CAR93 datacontaining multi-attributes, number of cylinders(X2), HP (X4), car width (X11), and car weight(X15) are used here to demonstrate thefeatures of discriminant analysis in classifyingthree, “LOW (2)”, “MOD (3) ”, and “HIGH (1)”price groups. A user-friendly SAS macrodeveloped by the author utilizes the latestcapabilities of SAS systems to perform stepwise,canonical and discriminant function analysis withdata exploration is presented here. The users canperform the discriminant analysis using their databy following the instructions given in theappendix and by downloading the SAS macro-callfile from the author’s home page athttp://www.ag.unr.edu/gf.
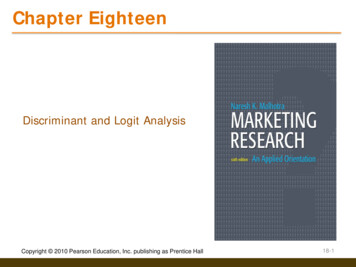
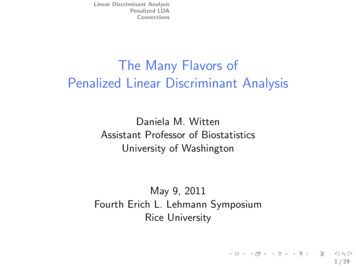
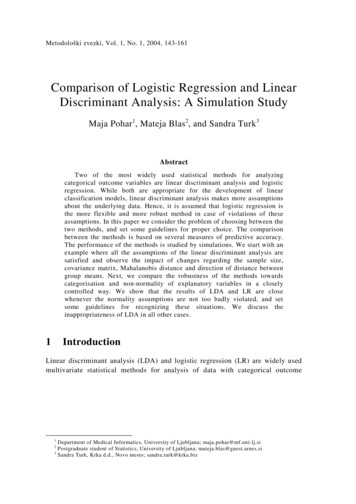
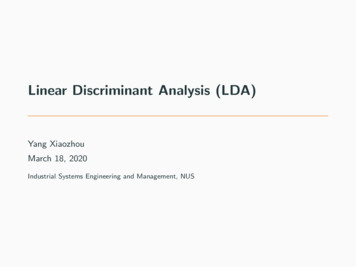
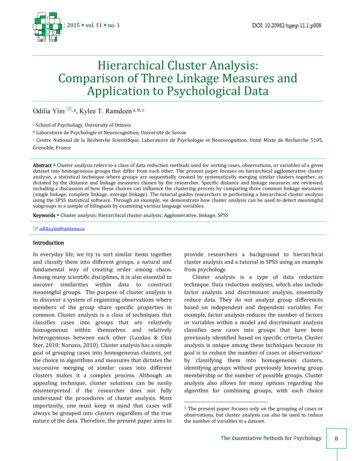
SUGI 27Statistics and Data AnalysisData exploration and checking for multivariatenormality and outliers.(33.368, p-val : 0.0001) clearly supported thehypothesis that afteradjusting for the group differences that theseFigure 1 Group discrimination in a simple scatterplotsExamining the group discrimination based on simplescatter plots between any two discriminationvariables is the first step in data exploring. Anexample of simple two-dimensional scatter plotsshowing the discrimination of three price groups ispresented in Figure 1.These scatter plots are useful in examining therange of variation and the degree of linearassociations between any two attributes. Thescatter plot presented in Fig.1 revealed the strongcorrelation existed between HP (X4) and weight(X15) and between HP (X4) and width (X11).These two attributes appeared to discriminate thethree price groups to a certain degree.Checking for multivariate normality: The rightchoice of selecting parametric vs. non-parametricdiscriminant analysis is dependent on theassumption of multivariate normality within eachgroup. The car price data within each price group isassumed to have a multivariate normal distributionwith a common covariance matrix. This multivariatenormality assumption can be checked by estimatingmultivariate skewness, kurtosis, and testing fortheir significance levels. The Quantile-Quantile (QQ plot) plot of expected and observed distributions[Khattree and Naik 1995] of multi-attributeresiduals after adjusting for the group means couldbe used to graphically examine for multivariatenormality. The estimated multivariate skewness(44.934, p-val:0.001 ) and multivariate kurtosisFigure2 Checking for Multi-variate normalityin Q-Q Plot.four multi-attributes do not have a jointmultivariate normal distribution. A strongdeparture from the 450 angle reference line in theQ-Q plot (Fig. 2) supported this finding. Thus,DA based on non-parametric distributions couldbe considered as an appropriate technique fordiscriminating the three price groups based on the4 attributes (x2, x4, x11 and x15).Checking for multi-variate outliers Multivariateoutliers can be detected in a plot between theFigure 3 Checking for multi-variate outliersdifference of robust Mahalanobis distance - Chisquared quantile vs. Chi-squared quantile value[Khattree and Naik 1995]. Observations 56, 82,73, and 9 were identified as influential
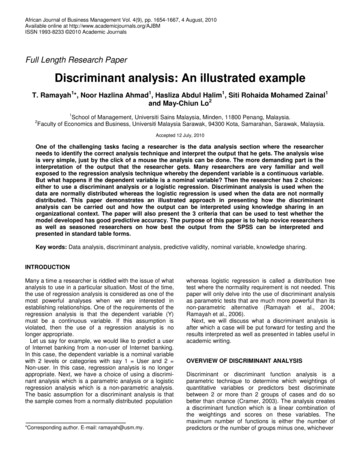
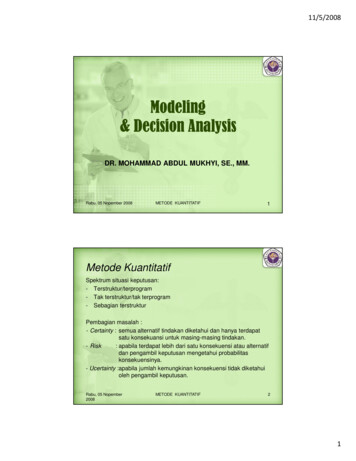
SUGI 27Statistics and Data Analysisobservations since the differences between robustMahalanobis distance and Chi-squared quantilevalue were larger than 5 and fall outside from themajority of the observations. It is important toexamine the impact of these influential observationson discriminant analysis.Canonical Discriminant Analysis (CDA):Canonical DA is a dimension-reduction techniquesimilar to principal component analysis. The mainobjective of CDA is to extract a set of linearcombinations of the quantitative variables that bestreveal the differences among the groups. Given anominal group variable and several quantitativeattributes, the CDA extracts linear combinations ofthe quantitative variables (canonical variables) thatcapture between-class variation in much the sameway that principal components summarize totalvariation [SAS Inst. Inc. 199]. Moreover, thesecanonical functions will be independent ororthogonal, that is, their contributions to thediscrimination between groups will not overlap. It iscustomary to standardize the multi attributes so thatthe canonical variables have means that are equal tozero and pooled within-class variances that areequal to one.The extracted canonical variables have thehighest possible multiple correlation with thegroups. This maximal multiple correlation is calledthe first canonical correlation. The coefficients ofTotal Canonical StructureVariable 1244Table 1 Canonical structure loadingsthe linear combination are the canonicalcoefficients or canonical weights. The derivedcomposite variable defined by the linearcombination is the first canonical variable orcanonical component. The second canonicalcorrelation is obtained by finding the linearcombination uncorrelated with the first canonicalvariable that has the highest possible multiplecorrelation with the groups. In CDA, the process ofextracting canonical variables are repeated until youextract the maximum number of canonical variablewhich is equal to the number of groups minusone, or the number of variables in the analysis,whichever is smaller. The standardizeddiscriminant function coefficients indicate thepartial contribution of each variable to thediscriminant function(s), controlling for otherattributes entered in the equation. The structurecoefficients indicate the simple correlationsbetween the variables and the discriminantfunction or functions. The structure coefficientsshould be used to assign meaningful labels to thediscriminant functions. The standardizeddiscriminant function coefficients should be usedto assess each variable's unique contribution tothe discriminant function. These structureloadings are commonly used when interpretingthe meaning of the canonical variable becausethe structure loadings appear to be more stable,and they allow for the interpretation of canonicalvariable in the manner that is analogous to factoranalysis.The structure loadings for the first two canonicalvariables are presented in Table 1. The first andthe second canonical functions accounts for 37%and 17% of the variation in the discriminatingvariables. All four multi attributes had thepositive largest loadings on CAN1 and the X4 andX2 had a moderate negative loadings on CAN2.The extracted canonical variable scorescan be used to plot pairs of canonical variables ina two-dimensional bi-plots to aid visualinterpretation of group differences. Interrelationships among the four multi-attributes andthe discriminations of the three groups arepresented in Figure 4 & 5. The first canonicalfunction which has largest loadings on all fourattributes discriminated the LOW (2) price groupfrom other two MOD (3) and HIGH (1) pricedgroups successfully. The second canonicalfunction which has a moderate size loadings onX2and X4 discriminated the HIGH (1) pricegroup from other two MOD (3) and LOW (2)priced groups successfully. Very small amount ofoverlap between the LOW(2) and MOD (3)groups were observed (Fig. 4).
SUGI 27Statistics and Data AnalysisFigure4: Bi-plot display of multi-attributes andthe group discriminationmultivariate normal, a parametric method can beused to develop a discriminant function using ameasure of generalized squared distance. Thediscriminant function, also known as aclassification criterion, is estimated by measuringgeneralized squared distance [SAS Inst. Inc.1999]. The classification criterion can be derivedbased on either the individual within-groupcovariance matrices ( a quadratic function) or thepooled covariance matrix (a linear function). Thisclassification criterion also takes into account theprior probabilities of the discriminating groups.Each observation is classified in the group fromwhich it has the smallest generalized squareddistance. The posterior probability of anobservation belonging to each class could be alsoestimated in PDA.Classification results based on parametricQuadratic DF and error rates based on crossvalidation are presented in Table 2. The overalldiscrimination was not satisfactory since none ofthe HIGH priced group was classified as HIGHand out of 25 medium priced cars, 7 of themwere identified as LOW and 1 was HIGH. Theoverall error rate was 32% indicating about 1/3 ofthe cars were mis-classified based on parametriccriterion. Therefore evaluation of otherdiscriminating criterion becomes important.Number of Observations and Percent Classifiedinto GROUPFromGROUPHLMTotalFigure 5: Biplot display of multi-attributes andHthe group means.LPredictive Discriminant Analysis (PDA): PDA isa predictive classification technique deals with a setof multi-attributes and one classification variable,the latter being a grouping variable with two ormore levels. Predictive discriminant analysis issimilar to multiple regression analysis except thatPDA is used when the criterion variable iscategorical and nominally scaled. As in multipleregression, in PDA a set of rules is formulatedwhich consists of as many linear combinations ofpredictors as there are categories, or groups. APDA is commonly used for classifyingobservations to pre-defined groups based onknowledge of the quantitative attributes. When thedistribution within each group is assumed to 5102Error Count Estimates for l0.3265Table 2: Classification results based on parametricQuadratic DF and error rates based on crossvalidation
SUGI 27Statistics and Data AnalysisWhen no distribution assumptions withineach group can be made, or when the distribution isnot assumed to have multivariate normal, nonparametric methods can be used to estimate thegroup-specific densities. Non-parametricdiscriminant methods are based on nonparametricestimates of group-specific probability densities.Either a kernel method or the k-nearest-neighbormethod can be used to generate a non-parametricdensity estimate in each group and to produce aclassification criterion. The kernel method in SASsystems uses uniform, normal, Epanechnikov,biweight, or triweight kernels in the densityestimation [SAS Inst. Inc. 1999]. EitherMahalanobis or euclidean distance can be used todetermine proximity in the SAS DISCRIMprocedure [SAS Inst. Inc. 1999]. When the knearest-neighbor method is used, the Mahalanobisdistances are estimated based on the pooledcovariance matrix. Whereas in the kernel method,the Mahalanobis distances based on either theindividual within-group covariance matrices or thepooled covariance matrix is estimated.In non-parametric DA estimation, with theestimated group-specific densities and theirassociated prior probabilities, the posteriorprobability estimates of group membership for eachclass can be evaluated. The classification of anobservation vector x is based on the estimatedgroup specific densities from the calibration ortraining sample. From these estimated densities, theposterior probabilities of group membership at x areevaluated.classified from HIGH to LOW &MOD, 3observations were classified from LOW to MOD,and 6 observations were classified from MOD toLOW & OTHER groups. Thus an overall successrate of correct discrimination was about 76%.The details of the mis-classified observations arepresented in Table 4.The performance of a discriminantcriterion in the classification of new observationsin the validation data could be evaluated byestimating the probabilities of mis-classification orerror rates in the SAS DISCRIM procedure.These error-rate estimates include error-countestimates and posterior probability error-rateestimates. When the input data set is a SAS dataset, the error rate can also be estimated by crossvalidation. SAS uses two types of error-rateestimates to evaluate the derived classificationNumber of Observations and Percent Classifiedinto GROUPFromGROUPHLMTotalthThe classification results based on 4- nearest neighbor non-parametric PDA ispresented in Table 3. All 5 observations wereclassified from HIGH to MOD & OTHER , 3observations were classified from LOW to MODand OTHER groups, and 4 observations wereclassified from MOD to LOW and OTHER groups.Thus an overall success rate of correctdiscrimination was about 76%. Classification resultsand error rates based on non-parametric K 4nearest neighbor DFA was improved slightlycompared with the parametric PDA.The classification results based on nonparametric kernel density estimates with un-equalband width in Table 4. Three observation 102Error Count Estimates for 102Total0.2449Table 3: Summary of classification results anderror rates based on non-parametric K 4 nearestneighbor DFA.
SUGI 27Statistics and Data AnalysisNumber of Observations and Percent Classified into 34.6953.0612.241000.102040.387760.5102Error Count Estimates for 2Total0.2449Table 4: Summary of classification results anderror rates based on non-parametric kerneldensity estimates with un-equal band width.criterion based on parameters estimated by thetraining sample: i) error-count estimates and ii)posterior probability error-rate estimates. The errorcount estimate is calculated by applying thediscriminant criterion derived from the trainingsample to a test set and then counting the numberof mis-classified observations. The group-specificerror-count estimate is the proportion of misclassified observations in the group. If the testsample set is independent of the training sample, theestimate is unbiased. However, it can have a largevariance, especially if the test sample size is small[SAS Inst. Inc. 1999].When no independent test sets areavailable, the same data set can be used both tocalibrate and to evaluate the classification criterion.The resulting error-count estimate has an optimisticbias and is called an apparent error rate. To reducethe bias, the data can be split into two sets, one setfor deriving the discriminant function and the otherset for estimating the error rate. Such a split-samplemethod has the unfortunate effect of reducing theeffective sample size.Another way to reduce bias in estimatingthe classification error is cross validation[Lachenbrush and Mickey 1968]. In crossvalidation, n-1 out of n training observations in thecalibration sample are treated as a training set. Itdetermines the discriminant functions based onthese n-1 observations and then applies them toclassify the one observation left out. This isperformed for each of the n trainingobservations. The mis-classification rate for eachgroup is the proportion of sample observations inthat group that are mis-classified. This methodachieves a nearly unbiased estimate but with arelatively large variance.To reduce the variance in an error-countestimate Glick [1978] suggested a smoothederror-rate estimates. Instead of summing valuesthat are either zero or one as in the error-countestimation, the smoothed estimator uses acontinuum of values between zero and one in theterms that are summed. The resulting estimatorhas a smaller variance than the error-countestimate. The posterior probability error-rateestimates are smoothed error-rate estimates. Theposterior probability estimates for each group arebased on the posterior probabilities of theobservations classified into that same group. Theposterior probability estimates provide goodestimates of the error rate when the posteriorprobabilities are accurate. When a parametricclassification criterion (linear or quadraticdiscriminant function) is derived from a nonnormal population, the resulting posteriorprobability error-rate estimators may not beappropriate.The smallest overall error rate based oncross-validation was 24.4% for the Car93 databased on the non-parametric kernel densityestimates with un-equal band width (Table 4).The overall error rate is estimated through aweighted average of the individual group-specificerror-rate estimates, where the prior probabilitiesare used as the weights. To reduce both the biasand the variance of the estimator, Hora andWilcox [1982] compute the posterior probabilityestimates based on cross validation. The resultingestimates are intended to have both low variancefrom using the posterior probability estimate andlow bias from cross validation. They use MonteCarlo studies on two-group multivariate normaldistributions to compare the cross validationposterior probability estimates with three otherestimators: the apparent error rate, crossvalidation estimator, and posterior probabilityestimator. They conclude that the cross validationposterior probability estimator has a lower mean
SUGI 27Statistics and Data Analysissquared error in their simulations.The PDA based on non-parametric kernelPosterior Probability of Membership in GROUPObsFromClassified intoGROUPGROUPHLM2 HL*00.64740.35264 HM*0.000100.99995 HM*0.000100.999910 LM*0. 0010.30430.694711 LM*0.05440.04590.899725 LM*0.00110.07930.919637 ML*0.00270.860.137241 ML*0.00020.57040.429446 ML*0.00990.810.1847 ML*0.01630.79270.19148 MH*0.705400.294650 ML*0.00740.71350.2791Table 5. Table of mis-classified observationsbased on non-parametric kernel density estimateswith un-equal band width error rates based oncross-validation.density estimates with un-equal band width wasselected as the best PDA analysis for this car93data based on comparing the overall error rates fordifferent PDA methods . The list of miss-classifiedobservations and the posterior probability estimatesare presented in table 5. The discriminant criterionderived from the training data set can be applied toa second independent validation validation data setThe classification results of the validation data setbased on non-parametric kernel density estimateswith un-equal band width is presented in Table6. Two observation were classified from HIGH toMOD, and 7 observations were classified fromMOD to LOW & HIGH groups. Thus an overallsuccess rate of correct discrimination was about81%.The classification results of the validationdata set was equally comparable with theclassification results of the training data set.However, due to the smaller sample size used inthe training data set the applicability of theclassification criterion derived has limitedpotential.A user-friendly SAS applicationdeveloped by the author utilizes the latestcapabilities of SAS macros to perform stepwise,canonical and discriminant function analysis withdata exploration is available now. The users candownload the SAS macro-call file and performthe discriminant analysis reported in this paperusing their data by following the instructionsgiven in the Appendix and by downloading theSAS macro-call file from the author’s home pageat http://www.ag.unr.edu/gf.REFERENCES1.Number of Observations and Percent Classifiedinto 4310025.5841.8632.560.333330.333330.33333Error Count Estimates for .4.5.Total0.1969Table 6. Classification results for an independentvalidation data set based on non-parametric kerneldensity estimates with un-equal band width errorrates based on cross-validationGlick N (1978) Additive estimators forprobabilities of correct classificationPattern Recognition 10: 211-222[1].Hora S. C and Wilcox J.B. (1982)Estimation of error rates in severalpopulation discriminant analysis. J. of.Marketing Research. 19:57-61Khattree R. and Naik D.N , (1995)Applied Multivariate statistics with SASsoftware Cary NC . SAS Institute Inc.Lachenbruch P. A and Mickey M.A.(1968) Estimation of error rates indiscriminant analysis Technometrics 101-10SAS Institute Inc. (1999) SAS/STATUsers Guide, Version 8, Cary NC .SASInstitute IncSAS, SAS/GRAPH, SAS/IML and SAS/STATare registered trademarks of SAS Institute Inc. inthe USA and other countries. indicates USAregistration.
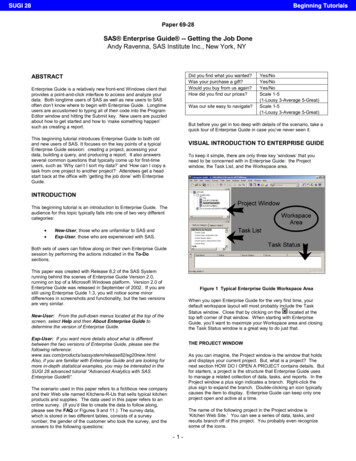
SUGI 27Statistics and Data AnalysisCONTACT ADDRESSDr. George C.J. FernandezExperimental Station Statistician and AssociateProfessor in Applied StatisticsDepartment of Applied Economics/Statistics/204University of Nevada- Reno Reno NV 89557.(775) 784-4206E-mail: GCJF@unr.eduAUTHOR’S BIODr. George C.J. Fernandez currently serves as thestatistician for the Nevada Experimental station andCooperative Extension. He is also an AssociateProfessor in the department of Applied economicsand statistics. He has more than 14 years ofexperience in teaching courses such as introductorystatistical methods, design and analysis ofexperiments, linear and non-linear regression,multivaraite statistical methods and SASprogramming. He is a professional SASprogrammer and has over 20 years experience inSAS/BASE, SAS/IML, SAS/STAT , SAS/QCSAS/ETS, SAS/INSIGHT, SAS/ANLALYST,SAS/LAB, SAS/ASSIST and SAS/GRAPH. He haswon best paper and poster presentation awards atthe regional and international conferences.Recently, he has presented invited full-dayworkshops on “Applications of user-friendlystatistical methods in Data mining at the AmericanStatistical Association Joint meeting in Atlanta andat the Pre-Western SAS users Conference inArizona. Many international and national SAS usersare currently using his user-friendly SASapplications for data analysis via on-line. He hasorganized 7th Western Users of SAS conference(WUSS) at Los Angeles in 1999 and currentlyserving as the vice president for WUSS executivecommittee Inc.APPENDIXInstructions for downloading and running theDISCRIM SAS macro:As an alternative to the point-and-clickmenu interface modules, a user-friendly SASmacro application to perform a completediscriminant analyis developed by the author isnow available for the public to download . Thismacro approach integrates the statistical andgraphical analysis tools available in SAS systemsand provides complete data analysis tasks quicklywithout writing SAS program statements byrunning the SAS macros in the background. Themain feature of this approach is that the users canperform graphical discriminant analysis quicklyusing the SAS macro-call file available fordownloading. Using this MACRO APPROACH,the analysts can effectively and quickly performcomplete data analysis and spend more time inexploring data, interpretation of graphs and outputrather than debugging their program errors etc.REQUIREMENTS:This macro application was developed in Win/NTSAS version 6:12 and was tested in both version6:12, 8.1, and 8.2. The requirements for usingthese SAS MACROs are:1) A valid license to run the SAS software onyour PC.2) SAS modules such as SAS/BASE,SAS/STAT, SAS/IML and SAS/GRAPH shouldbe installed in your computer to get the completeresults.3) A working internet connection to access theDISCRIM macro while executing the thedownloaded macro-call file.The steps for performing discriminant analysis bythe user-friendly SAS MACRO “DISCRIM”:Step 1: Create a SAS data setThis data should contain the following variables:One classification group (GROUP) variable,which should be a categorical variable. andseveral continuous or numeric multi attributevariables.Step 2: Downloading the macro-call file:Visit the home page at http://www.ag.unr.edu/gf,click the running puppy dog and follow theinstructions given in the page, to go to the SASmacro download page. Go to the miscellaneoussection and download the DISCRIM.SASMACRO-CALL file by clicking the sample demolink, and save this file to a disk and open it in theSAS program editor window. Click the RUNicon to open the DISCRIM MACRO-CALLwindow (Figure 6).Step 3: Input the required values by following theinstructions provided in the SAS MACRO-CALLwindow, DISCRIM (Figure 6).
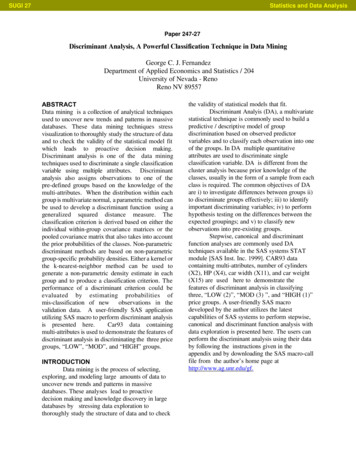
SUGI 27Statistics and Data Analysisoutput file.13. Display or save the graphics and SAS out putfilesFigure 6. Screen shot of the DISCRIM macro-callwindowMacro–call options:1. Input the name of the temporary or permanentSAS data set2. To perform Exploratory analysis and stepwisediscriminant analysis type YES in the field #2. Nooutput for CDA and PDA are not produced.Options for saving the SAS output and SASgraphics files.Users can select the folders to save theSAS output (Text file in SAS Version 8.0, andRTF file and HTML files in version 8.1 andabove, PDF file in version 8.2 and above) and thegraphics files by inputting the folder names in theMACRO-CALL window. Also, the users canselect one of the following graphic file formatwhen saving the graphics produced by the SASMACRO:Display: Files are not saved, butdisplayed in the SAS graphics Window.TXT: CGM files suitable for including inCorel Word perfect and WORDproducts.RTF: JPEG files suitable for including inpower point presentations .3. Input the discriminating GROUP variable name.4. To check for multivariate normality and outlierstype YES in the field 4.5. List all the continues multi-attribute variablesnames.6. Input prior probability option7. To perform non-parametric discriminant analysis,type YES .8. Input any optional ID variable name9. Input the name of the Optional VALID data set.10. Input the folder name to save your SAS output(HTML, RTF, PDF, TXT) files.11. Input the folder name to save your SAS graphicfiles.12. Input the z th number of analysis. Change thevalue of Z by an increment of one when you repeatthe analysis. This avoids over-writing the savedStep 4: Submit the SAS MACRO:After inputting all required fields, moveyour cursor to the last MACRO field, and hit theENTER key to run the SAS MACRO. (Do notclick the RUN icon). The MACRO-CALLwindow file, automatically accesses theDISCRIM SAS MACROs from the Internetserver, College of Agriculture, University ofNevada and provide the users the requiredexploratory graphs, and the results of CDAand PDA analysis in Txt, RTF, HTML, andPDF format.
on discriminant analysis. Canonical Discriminant Analysis (CDA): Canonical DA is a dimension-reduction technique similar to principal component analysis. The main objective of CDA is to extract a set of linear combinations of the quantitative variables that best reveal the differences among the groups. Given a nominal group variable and several .