Transcription
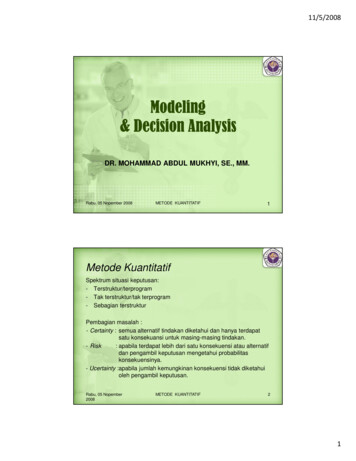
11/5/2008Modeling& Decision AnalysisDR. MOHAMMAD ABDUL MUKHYI, SE., MM.Rabu, 05 Nopember 2008METODE KUANTITATIF1Metode KuantitatifSpektrum situasi keputusan:- Terstruktur/terprogram- Tak terstruktur/tak terprogram- Sebagian terstrukturPembagian masalah :- Certainty : semua alternatif tindakan diketahui dan hanya terdapatsatu konsekuansi untuk masing-masing tindakan.- Risk: apabila terdapat lebih dari satu konsekuensi atau alternatifdan pengambil keputusan mengetahui probabilitaskonsekuensinya.- Ucertainty :apabila jumlah kemungkinan konsekuensi tidak diketahuioleh pengambil keputusan.Rabu, 05 Nopember2008METODE KUANTITATIF21
11/5/2008 We face numerous decisions in life & business. We can use computers to analyze the potentialoutcomes of decision alternatives. Spreadsheets are the tool of choice for today’smanagers.Rabu, 05 Nopember2008METODE KUANTITATIF3What is Management Science? A field of study that uses computers, statistics,and mathematics to solve business problems. Also known as:– Operations research– Decision scienceRabu, 05 Nopember2008METODE KUANTITATIF42
11/5/2008IntroductionWe all face decision about how to uselimited resources such as:– Oil in the earth– Land for dumps– Time– Money– WorkersRabu, 05 Nopember2008METODE KUANTITATIF5Home Runsin Management Science Motorola– Procurement of goods and services accountfor 50% of its costs– Developed an Internet-based auction systemfor negotiations with suppliers– The system optimized multi-product, multivendor contract awards– Benefits: 600 million in savingsRabu, 05 Nopember2008METODE KUANTITATIF63
11/5/2008Home Runsin Management Science Waste Management– Leading waste collection company in North America– 26,000 vehicles service 20 million residential & 2million commercial customers– Developed vehicle routing optimization system– Benefits:Eliminated 1,000 routesAnnual savings of 44 millionRabu, 05 Nopember2008METODE KUANTITATIF7Mathematical ProgrammingMP is a field of management science that finds theoptimal, or most efficient, way of using limitedresources to achieve the objectives of an individualof a business. OptimizationRabu, 05 Nopember2008METODE KUANTITATIF84
11/5/2008Applications of Optimization Determining Product MixManufacturingRouting and LogisticsFinancial PlanningRabu, 05 Nopember2008METODE KUANTITATIF9What is a “Computer Model”? A set of mathematical relationships andlogical assumptions implemented in acomputer as an abstract representation ofa real-world object of phenomenon. Spreadsheets provide the most convenientway for business people to build computermodels.Rabu, 05 Nopember2008METODE KUANTITATIF105
11/5/2008The Modeling Approachto Decision Making Everyone uses models to makedecisions. Types of models:– Mental (arranging furniture)– Visual (blueprints, road maps)– Physical/Scale (aerodynamics, buildings)– Mathematical (what we’ll be studying)Rabu, 05 Nopember2008METODE KUANTITATIF11Characteristics of Models Models are usually simplified versions ofthe things they represent A valid model accurately represents therelevant characteristics of the object ordecision being studiedRabu, 05 Nopember2008METODE KUANTITATIF126
11/5/2008Benefits of Modeling Economy - It is often less costly toanalyze decision problems usingmodels. Timeliness - Models often deliverneeded information more quickly thantheir real-world counterparts. Feasibility - Models can be used to dothings that would be impossible. Models give us insight & understandingthat improves decision making.Rabu, 05 Nopember2008METODE KUANTITATIF13Example of a Mathematical ModelProfit Revenue - ExpensesorProfit f(Revenue, Expenses)orY f(X1, X2)Rabu, 05 Nopember2008METODE KUANTITATIF147
11/5/2008A Generic Mathematical ModelY f(X1, X2, , Xn)Where:Y dependent variable(aka bottom-line performance measure)Xi independent variables (inputs having an impact on Y)f(.) function defining the relationship between the Xi & YRabu, 05 Nopember2008METODE KUANTITATIF15Mathematical Models & Spreadsheets Most spreadsheet models are very similarto our generic mathematical model:Y f(X1, X2, , Xn) Most spreadsheets have input cells(representing Xi) to which mathematicalfunctions ( f(.)) are applied to compute abottom-line performance measure (or Y).Rabu, 05 Nopember2008METODE KUANTITATIF168
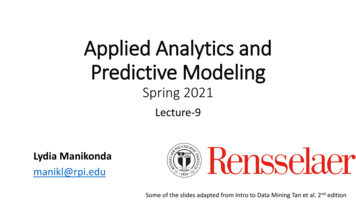
11/5/2008Categories of Mathematical ModelsModelCategoryPrescriptiveForm l-definedknown or underdecision maker’scontrolLP, Networks, IP,CPM, EOQ, NLP,GP, MOLPPredictiveunknown,ill-definedknown or underdecision maker’scontrolRegression Analysis,Time Series Analysis,Discriminant AnalysisDescriptiveknown,well-definedunknown oruncertainSimulation, PERT,Queueing,Inventory ModelsRabu, 05 Nopember2008METODE KUANTITATIF17The Problem Solving ProcessIdentifyProblemFormulate utionunsatisfactoryresultsRabu, 05 Nopember2008METODE KUANTITATIF189
11/5/2008The Psychology of Decision Making Models can be used for structurableaspects of decision problems. Other aspects cannot be structuredeasily, requiring intuition and judgment. Caution: Human judgment and intuitionis not always rational!Rabu, 05 Nopember2008METODE KUANTITATIF19Anchoring Effects Arise when trivial factors influence initialthinking about a problem. Decision-makers usually under-adjustfrom their initial “anchor”. Example:– What is 1x2x3x4x5x6x7x8 ?– What is 8x7x6x5x4x3x2x1 ?Rabu, 05 Nopember2008METODE KUANTITATIF2010
11/5/2008Framing Effects Refers to how decision-makers view aproblem from a win-loss perspective. The way a problem is framed ofteninfluences choices in irrational ways Suppose you’ve been given 1000 andmust choose between:– A. Receive 500 more immediately– B. Flip a coin and receive 1000 more if headsoccurs or 0 more if tails occursRabu, 05 Nopember2008METODE KUANTITATIF21Framing Effects (Example) Now suppose you’ve been given 2000and must choose between:– A. Give back 500 immediately– B. Flip a coin and give back 0 if heads occursor give back 1000 if tails occursRabu, 05 Nopember2008METODE KUANTITATIF2211
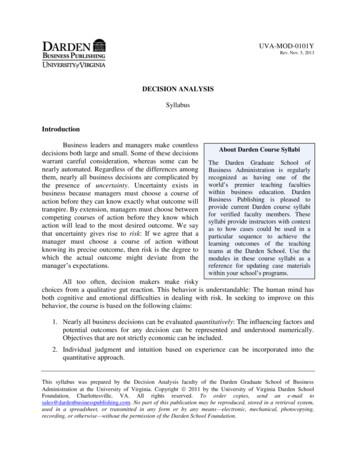
11/5/2008A Decision Tree for Both ExamplesPayoffs 1,500Alternative AInitial stateHeads (50%)Alternative B(Flip coin)Rabu, 05 Nopember2008Tails (50%) 2,000 1,000METODE KUANTITATIF23Good Decisions vs. Good Outcomes Good decisions do not always lead to goodoutcomes. A structured, modeling approach todecision making helps us make gooddecisions, but can’t guarantee goodoutcomes.Rabu, 05 Nopember2008METODE KUANTITATIF2412
11/5/20082. Perumusan PLAda tiga unsur dasar dari PL, ialah:1. Fungsi Tujuan2. Fungsi Pembatas (set ketidak samaan/pembatas strukturis)3. Pembatasan selalu positip.Bentuk umum persoalan PLCari : x1 , x2 , x3 , , xn.Fungsi Tujuan : Z c1x1 c2x2 c3x3 cnxn optimum (max/min)(srs)Fungsi Kendala : a11x1 a12x2 a13x3 a1nxn h1.(F. Pembatas) a21x1 a22x2 a23x3 a2nxn h2.(dp)a31x1 a32x2 a33x3 a3nxn h3. . . . . am1x1 am2x2 am3x3 . amnxn hm.xj 0Rabu, 05 Nopember2008j 1 , 2, 3 n nonnegativity consraintMETODE KUANTITATIF25srs : sedemikian rupa sehinggadp : dengan pembatasada n macam barang yg akan diproduksi masing2 sbesar x1,x2, , xnxj : banyaknya barang yang diproduksi ke j , j 1, 2, 3, . , ncj : harga per satuan barang ke j , j 1, 2, 3, . , nada m macam bahan mentah, masing2 tersedia h1 , h2 , h3 , ., hmhi : banyaknya bahan mentah ke i , i 1, 2, 3, . , maij : banyaknya bahan mentah ke i yg digunakan utk memproduksi 1satuan barang ke jxj 0 , j 1, 2, ,n ; cj tdk boleh neg, paling kecil 0 (nonnegativityconsraint)Maksimumdp h1 artinya, pemakaian input tidak boleh melebihi h1Minimumdp h1 artinya, pemakaian input paling tidak dipenuhi h1Rabu, 05 Nopember2008METODE KUANTITATIF2613
11/5/20083. Langkah-langkah dan teknik pemecahanDasar dari pemecahan PL adalah suatu tindakan yangberulang (Inter-active search) dengan sekelompok carauntuk mencapai suatu hasil optimal. Tidakan dilakukandengan cara sistimatis.Selanjutnya langkah2 dari tindakan berulang adl sebagai:1. Tentukan kemungkinan2 kombinasi yang baik dari sumber daya al-am yang terbatas atau fasilitas yang tersedia, yang disebut se-bagai initial feasible solution.2. Selesaikan persamaan pembatasan strukturil untuk mendapatkan titik2 ekstreem (dis sebagai ‘basic feasiblesolution’).3. Tentukanlah nilai dari titik2 ekstreem yang akan merupakan nilai2 pilihan, yang telah disesuaikan dengan nilaitujuan dari permasalahan.4. Ulanglah langkah 3 hingga tercapai tujuan optimal (hanya satu yang bernilaitertinggi atau terendah).Rabu, 05 NopemberMETODE KUANTITATIF272008Ada 3 (tiga) cara pemecahan PL1. Cara dengan menggunakan grafik2. Cara dengan substitusi (cara matematik/Aljabar)3. Cara simplexRabu, 05 Nopember2008METODE KUANTITATIF2814
11/5/2008General Form of an Optimization ProblemMAX (or MIN): f0(X1, X2, , Xn)Subject to:f1(X1, X2, , Xn) b1:fk(X1, X2, , Xn) bk:fm(X1, X2, , Xn) bmNote: If all the functions in an optimization are linear,the problem is a Linear Programming (LP) problemRabu, 05 Nopember2008METODE KUANTITATIF29Linear Programming (LP) ProblemsMAX (or MIN): c1X1 c2X2 cnXnSubject to:Rabu, 05 Nopember2008a11X1 a12X2 a1nXn b1:ak1X1 ak2X2 aknXn bk:am1X1 am2X2 amnXn bmMETODE KUANTITATIF3015
11/5/2008An Example LP ProblemBlue Ridge Hot Tubs produces two types of hottubs: Aqua-Spas & Hydro-Luxes.PumpsLaborTubingUnit ProfitAqua-Spa19 hours12 feet 350Hydro-Lux16 hours16 feet 300There are 200 pumps, 1566 hours of labor,and 2880 feet of tubing available.Rabu, 05 Nopember2008METODE KUANTITATIF315 Steps In Formulating LP Models:1. Understand the problem.2. Identify the decision variables.X1 number of Aqua-Spas to produceX2 number of Hydro-Luxes to produce3. State the objective function as a linearcombination of the decision variables.MAX: 350X1 300X2Rabu, 05 Nopember2008METODE KUANTITATIF3216
11/5/20085 Steps In Formulating LP Models(continued)4. State the constraints as linear combinationsof the decision variables.} pumps1X1 1X2 2009X1 6X2 1566} labor12X1 16X2 2880 } tubing5. Identify any upper or lower bounds on thedecision variables.X1 0X2 0Rabu, 05 Nopember2008METODE KUANTITATIF33LP Model forBlue Ridge Hot TubsMAX: 350X1 300X2S.T.: 1X1 1X2 2009X1 6X2 156612X1 16X2 2880X1 0X2 0Rabu, 05 Nopember2008METODE KUANTITATIF3417
11/5/2008Solving LP Problems:An Intuitive Approach Idea: Each Aqua-Spa (X1) generates the highest unitprofit ( 350), so let’s make as many of them as possible! How many would that be?– Let X2 0 1st constraint:1X1 200 2nd constraint:9X1 1566 or X1 174 3rd constraint:12X1 2880 or X1 240 If X2 0, the maximum value of X1 is 174 and the totalprofit is 350*174 300*0 60,900 This solution is feasible, but is it optimal? No!Rabu, 05 Nopember2008METODE KUANTITATIF35Solving LP Problems:A Graphical Approach The constraints of an LP problemdefines its feasible region. The best point in the feasible region isthe optimal solution to the problem. For LP problems with 2 variables, it iseasy to plot the feasible region and findthe optimal solution.Rabu, 05 Nopember2008METODE KUANTITATIF3618
11/5/2008Plotting the First ConstraintX2250(0, 200)200boundary line of pump constraintX1 X2 20015010050(200, 0)0050Rabu, 05 Nopember2008100150200250X1METODE KUANTITATIF37Plotting the Second ConstraintX2(0, 261)250boundary line of labor constraint9X1 6X2 156620015010050(174, 0)00Rabu, 05 Nopember200850100150200METODE KUANTITATIF250X13819
11/5/2008Plotting the Third ConstraintX2250(0, 180)200150boundary line of tubing constraint12X1 16X2 2880100Feasible Region50(240, 0)00Rabu, 05 Nopember200850100150200METODE KUANTITATIF250X139Plotting A Level Curve of theObjective FunctionX2250200(0, 116.67)objective function150350X1 300X2 35000100(100, 0)5000Rabu, 05 Nopember200850100150200METODE KUANTITATIF250X14020
11/5/2008A Second Level Curve of theObjective FunctionX2250(0, 175)objective function350X1 300X2 35000200objective function350X1 300X2 52500150100(150, 0)5000Rabu, 05 Nopember200850100150200METODE KUANTITATIF250X141Using A Level Curve to Locatethe Optimal SolutionX2250objective function350X1 300X2 35000200150optimal solution100objective function350X1 300X2 525005000Rabu, 05 Nopember200850100150200METODE KUANTITATIF250X14221
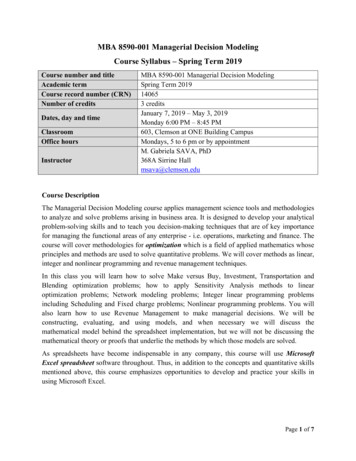
11/5/2008Calculating the Optimal Solution The optimal solution occurs where the “pumps” and“labor” constraints intersect. This occurs where:X1 X2 200(1)and 9X1 6X2 1566(2) From (1) we have, X2 200 -X1(3) Substituting (3) for X2 in (2) we have,9X1 6 (200 -X1) 1566which reduces to X1 122 So the optimal solution is,X1 122, X2 200-X1 78Total Profit 350*122 300*78 66,100Rabu, 05 Nopember2008METODE KUANTITATIF43Enumerating The Corner PointsX2250obj. value 54,000(0, 180)200Note: This technique will not work ifthe solution is unbounded.obj. value 64,000150(80, 120)obj. value 66,100(122, 78)10050obj. value 60,900(174, 0)obj. value 0(0, 0)0050Rabu, 05 Nopember2008100150200METODE KUANTITATIF250X14422
11/5/2008Summary of Graphical Solutionto LP Problems1. Plot the boundary line of each constraint2. Identify the feasible region3. Locate the optimal solution by either:a. Plotting level curvesb. Enumerating the extreme pointsRabu, 05 Nopember2008METODE KUANTITATIF45Special Conditions in LP Models A number of anomalies can occur in LPproblems:– Alternate Optimal Solutions– Redundant Constraints– Unbounded Solutions– InfeasibilityRabu, 05 Nopember2008METODE KUANTITATIF4623
11/5/2008Example of Alternate Optimal SolutionsX2250objective function level curve450X1 300X2 78300200150100alternate optimal solutions500010050Rabu, 05 Nopember2008150200METODE KUANTITATIF250X147Example of a Redundant ConstraintX2250boundary line of tubing constraint200boundary line of pump constraint150boundary line of labor constraint100Feasible Region5000Rabu, 05 Nopember200850100150200METODE KUANTITATIF250X14824
11/5/2008Example of an Unbounded SolutionX21000objective functionX1 X2 600800-X1 2X2 400objective functionX1 X2 800600400200X1 X2 40000Rabu, 05 Nopember2008200400600800METODE KUANTITATIF1000X149Example of InfeasibilityX2250200X1 X2 200feasible region forsecond constraint150100feasible regionfor firstconstraint50X1 X2 15000Rabu, 05 Nopember200850100150200METODE KUANTITATIF250X15025
Predictive unknown, known or under Regression Analysis, ill-defined decision maker's Time Series Analysis, control Discriminant Analysis Descriptive known, unknown or Simulation, PERT, well-defined uncertain Queueing, Inventory Models Model Independent OR/MS Category Form of f(.) Variables Techniques Rabu, 05 Nopember 2008 METODE KUANTITATIF 17