Transcription
NOT FDIC INSURED NO BANK GUARANTEE MAY LOSE VALUEJPMorgan Funds statistics report:U.S. Large Cap Core Plus FundData as of March 31, 2022jpmorganfunds.com
Table of contentsATTRIBUTIONPERFORMANCEPerformance at NAV3Performance attribution - One month12Calendar year returns3Performance attribution - Quarter13Performance attribution - YTD14Performance attribution - One year15Performance attribution - Three year16EXPENSESAnnual expenses4CHARACTERISTICSFund statistics5Stock attribution - One month17Percentage of portfolio5Stock attribution - Quarter17Barra factors5Stock attribution - YTD18Number of stocks5Stock attribution - One year18Net percent of portfolio by quintile5Stock attribution - Three year19COUNTRY EXPOSURERISKRisk measures6RATINGS AND RANKINGSAsset allocation20Regional allocation20Lipper rankings7DISCLOSUREMorningstar ratings7DisclosuresHOLDINGSTop ten holdings (%)8Ten largest overweights9Top buys and sells9SECTORSSector exposure (excluding cash)10Gross long-short exposures by sector112 STATISTICS REPORT: U.S. LARGE CAP CORE PLUS FUND21
PerformanceData as of March 31, 2022AVERAGE ANNUAL TOTAL RETURNS(as of 3/31/2022)1 month(%)3 months(%)YTD(%)1 yr(%)3 yrs(%)5 yrs(%)10 yrs(%)A Shares - 11/1/2005 1000with max 5.25% sales 618.0215.4814.2414.4113.80C Shares - 11/1/2005 1001with max 1.00% 5714.9114.9113.9613.96I Shares - 11/1/2005 10021.58-6.59-6.5913.9420.4815.7714.70R2 Shares - 11/3/2008 10331.52-6.71-6.7113.2319.7515.0914.08R5 Shares - 5/15/2006 20001.56-6.56-6.5613.9820.5315.8514.85R6 Shares - 11/1/2017 273711.52-6.60-6.6014.0820.6315.9414.90S&P 500 Index3.71-4.60-4.6015.6518.9215.9914.64Share class - inception date share class #The performance quoted is past performance and is not a guarantee of future results. Mutual funds are subject to certain market risks. Investment returns and principal value of an investment will fluctuate so that aninvestor's shares, when redeemed, may be worth more or less than original cost. Current performance may be higher or lower than the performance data shown. For performance current to the most recent month-end, pleasecall 1-800-480-4111.Calendar year returns2012201320142015201620172018201920202021A Shares - 11/1/2005 .89C Shares - 11/1/2005 .25I Shares - 11/1/2005 .20R2 Shares - 11/3/2008 .40R5 Shares - 5/15/2006 .23R6 Shares - 11/1/2017 .41S&P 500 8.713 STATISTICS REPORT: U.S. LARGE CAP CORE PLUS FUND
ExpensesData as of March 31, 2022Annual expenses*A SharesGross expense (%)2.09Net expense (%)1.94*Net expenses may include short dividend expense. See prospectus for details.4 STATISTICS REPORT: U.S. LARGE CAP CORE PLUS FUNDC Shares2.582.44I Shares1.831.69R2 Shares2.342.29R5 Shares1.681.64R6 Shares1.581.54
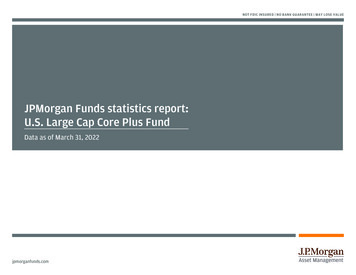
CharacteristicsData as of March 31, 2022Fund statisticsActive share (%)Earnings per share growth - 2 yrEarnings per share growth - 5 yrLong position percent net assetsMarket cap median ( billions)Market cap weighted average ( billions)Market cap weighted median ( billions)Price to book weighted harmonic averagePrice to cash flow - trailing 12 monthsPrice to earnings - next 12 months *Price to sales weighted harmonic averageReturn on assets - last 12 monthsReturn on equity - hist 1 yrShort position percent net assets*J.P. Morgan estimateBarra factorsFund72.5728.8222.17122.6 40.82 629.40 169.545.2625.4421.974.4114.2725.22-22.423.3019.02 32.36 647.25 207.394.3019.4219.972.8512.5827.52Percentage of portfolio**StocksUSOut of IndexNon US SecuritiesIntl/ADR (by country)DerivativesETFsCash**Cash includes money market securities5 STATISTICS REPORT: U.S. LARGE CAP CORE PLUS 00.000.74MomentumDividend YieldSizeProfitEarnings YieldLiquidityValueLeverageBetaResidual VolatilityGrowthEarnings QualityNumber of stocksFund16076 bps110-21 bps270Number of long positionsAverage long weightNumber of short positionsAverage short weightTotalNet percent of portfolio by quintileQuintile 1Quintile 2Quintile 3Quintile 4Quintile .000.06-0.13-0.06-0.14-0.070.18-0.060.15-0.01
RiskData as of March 31, 2022Risk measures*Excess return - 1 YrExcess return - 3 YrExcess return - 5 YrExcess return - 7 YrExcess return - Since InceptionInformation ratio - 1 YrInformation ratio - 3 YrInformation ratio - 5 YrInformation ratio - 7 YrInformation ratio - Since InceptionR2 - 1 YrR2 - 3 YrR2 - 5 YrR2 - 7 YrR2 - Since InceptionSharpe ratio - 1 YrSharpe ratio - 3 YrSharpe ratio - 5 YrSharpe ratio - 7 YrSharpe ratio - Since InceptionStandard deviation - 1 YrStandard deviation - 3 YrStandard deviation - 5 YrStandard deviation - 7 YrStandard deviation - Since InceptionTracking error - 1 YrTracking error - 3 YrTracking error - 5 YrTracking error - 7 YrTracking error - Since Inception*Based on gross of fees6 STATISTICS REPORT: U.S. LARGE CAP CORE PLUS 016.5315.6515.643.303.022.783.282.91
Ratings and rankingsData as of March 31, 2022Lipper rankingsCategory: Alternative Act Extension FdsACIR2R5R61 /13)3 11)5 Years34(3/8)56(5/8)23(2/8)45(4/8)12(1/8)10 Years45(4/8)67(6/8)23(2/8)56(5/8)12(1/8)The ranking information is provided by Lipper Analytical Services. Past performance is no guarantee of future results. Rankings are calculated based upon the totalreturns of multiple share classes within their respective Lipper category. Different share classes may have different rankings.Morningstar ratingsCategory: Large BlendACIR2R5R6Overall /1232 /1232 /1232 /1232 /1232 /12323-Year /1232 /1232 /1232 /1232 /1232 /12325-Year /1116 /1116 /1116 /1116 /1116Not yet rated10-Year /818 /818 /818 /818 /818Not yet ratedThe Overall Morningstar Rating for a fund is derived from a weighted average of the performance figures associated with its three-, five-, and 10-year (if applicable)Morningstar Rating metrics. Different share classes may have different ratings.7 STATISTICS REPORT: U.S. LARGE CAP CORE PLUS FUND
HoldingsData as of March 31, 2022Top ten holdings (%)Company NameMicrosoftAmazon.ComAppleAlphabet Inc Cl-CMastercardNxp Semiconductors N VUnitedHealthAbbVieWells FargoDeere8 STATISTICS REPORT: U.S. LARGE CAP CORE PLUS FUNDPortfolio tive chmark Weight6.043.737.074.210.810.131.250.750.490.30
HoldingsData as of March 31, 2022Ten largest overweightsCompany NameNxp Semiconductors N VMastercardAmazon.ComDeereUnitedHealthWells FargoConocoPhillipsNorfolk SouthernAbbVieO'Reilly AutomotiveTop buys and sellsRelative Weight (%)3.002.442.171.661.541.531.511.421.391.389 STATISTICS REPORT: U.S. LARGE CAP CORE PLUS FUNDTen largest buysExelonAmerican ExpressExxon MobilAmerenProgressiveOtis WorldwideMartin Marietta MaterialsChipotle Mexican GrillCoupa SoftwareExpediaTen largest sellsAppleStanley Black & DeckerMicrosoftMorgan StanleyCelaneseBookingAlphabetHome DepotAmazon.ComEdison International
SectorsData as of March 31, 2022Sector exposure (excluding cash)Auto & TransportsBasic MaterialsBig Banks & BrokersConsumer CyclicalConsumer StableEnergyFinancial ServicesHealth Services & SystemsIndustrial CyclicalInsuranceMediaPharm/ MedTechREITsRetailSemi & HardwareSoftware & ServicesTelecomUtilitiesTotal10 STATISTICS REPORT: U.S. LARGE CAP CORE PLUS .542.645.6914.399.981.972.74100.00
SectorsData as of March 31, 2022Gross long-short exposures by sectorSectorAuto & TransportationBasic MaterialsBig Banks & BrokersConsumer CyclicalConsumer StableEnergyFinancial ServicesHealth Services & SystemIndustrial CyclicalInsuranceMediaPharm/MedTechREITsRetailSemi & HardwareSoftware & 3-1.5411 STATISTICS REPORT: U.S. LARGE CAP CORE PLUS FUND
AttributionData as of March 31, 2022Performance attribution - One monthOne monthPharm/ MedTechConsumer StableHealth Services & SystemsConsumer CyclicalTelecomInsuranceSoftware & ServicesUtilitiesREITsMediaEnergyBasic MaterialsIndustrial CyclicalFinancial ServicesBig Banks & BrokersSemi & HardwareAuto & 4.083.226.80100.00IndexTotal 001.811.13-1.21-6.801.511.83-5.121.6912 STATISTICS REPORT: U.S. LARGE CAP CORE PLUS al ingTotal 80Total -0.14-0.14-0.15-0.19-0.20-0.37-0.43-0.52-2.02
AttributionData as of March 31, 2022Performance attribution - QuarterQuarterPharm/ MedTechBig Banks & BrokersHealth Services & SystemsEnergyMediaConsumer StableConsumer CyclicalInsuranceTelecomREITsFinancial ServicesUtilitiesSoftware & ServicesAuto & TransportsIndustrial CyclicalBasic MaterialsSemi & 114.086.80100.00IndexTotal -6.3413 STATISTICS REPORT: U.S. LARGE CAP CORE PLUS al ariationEndingTotal -1.53Total -0.10-0.15-0.17-0.34-0.39-0.40-0.59-0.67-1.73
AttributionData as of March 31, 2022Performance attribution - YTDYTDPharm/ MedTechBig Banks & BrokersHealth Services & SystemsEnergyMediaConsumer StableConsumer CyclicalInsuranceTelecomREITsFinancial ServicesUtilitiesSoftware & ServicesAuto & TransportsIndustrial CyclicalBasic MaterialsSemi & 1814.137.65100.00IndexTotal -6.3414 STATISTICS REPORT: U.S. LARGE CAP CORE PLUS otal ariationAverageTotal 53-1.53Total -0.10-0.15-0.17-0.34-0.39-0.40-0.59-0.67-1.73
AttributionData as of March 31, 2022Performance attribution - One year1 YearBig Banks & BrokersEnergyPharm/ MedTechConsumer StableTelecomInsuranceMediaHealth Services & SystemsSoftware & ServicesIndustrial CyclicalREITsUtilitiesConsumer CyclicalSemi & HardwareRetailBasic MaterialsAuto & TransportsFinancial 65.42100.00IndexTotal 7.9525.6314.80-9.7830.255.494.94-0.43-23.1315.4515 STATISTICS REPORT: U.S. LARGE CAP CORE PLUS otal iationAverageTotal 330.27Total 10-0.10-0.19-0.26-0.39-0.42-1.21-1.36-0.19
AttributionData as of March 31, 2022Performance attribution - Three year3 yearSemi & HardwareBig Banks & BrokersEnergyTelecomInsuranceMediaSoftware & ServicesREITsConsumer StablePharm/ MedTechUtilitiesRegionalsIndustrial CyclicalConsumer CyclicalHealth Services & SystemsFinancial ServicesBasic MaterialsRetailAuto & 3.416.962.90100.00IndexTotal 36.8981.9416 STATISTICS REPORT: U.S. LARGE CAP CORE PLUS 00Total .3268.14VariationAverageTotal -0.56-0.91-1.28-1.4513.12Total 0.390.12-0.08-0.19-0.50-1.13-1.51-1.6213.81
AttributionData as of March 31, 2022AverageRelativeEnd omm*-0.37-0.81-0.360.13Walt Disney*0.00-0.650.000.08Eli Lilly1.581.011.600.08O'Reilly 06Baxter International*-0.31-0.39-0.290.06Home al Electric*-0.39-0.63-0.370.05*Indicates stock underweight or not held during part or all of the analysis period.AverageRelativeEnd oger*-0.80-0.82-0.72-0.20Nxp Semiconductors N V3.223.003.13-0.20Rivan Automotive0.290.280.28-0.18Burlington Stores0.610.550.55-0.15Advanced Micro Devices1.290.751.21-0.13Diamondback ey Black & Decker0.53-0.060.00-0.11Seagate Technology Hldn0.670.580.63-0.11*Indicates stock underweight or not held during part or all of the analysis period.AverageRelativeEnd 2.175.900.18O'Reilly 6Home ndicates stock underweight or not held during part or all of the analysis period.AverageRelativeEnd WeightImpactWeightWeightNxp Semiconductors N 0.80-0.82-0.72-0.34Rivan Automotive0.430.280.28-0.33Ingersoll Rand1.320.951.00-0.27Berkshire Hathaway*0.00-1.690.00-0.24Trane Technologies Plc0.910.810.90-0.23Ceridian HCM0.730.640.67-0.22Stanley Black & Decker0.87-0.060.00-0.21Burlington Stores0.640.550.55-0.19*Indicates stock underweight or not held during part or all of the analysis period.Contributors - One monthContributors - Quarter17 STATISTICS REPORT: U.S. LARGE CAP CORE PLUS FUNDDetractors - One monthDetractors - Quarter
AttributionData as of March 31, 2022AverageRelativeEnd 2.095.900.18O'Reilly 6Home ndicates stock underweight or not held during part or all of the analysis period.AverageRelativeEnd WeightImpactWeightWeightNxp Semiconductors N 0.80-0.89-0.72-0.34Rivan Automotive0.430.430.28-0.33Ingersoll Rand1.321.261.00-0.27Berkshire Hathaway*0.00-1.560.00-0.24Trane Technologies Plc0.910.800.90-0.23Ceridian HCM0.730.700.67-0.22Stanley Black & Decker0.870.790.00-0.21Burlington Stores0.640.640.55-0.19*Indicates stock underweight or not held during part or all of the analysis period.AverageRelativeEnd bbVie1.591.012.140.41Alphabet Inc Cl-C5.391.225.030.41Walt 36O'Reilly amondback Energy1.311.271.380.28Eli Lilly1.400.901.600.27Wells Fargo1.931.402.020.26*Indicates stock underweight or not held during part or all of the analysis period.AverageRelativeEnd WeightImpactWeightWeightNxp Semiconductors N 0.470.31-0.49AMC .00-0.49Stanley Black & Ceridian HCM0.900.890.67-0.42Berkshire Hathaway*0.00-1.460.00-0.40Norfolk Southern1.771.591.60-0.39*Indicates stock underweight or not held during part or all of the analysis period.Contributors - YTDContributors - One Year18 STATISTICS REPORT: U.S. LARGE CAP CORE PLUS FUNDDetractors - YTDDetractors - One Year
AttributionData as of March 31, 2022AverageRelativeEnd WeightImpactWeightWeightCisco bVie1.350.812.141.16Eli .45-0.79-0.650.79Alphabet Inc Cl-C4.921.405.030.75Advanced Micro Devices0.970.691.210.74*Indicates stock underweight or not held during part or all of the analysis period.Contributors - Three Year19 STATISTICS REPORT: U.S. LARGE CAP CORE PLUS FUNDAverageRelativeEnd WeightImpactWeightWeightDuPont de Nemours0.740.580.33-1.08Nxp Semiconductors N fy0.170.170.31-0.78AMC Entertainment*-0.07-0.07-0.16-0.77Automatic Data Processing0.500.250.49-0.75Ceridian HCM0.480.480.67-0.74Stanley Black & Decker1.081.000.00-0.65Lyft0.690.691.05-0.64Zimmer Biomet1.241.140.58-0.61*Indicates stock underweight or not held during part or all of the analysis period.Detractors - Three Year
Country exposureData as of March 31, 2022Asset allocationDomestic EquityInternational EquityOtherTotalRegional allocationFund (%)94.304.960.74100.0020 STATISTICS REPORT: U.S. LARGE CAP CORE PLUS FUNDIndex (%)97.792.210.00100.00United StatesNetherlandsUnited 0.00
RISKS ASSOCIATED WITH INVESTING IN THE FUND:The price of equity securities may fluctuate rapidly or unpredictably due to factors affecting individual companies, as well as changes in economic or political conditions. These price movements may result in loss of your investment.There is no guarantee that the use of long and short positions will succeed in limiting a portfolio’s exposure to domestic stock market movements, capitalization, sector-swings or other risk factors. Investments in a portfolio involvedin long and short selling may have higher portfolio turnover rates. This will likely result in additional tax consequences. Short selling involves certain risks, including additional costs associated with covering short positions and apossibility of unlimited loss on certain short sale positions.RETURNS:1The quoted performance of the Fund includes performance of a predecessor fund/share class prior to the Fund's commencement of operations. Please refer to the current prospectus for further information.ANNUAL OPERATING EXPENSES:The Fund’s adviser and/or its affiliates have contractually agreed to waive fees and/or reimburse expenses to the extent Total Annual Fund Operating Expenses (excluding acquired fund fees and expenses, dividend and interestexpenses related to short sales, interest, taxes, expenses related to litigation and potential litigation and extraordinary expenses) exceed 1.10% for A Shares, 0.80% for R5 Shares, 0.70% for R6 Shares, 1.60% for C Shares, 0.85% for IShares and 1.45% for R2 Shares of the average daily net assets. The Fund may invest in one or more money market funds advised by the adviser or its affiliates (affiliated money market funds). The Fund’s adviser has contractuallyagreed to waive fees and/or reimburse expenses in an amount sufficient to offset the fees and expenses of the affiliated money market funds incurred by the Fund because of the Fund’s investment in such money market funds. Thiswaiver is in effect through 10/31/2022 for A Shares, 10/31/2022 for R5 Shares, 10/31/2022 for R6 Shares, 10/31/2022 for C Shares, 10/31/2022 for I Shares and 10/31/2022 for R2 Shares, at which time the adviser and/or its affiliateswill determine whether to renew or revise it. The difference between net and gross fees includes all applicable fee waivers and expense reimbursements.PORTFOLIO STATISTICS:Active Share represents the difference between a fund’s holdings and the benchmark’s holdings. It is calculated by taking the sum of the absolute value of the weighting of the fund’s holdings versus the weighting of the benchmark’sholdings excluding derivatives but including cash and cash equivalents. If a holding of the fund isn’t a holding of the benchmark, the weighting of the benchmark is assumed to be zero. Similarly, if the benchmark includes a holdingthat isn’t a holding of the fund, the weighting of the fund is assumed to be zero.Currency Sensitivity: This risk index measures the sensitivity of a company’s stock return to the return on a basket of foreign currencies.Debt to Equity: A debt ratio used to measure a company's financial leverage, calculated by dividing a company’s total liabilities by its stockholders' equity. The Debt to Equity ratio indicates how much debt a company is using tofinance its assets relative to the amount of value represented in shareholders’ equity.Earnings Variability: This risk index measures the variability in earnings and cash flows using both historical measures and analyst predictions.Growth: This risk index uses historical growth and profitability measures to predict future earnings growth.Leverage: This risk index measures the financial leverage of a company.Momentum: This risk index captures common variation in returns related to recent stock price behaviour. Stocks that had positive excess returns in the recent past are grouped separately from those that displayed negative excessreturns.P/B ratio: the relationship between a stock's price and the book value of that stock.Price to Cash Flow: The ratio of a stock’s price to its cash flow per share. The price-to-cash-flow ratio is an indicator of a stock’s valuation. Although there is no single figure to indicate an optimal price-to-cash-flow ratio, a ratio in thelow single digits may indicate the stock is undervalued, while a higher ratio may suggest potential overvaluation. The ratio takes into consideration a stock’s operating cash flow, which adds non-cash earnings such as depreciation andamortization to net income. It is especially useful for valuing stocks that have positive cash flow but are not profitable because of large non-cash charges.P/E ratio: the number by which earnings per share is multiplied to estimate a stock's value.Price to Sales: A valuation ratio that compares a company’s stock price to its revenues. The price-to-sales ratio is an indicator of the value placed on each dollar of a company’s sales or revenues. It can be calculated either by dividingthe company’s market capitalization by its total sales over a 12-month period, or on a per-share basis by dividing the stock price by sales per share for a 12-month period. Like all ratios, the price-to-sales ratio is most relevant whenused to compare companies in the same sector. A low ratio may indicate possible undervaluation, while a ratio that is significantly above the average may suggest overvaluation. This ratio is also known as a “sales multiple” or“revenue multiple”.Turnover ratio: High portfolio turnover will likely result in additional tax consequences.Return on Assets: An indicator of how profitable a company is relative to its total assets. ROA gives an idea as to how efficient management is at using its assets to generate earnings. Calculated by dividing a company's annualearnings by its total assets, ROA is displayed as a percentage.Return on Equity (ROE): Return on Equity is the amount of net income returned as a percentage of shareholders equity. ROE measures a corporation's profitability by revealing how much profit a company generates with the moneyshareholders have invested.Size: This risk index captures differences in stock returns due to differences in the market capitalization of companies.Value: This risk index distinguishes between value stocks and growth stocks using the ratio of book value of equity to market capitalizationHOLDINGS:The top 10 holdings listed exclude cash and money markets. Holdings are subject to change. The holdings listed should not be considered recommendations to purchase or sell a particular security. Each individual security iscalculated as a percentage of the aggregate market value of the securities held in the Fund and does not include the use of derivative positions, where applicable.21 STATISTICS REPORT: U.S. LARGE CAP CORE PLUS FUND
MORNINGSTAR AND LIPPER:The Morningstar RatingTM for funds, or "star rating", is calculated for managed products (including mutual funds, variable annuity and variable life subaccounts, exchange-traded funds, closed-end funds, and separate accounts) withat least a three-year history. Exchange traded funds and open-ended mutual funds are considered a single population for comparative purposes. It is calculated based on a Morningstar Risk-Adjusted Return measure that accounts forvariation in a managed product's monthly excess performance, placing more emphasis on downward variations and rewarding consistent performance. The top 10% of products in each product category receive 5 stars, the next22.5% receive 4 stars, the next 35% receive 3 stars, the next 22.5% receive 2 stars, and the bottom 10% receive 1 star. The Overall Morningstar Rating for a managed product is derived from a weighted average of the performancefigures associated with its three-, five-, and 10-year (if applicable) Morningstar Rating metrics. The weights are: 100% three-year rating for 36-59 months of total returns, 60% five-year rating/40% three-year rating for 60-119months of total returns, and 50% 10- year rating/30% five-year rating/20% three-year rating for 120 or more months of total returns. While the 10-year overall star rating formula seems to give the most weight to the 10-year period,the most recent three-year period actually has the greatest impact because it is included in all three rating periods.Rankings do not take sales loads into account.The ranking information is provided by Lipper Analytical Services. Past performance is no guarantee of future results. Rankings are calculated based upon the total returns of multiple share classes within their respectiveLipper category. Different share classes may have different rankings.INDEXES DEFINED:Mutual funds have fees that reduce their performance: indexes do not. You cannot invest directly in an index.The S&P 500 Index is an unmanaged index generally representative of the performance of large companies in the U.S. stock market. Index levels are in total return USD.RISK MEASURES:Information ratio: A risk-adjusted performance measure defined as excess return divided by tracking error. Information ratio is a special version of the Sharpe Ratio where the benchmark does not have to be the risk-free rate. Sincethis ratio considers the annualized standard deviation of both series (measures of risks inherent in owning either a portfolio or the benchmark),the ratio shows the risk-adjusted
Value 13 4-0. 9 L iqu d ty 3 1- 0. 2 Ear n igs Y eld 7 3- 0. 1 Prof t 7 60. 1 Size 8 31 -0.2 D v den Y l 27 6-0. 3 Mo mntu 13 40. 8 Fund Benchmark Net Number of stocks Total 281 Average short weight -19 bps Number of short positions 113 Average long weight 72 bps Number of long positions 168 Fund Net percent of portfolio by quintile Other 1.15 6.62