Transcription
VMware Validated Design for Cloud Providers: Scale and Performance 2019 VMware, Inc. All rights reserved. This product is protected by U.S. and international copyright andintellectual property laws. This product is covered by one or more patents listed re is a registered trademark or trademark of VMware, Inc. in the United States and/or otherjurisdictions. All other marks and names mentioned herein may be trademarks of their respectivecompanies.VMware, Inc.3401 Hillview AvePalo Alto, CA 94304www.vmware.com2 VMware Validated Design for Cloud Providers: Scale and Performance
VMware Validated Design for Cloud Providers: Scale and PerformanceContentsIntroduction . 51.1 Audience . 51.2 Scope . 5Interoperability Stack (Bill of Materials) . 7Scale and Performance . 82.1 Performance Characteristics . 9Sizing Guidelines . 113.1 vCloud Director Virtual Appliance . 113.2 Management and Resource Component Sizing . 12Appendix A – Test Environment and Benchmarking Methods . 16Test Environment . 16Management Cluster . 16Resource Cluster. 18PostgreSQL Tuning. 21Test Driver . 21Benchmarking Methods . 21Scale Test . 21Performance Test . 21Uptime Tests. 22List of Operations . 22Appendix B – FAQ . 243 VMware Validated Design for Cloud Providers: Scale and Performance
VMware Validated Design for Cloud Providers: Scale and PerformanceList of TablesTable 1. Bill of Materials . 7Table 2. Scale Profile B . 8Table 3. Performance and Throughput . 9Table 4. API Operations Latency . 9Table 5. OVF Upload and Download Times . 10Table 6. Time to Protect a VM . 10Table 7. Network Latency Impact on Time to Protect (VM size 100 GB) . 11Table 8. Management and Resource Component Sizing . 12Table 9. vCloud Director Operations (Part 1) . 22Table 10. vCloud Director Operations (Part 2) . 23List of FiguresFigure 1. Management Component Deployment . 17Figure 2. Management Cluster Networking. 18Figure 3. Resource Cluster Setup . 19Figure 4. Resource Cluster Networking . 204 VMware Validated Design for Cloud Providers: Scale and Performance
VMware Validated Design for Cloud Providers: Scale and PerformanceIntroductionThe VMware Validated Designs (VVD) for Cloud Providers: Scale and Performance Guidelines (Scaleand Performance) is an evolution of Certified Reference Design for VMware Cloud Providers . It is apre-validated set of software components that simplify the deployment of a VMware vCloud Director based multitenant cloud in a predictable and efficient manner. The intent of the Scale and Performanceinitiative is to document a verified stack and provide scale and performance benchmarking. It also helpsreduce the complexity of figuring out dependencies between the VMware components required for avCloud Director-based service. While this initiative does not yet involve software automation for softwareupgrades, it aims to present clearly what components are needed, which versions must be used, andwhat kind of scale and performance VMware Cloud Providers can expect.VMware Cloud Providers get clarity and predictability about which version of each software component ofthe stack is recommended at a given time. Each Scale and Performance version also includes apredictable support timeframe for all underlying components, typically 12 – 18 months from the launch ofthe corresponding Scale and Performance release. This reduces the expense and time involved indetermining what components to upgrade when and to which version, so that the entire software stackstays in support and incompatible combinations are avoided.VMware Cloud Providers also benefit from clear guidelines for sizing hardware and software componentsto match their expected tenant load. While the Scale and Performance does not cover every cloudconfiguration and size, it provides a sizing recommendation for a “typical” cloud (a cloud sizerepresentative of a broad set of VMware Cloud Providers). Future versions of the Scale and Performancemay address larger and less common environment configurations as well as more specialized use cases.It is not the current intent of Scale and Performance to push vCloud Director to its absolute limits. Forconfiguration maximums and limits, see VMware vCloud Director Configuration Maximums.This document also includes the expected performance as observed by tenant users and VMware CloudProvider administrators interacting with the vCloud Director user interface and API.A vCloud Director-based platform can be properly sized by following the sizing guidelines for hardwareand scale based on anticipated tenant demand.1.1 AudienceThis document is intended for VMware Cloud Provider architects and technical leads responsible forplanning and executing the deployment and upgrades of a VMware-based cloud environment.1.2 ScopeThis document addresses the following aspects: Interoperability stackProvides a list of certified versions of all the component software comprising the software stack.Using the recommended versions guarantees known support life of the stack as well as performancecharacteristics. Sizing guidelines and software requirements Performance characteristics of the solutionThe certified solution stack provides known performance and scale characteristics and includesrecommendations and guidelines for hardware and scale based on anticipated tenant demand.5 VMware Validated Design for Cloud Providers: Scale and Performance
VMware Validated Design for Cloud Providers: Scale and PerformanceSee the complimentary documents that are part of the VMware vCloud Architecture Toolkit for ServiceProviders: Architecting a VMware vCloud Director Solution for VMware Cloud Providers Architecting Tenant Networking with VMware NSX in VMware vCloud Director Developing a Hyper-Converged Storage Strategy for VMware vCloud Director with VMware vSAN VMware vCloud Director Configuration MaximumsThe VMware Product Interoperability Matrices is the authoritative resource for interoperability betweenthe VMware software components.A compliant solution must comply with all relevant security guidelines outlined in the product-specificdocumentation as well as security recommendations in the VMware vCloud Architecture Toolkit forService Providers document.6 VMware Validated Design for Cloud Providers: Scale and Performance
VMware Validated Design for Cloud Providers: Scale and PerformanceInteroperability Stack (Bill of Materials)The Bill of Materials table lists the pre-validated set of software components for Cloud Providers at thetime of the Scale and Performance launch. While VMware Cloud Providers are free to choose and pickother versions or different combinations of VMware Cloud Provider Program software products, thespecified stack guarantees a known predictable support time and specific performance and scalingcharacteristics. Performance and scaling information is provided later this document. Products marked“Core” are required to officially achieve VVD for Cloud Providers compliance.Table 1. Bill of MaterialsComponentVersion andBuildCore/ OptionalNotesVMware vCenter Server 6.7 Update 3CoreSee Table 8 for patchlevel tested.VMware ESXi 6.7 Update 3CoreSee Table 8 for patchlevel tested.VMware NSX-V6.4.6CoreSee Table 8 for patchlevel tested.VMware vSAN6.7 Update 3CoreSee Note 2vCloud Director10CorevCloud Availability3.5OptionalContainer Service2.5.1OptionalVMware vRealize LogInsight 8.0OptionalVMware vRealize NetworkInsight 5.0OptionalApply the latestavailable patch.VMware vRealize Orchestrator 7.6OptionalApply the latestavailable patch.VMware vCloud Usage Meter3.6.1 Hot Patch 3CoreVMware vRealize Operations 8.0OptionalNote10.0.0.1 VirtualAppliance with anembedded database.Container ServicesExtensionApply the latestavailable patch.1. These are the recommended set of products, but this is not a full interoperability matrix. Forexample, vCloud Director 10 is supported with multiple versions of NSX but in the currentbenchmarking we used a specific NSX version. Test results generally apply to all patches within7 VMware Validated Design for Cloud Providers: Scale and Performance
VMware Validated Design for Cloud Providers: Scale and Performancethe specified major version of each component. See the VMware Product Interoperability Matrixfor full vCloud Director interoperability information.2. vSAN-based storage must be deployed in at least one cluster (either management or capacity).Scale and PerformanceThe Scale Profile B table represents a common environment similar to the environments of approximately60% of all VMware Cloud Providers. While vCloud Director is capable of a larger scale, the followingprofile is what is validated and benchmarked in the current Scale and Performance.Table 2. Scale Profile BParameterValueNumber of tenants (Organizations in vCloud Director)400Number of powered-on tenant virtual machines (with an OSinstalled)10,000Number of data centers1Number of vCloud Director cells4Number of vCenter Server instances managed by vCloud Director1 vCenter Server for managementcluster3 vCenter Server instances forresource capacityNumber of hosts and clusters3 resource capacity clusters, 33hosts total1 management cluster; 5 hostsMaximum network latency from vCloud Director to VMwarevCenter Server, VMware NSX Manager , and ESXi hostsNetwork RTT latency up to 150 msConcurrent API operationsUp to 128 concurrent usersexecuting operations against thevCloud Director APIConcurrent virtual machine migrations to vCloud Director fromtenant environments by vCloud Availability1008 VMware Validated Design for Cloud Providers: Scale and Performance
VMware Validated Design for Cloud Providers: Scale and Performance2.1 Performance Characteristics2.2.1 Environment SetupThe multitenant cloud environment is set up based on Scale Profile B.Testing is performed at different levels of network latency from vCloud Director cells to vCenter Serverand NSX Manager to measure the impact of network latency on performance.2.2.2 Performance and ThroughputThe test throughput is measured as the number of operations executed over 30 minutes. The test wasrun with different test concurrency (32, 64, and 128) and network latency (0.3 ms, 40 ms, and 150 ms).During this test, a representative random sample of operations from the List of Operations is used.Table 3. Performance and ThroughputConcurrency(Number ofconcurrentusers)Throughput at RTT 0.3 msThroughput at RTT 40 msThroughput at RTT 150 ms(Successfullycompleted operationsper minute)3212410172642131701371283192892292.2.3 API LatencyThe API Operations Latency table shows average user observed latency (in seconds) for a selection ofAPI operations at RTT 0.3 ms. See theResultsTotal Operations completed: 1341318Average test throughput over 5 days: 186 Ops/minTotal failures over 5 days: 59Failure rate over 5 days: 0.004%Success rate: 99.996%List of Operations for the full list of operations invoked during this test.Table 4. API Operations LatencyOperationConcurrency (seconds)9 VMware Validated Design for Cloud Providers: Scale and Performance
VMware Validated Design for Cloud Providers: Scale and Performance3264128Instantiate 150 MB vApp from a template28 s35 s52 sCreate edge gateway45 s51 s65 sCreate an independent disk13 s16 s25 sIncreasing network RTT from 0.3 ms to 150 ms affects these numbers with the size of the effect varyingsignificantly depending on the operation. With most API operations RTT increase from 0.3 ms to 150 mscaused the latency to increase by a factor of 2 or less.2.2.4 Upload and Download PerformanceThe OVF upload and download times observed in the test environment vary depending on the differentnetwork latencies.Table 5. OVF Upload and Download TimesRTT 0.3 msRTT 40 msRTT 150 msOVF upload time inseconds (4 GB)359388392OVF download timein seconds (4 GB)2322352452.2.5 vCloud AvailabilityThe Time to Protect a virtual machine in vCloud Availability represents the time to establish replication ofvirtual machines of various sizes between a vCloud Director and a disaster recovery target vCenterServer environment using vCloud Availability. 10 GB uplinks were configured between vCenter Serverand vCloud Director. Network throughput was stable around 710 Mbps.Table 6. Time to Protect a VMVM sizeTime to Protect1 GB29 sec10 GB2 min100 GB27 min500 GB1 hr: 58 min1 TB3 hr: 55 min10 VMware Validated Design for Cloud Providers: Scale and Performance
VMware Validated Design for Cloud Providers: Scale and PerformanceThe Network Latency Impact on Migration Performance table displays how the network latency betweenvCenter Server and vCloud Director impacts cold migration for virtual machines of 100 GB size.Table 7. Network Latency Impact on Time to Protect (VM size 100 GB)RTT Latency betweenvCenter Server andvCloud DirectorTime to Protect0.3 ms27 min40 ms29 min150 ms33 minSizing GuidelinesMany environment variables influence the number of hosts and CPU and memory resources required torun a cloud service based on VVD for Cloud Providers. It is impossible to give a precise formula for howmuch of each resource is required. The current effort focuses on demonstrating how our deploymentsetup behaves in terms of scale and performance under the defined test load.The Scale Profile B captures the parameters of the load on the system in terms of number of tenants,organizations, VMs, network latency, and cloud management operations load. The results in terms ofaverage response time, throughput, and uptime under these controlled conditions provide a starting pointfor Cloud Providers to estimate how much capacity is needed for their use cases. We stronglyrecommend that Cloud Providers extensively test each environment prior to production use to ensure thatthe performance meets the business SLAs.3.1vCloud Director Virtual ApplianceThe current VVD for Cloud Providers recommends the use of a vCloud Director 10 virtual appliance. Thevirtual appliance includes an embedded and fully managed PostgreSQL database and built-in replicationfor maintaining consistency between cells. A properly configured virtual appliance cluster is also resilientto failures of individual cells.The recommended vCloud Director virtual appliance deployment includes 1 primary cell, 2 stand-by cellsand 0 or more application cells. See the vCloud Director Installation, Configuration, and Upgrade guidefor more details about the deployment, configuration, and operation of the virtual appliance.For the purposes of VVD scale and performance benchmarking, the following setup was used: 1 primarycell, 2 standby cells, 1 application cell. The Table 8 Management and Resource Component Sizing givesthe details of memory and CPU capacity on each vCloud Director appliance node.The embedded PostgreSQL database is automatically configured. However, some post-deploymenttuning might be needed for best performance. See the section PostgreSQL Tuning for the databaseparameters used in this benchmarking.11 VMware Validated Design for Cloud Providers: Scale and Performance
VMware Validated Design for Cloud Providers: Scale and Performance3.2 Management and Resource Component SizingThe following table summarizes sizing choices made for various management and resource components.Table 8. Management and Resource Component vCenter Server6.7 Update 3TinyRAM: 10 GB1 managementvCenter ServerCPU: 2(vCenter ServerAppliance with anembeddedPlatform ServicesController)Resource vCenterServerStorage: 250 GB6.7 Update 3MediumRAM: 24 GBCPU: 8(vCenter ServerAppliance with anembeddedPlatform ServicesController)3 resourcevCenter ServerinstancesStorage: 400 GBESXi6.7 Update 3vSAN (deployedin managementcluster)6.7 Update 3NSX-V forvSphere6.4.6Cisco UCSCC240-M5SXserversRAM: 16 GBCPU: 4Storage: 60 GB12 VMware Validated Design for Cloud Providers: Scale and Performance33 hosts forresource cluster, 5hosts formanagementcluster
VMware Validated Design for Cloud Providers: Scale and PerformanceComponentVersionSizeResourcesvCloud Director10.0.0.1Virtual appliance1 Primary, 2Standby cellsRAM: 32 GBCPU: 24Storage: 170 GB 500 GB NFSNotes170 GB 120 GBfor database and50 GB for logs percell and 500 GB ofshared NFSstorage for thevCloud Directortransfer service.1 application cellRAM: 8 GBCPU; 8Storage: 170 GBvCloud Availability3.5RAM: 4 GBvCloud AvailabilityC4 ApplianceCPU: 2Storage: 10 GBRAM: 6 GBvCloud AvailabilityReplicatorCPU: 4Storage: 10 GBRAM: 2 GBvCloud AvailabilityTunnel ApplianceCPU: 2Storage: 10 GBvCloud DirectorDatabasePostgreSQL 10.5RAM: 32 GBCPU: 16Storage: 300 GBContainer ServiceExtensionvCloud DirectorAMQPvCloud DirectorMetrics Database2.5RabbitMQ 3.7.9Cassandra 3.11.313 VMware Validated Design for Cloud Providers: Scale and PerformanceDatabase isembedded withthe vCloudDirector virtualappliance
VMware Validated Design for Cloud Providers: Scale and ize LogInsightdeployment8.0MediumRAM: 16 GBUse the vRealizeLog Insight ht/calculatorCPU: 8Storage: 500 GBvRealize NetworkInsightdeployment5.0LargevCloud UsageMeter3.6.1 HP3StandardRAM: 4 GBCPU: 2Storage: 100 GBvRealizeOrchestratorRAM: 6 GB7.6CPU: 2Storage: 20 GBvRealizeOrchestrator plugin for RAM: 32 GB x 3CPU: 8 x 3Storage: 300 GB x3Use thedeploymentrequirements forvCloud UsageMeter hestrator 7.6was used asopposed to 8.0 (inthe BOM)because of anissue affectingvRealizeOrchestrator 8.0.1 Master, 1Master Replica, 1Data nodeUse the vRealizeOperations 516214 VMware Validated Design for Cloud Providers: Scale and Performance
VMware Validated Design for Cloud Providers: Scale and PerformanceComponentVersionManagementPack for NSX forvSphere3.5.2ManagementPack for vSphere8.0ManagementPack for vRealizeLog Insight7.5ManagementPack for vCloudDirector5.1ManagementPack for vSAN8.0vRealizeOperationsTenant App forvCloud Director2.3SizeResources15 VMware Validated Design for Cloud Providers: Scale and PerformanceNotes
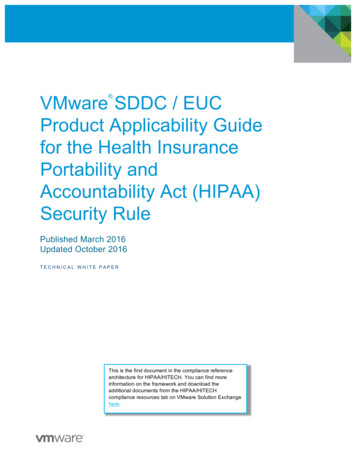
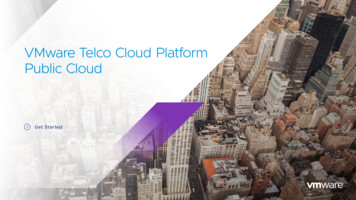
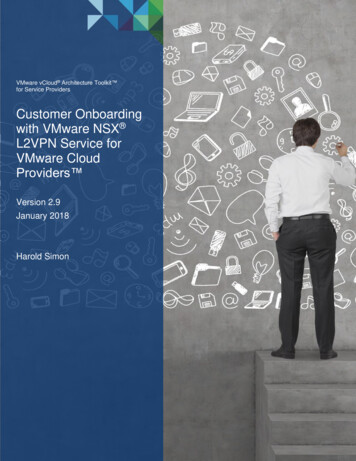
VMware Validated Design for Cloud Providers: Scale and PerformanceAppendix A – Test Environment and Benchmarking MethodsTest EnvironmentThe test environment is broadly divided into three main setups: Management cluster Resource cluster (30% of workloads on vSAN, 70% on iSCSI storage) Test driverManagement ClusterThis is where all the management components were deployed. Management componentso1 x Management vCenter Server (Tiny)o4 x vCloud Director virtual appliance cells (1 primary, 2 stand-by, 1 application)o3 x Resource vCenter Server (Medium)o3 x NSX Managero1 x Management NSX vCloud Director edgeo1 x vRealize Log Insight (Medium)o1 x vRealize Operations (Large)o1 x vCloud Usage Meter (Standard)Management Cluster Resourceso5 physical servers with 192 GB RAM and 28 cores, each with vSAN supported SSDso10 TB vSAN, 10 TB iSCSI16 VMware Validated Design for Cloud Providers: Scale and Performance
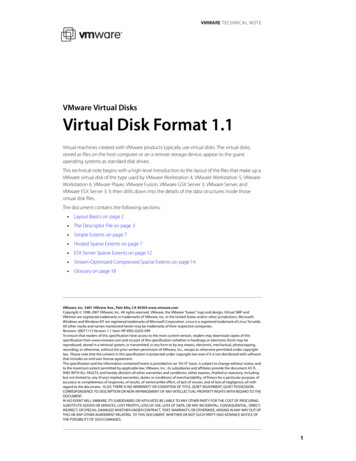
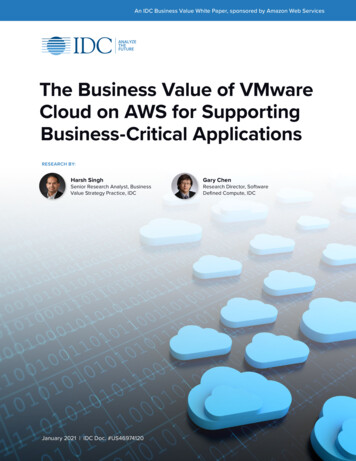
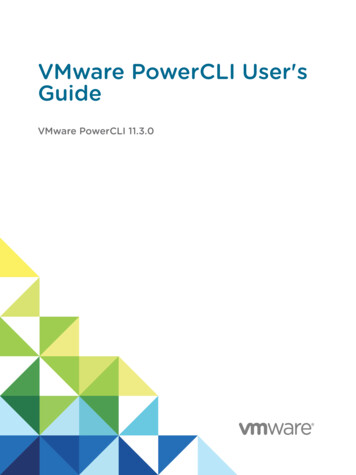
VMware Validated Design for Cloud Providers: Scale and PerformanceFigure 1. Management Component Deployment17 VMware Validated Design for Cloud Providers: Scale and Performance
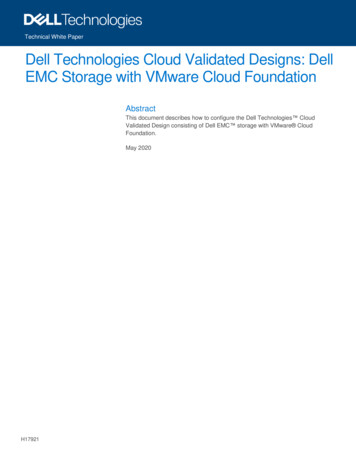
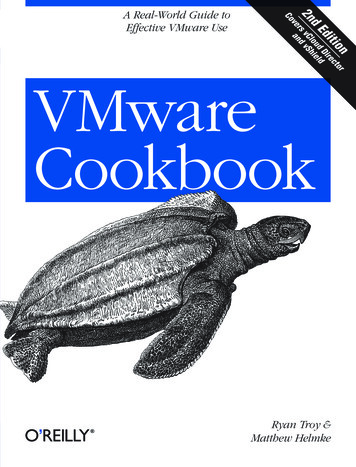
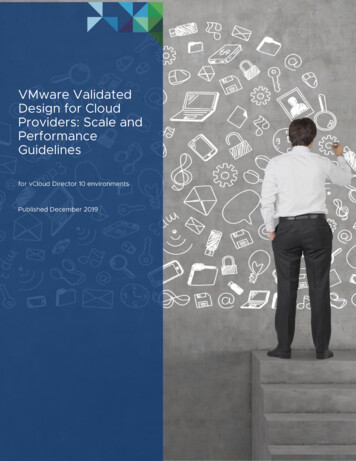
VMware Validated Design for Cloud Providers: Scale and PerformanceFigure 2. Management Cluster NetworkingResource ClusterThis is where Tenant Organizations and workload virtual machines were created. Resource cluster resourceso33 physical servers with 192 GB RAM and 28 cores, each with vSAN supported SSDso30 TB vSAN, 10 TB iSCSI18 VMware Validated Design for Cloud Providers: Scale and Performance
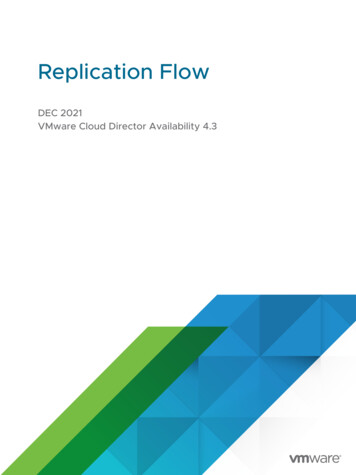
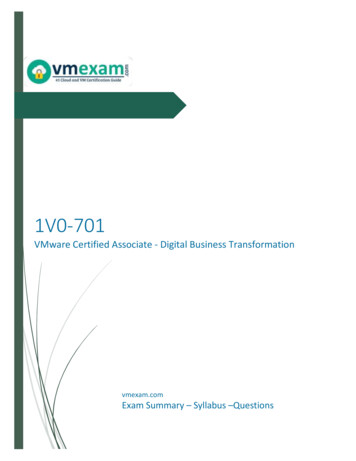
VMware Validated Design for Cloud Providers: Scale and PerformanceFigure 3. Resource Cluster Setup19 VMware Validated Design for Cloud Providers: Scale and Performance
VMware Validated Design for Cloud Providers: Scale and PerformanceFigure 4. Resource Cluster Networking20 VMware Validated Design for Cloud Providers: Scale and Performance
VMware Validated Design for Cloud Providers: Scale and PerformancePostgreSQL TuningPostgreSQL database parameters were set as follows:shared buffers 8GBeffective cache size 24GBwork mem 8MBmaintenance work mem 512MBmax parallel workers per gather 0max worker processes 24See How to Modify PostgreSQL Configuration from the vCloud Director documentation.Test DriverThe test driver suite is executed from this environment. 4 CPU, 8 GB memory, CentOS 7.3Benchmarking MethodsThe testing process is focused primarily on verifying and measuring environment behavior for: Scale – Verify whether the environment meets the Scale Profile B requirement of 10,000 powered-onvirtual machines. Performance – Measure operation latency and throughput when the environment is running at scale(10,000 powered-on virtual machines). Uptime – Verify that the environment can operate at scale with reasonable performance for a longtime.The remainder of this section details the exact methods used for test execution and measurement.Scale TestScale was carried out with a mix of manual operations and JMeter test tool-based script operations byusing the following steps:1. Create 400 Tenant Organizations in vCloud Director.2. Create and power on 10,000 virtual machines across these 400 Tenant Organizations. All virtualmachines were running Ubuntu OS with 2 GB disk, 1 GB memory3. A sample of vCloud Director operations were carried out to verify that system behaves normally atthis scale.Performance TestPerformance tests were done by executing a well-known distribution of vCloud Director operations withthe help of an internal test tool. For the complete operation list, see List of Operations.The following were the key steps in execution and measurement of the operations:1. Scaled up the environment as outlined in the previous section.2. After the environment was at scale, executed continuous stream of operations for 30 minutes withfollowing distribution: 35-40% vApp operations such as instantiate, deploy, edit, clone, and delete.21 VMware Validated Design for Cloud Providers: Scale and Performance
VMware Validated Design for Cloud Providers: Scale and Performance 25% storage-centric operations such as create, attach, detach, and delete disk. 15% networking-related operations, such as create and delete gateway, routed networks andfirewall configurations. 5% create and delete Orgs, users, catalogs, and virtual data centers.3. Operations were executed using vCloud Director local users of different roles (vApp Author, OrgAdmin, System Admin) with 10% admin roles and 90% user operation roles.4. Given that most of the operations are asynchronous, the test tool monitors the task returned byvCloud Director to get completion status and execution time details.5. Steps 2 to 4 were repeated with 32, 64, and 128 concurrent users to ascertain the ability of thesystem to deal with concurrent operation invocation.6. Step 5 was repeated for following latency (between vCloud Director and vCenter Server) values(achieved by artificial latency injection with a tool): 0.3 ms (default) 40 ms 150 msUptime TestsUptime tests involved running the environment (based on Scale Profile B) for 5 days and executing aconstant stream of API calls covering a representative set of operations. The purpose of the test is toestablish the API call success rate and system uptime.1. Tests ran continuously for 5 days.2. API workflows were triggered by 100 concurrent clients, each client would invoke an operationroughly every 20 seconds. 10,000 powered on VMs3. No artificial latency injection was done.ResultsTotal Operations completed: 1341318Average test throughput over 5 days: 186 Ops/minTotal failures over 5 days: 59Failure rate over 5 days: 0.004%Success rate: 99.996%List of OperationsFor performance benchmarking, API test clients executed a predetermined distribution across differenttypes of vCloud Director operations as described in the following tables.Table 9. vCloud Director Operations (Part 1)vApp OperationsNetwork OperationsManagement Operations22 VMware Validated Design for Cloud Providers: Scale and Performance
VMware Validated Design for Cloud Providers: Scale and PerformanceInstantiate vAppDeploy a fenced vAppCreate an orgDeploy (power on)Undeploy a fenced vAppCreate a userEdit vAppCreate an isolated networkCreate an Org VDCCompose vAppDelete an isolated networkCreate a direct VDC networkClone vAppCreate a gatewayCreate a catalogPower off vAppCreate a routed Org networkDelete a catalogDelete vAppInstantiate a vApp in that networkDelete a VDC networkDeploy a vAppDelete an Org VDCUndeploy a vAppDelete a userDelete a vAppDelete an OrgDelete a routed Org networkDelete a gatewayTable 10. vCloud Director Operations (Part 2)NSX Management OperationsDatastore OperationsOVF OperationsConvert edge to Advanced edgeCreate a diskOVF uploadEdge routing servicesInstantiate a vAppOVF downloadEdge firewall servicesAttach a disk to a vAppEdge NAT servicesDetach a disk from a vAppDistributed firewall servicesDelete a diskLoad balancer servicesDelete a vApp23 VMware Validated Design for Cloud Providers: Scale and Performance
VMware Validated Design for Cloud Providers: Scale and PerformanceAppendix B – FAQHow frequently will the Scale and Performance be updated? We expect to release an updated Scale and Performance with every major vCloud Directorrelease.How is this document related to the VMware interoperability matrix? The benchmarked stack is a subset of the full interoperability matrix and reflects the exactcomponents we validated and benchmarked in this exercise. The full interoperability includesmany more products and versions than what is tested in this exerciseHow is the Scale and Performance related to VMware Cloud Foundation? VMware Cloud Foundation is not currently part of the benchmarking, however the stack we aretesting is closely aligned with the current VCF BOM.Is Scale and Performance suitable for greenfield environments or brownfieldenvironments? Any environment can be made compliant by simply upgrading all its components to versionslisted in the Scale and Performance Bill of Materials. There is no other qualification.How can we provide input/recommendations for future versions of this doc? Contact the vCloud Director team at vcd-feedback@vmware.com or reach out to your VMwareaccount team and pass your feedback through them.What is the support model for an environment configured according t
See the complimentary documents that are part of the VMware vCloud Architecture Toolkit for Service Providers: Architecting a VMware vCloud Director Solution for VMware Cloud Providers Architecting Tenant Networking with VMware NSX in VMware vCloud Director