Transcription
Offshore WindSkills IntelligenceModel ReportSUMMARY – February 2021
IntroductionThis report provides a snapshot of the UK Offshore Windworkforce for 2020.It summarises an extensive People & Skills Survey exercise acrossthe UK sector, which has been input into a Skills Intelligence Modelto allow further analysis to the delivery of the UK Offshore WindSector Deal.The following organisations have supported this summary report: RenewableUK: People & Skills sponsor for Sector Deal, andprovision of Project Intelligence and Jobs Forecasting. National Skills Academy for Rail: developers of the SkillsIntelligence Model. Opergy Group: delivering industry and supply chainengagement, data analysis and reporting.
Offshore Wind Sector DealSector Deal – People & Skills Headlines Increasing to 27,000 direct jobs by 2030, up fromc.15,000 today, supporting at least 60,000 total jobs inthe sector. 33% women in offshore wind by 2030 (up from 18%)with ambition to reach 40% 9% BAME employees in offshore wind by 2030(up from c.5%) with ambition to reach 12% 2.5% of employed workforce from/on apprenticeshipschemes by 2030 Supporting transition training for former militarypersonnel Developing an ‘Offshore Energy Passport’ to facilitategreater job-mobility between offshore industries Audited more than 60 apprenticeship standards &frameworks
Research MethodsStep 1 INDUSTRY SURVEY Survey to offshore wind industry, collecting detailed workforce data All responses checked and uploaded to Skills Intelligence ModelStep 2 EXTRAPOLATED WORKFORCE FOR TODAY Using robust extrapolation formula, ratios, and government multipliers,estimate the total current workforceStep 3 FORECAST WORKFORCE DATA FOR TOMORROW Drawing from RenewableUK’s Project Intelligence Database andinsights from the Industry Survey, forecast the future workforcerequirements based on investment levels.
Industry SurveyA significant campaign to engage the offshore windindustry was undertaken through H2, 2020. Of morethan 500 companies identified and approached, 85detailed responses were received from a broad rangeof developers, operators, OEMs, and supply chain firms.11,365 specific jobs are identified, with varying levelsof response on gender, ethnicity, or employmentstatus.1. Data Collection2. Today’s WorkforceNote: all survey responses are GDPR compliant with non-identifiable personaldetails being captured, analysed and recorded.Survey Responses Grouped by Industry RoleDeveloper / Operator29.10%26.90%OEM3. Tomorrow’s WorkforceSupply Chain38.60%Analysis and Presentation0.00%10.00% 20.00% 30.00% 40.00% 50.00% 60.00% 70.00% 80.00% 90.00% 100.00%
Offshore Wind Job Roles 5 Job Role Groups and 25 Subgroups have been designed tostandardise reporting of howoffshore wind jobs are structured. These have been tested with skillsprofessionals and industrypractitioners to ensure a robustapproach. Skills levels are assumed forEngland, but translatable forDevolved Administrations. For the purposed of this report, alljob titles and roles identifiedthrough survey entries have beenclassified against these roles.Role GroupsRole-Sub GroupsSkill LevelsManagementLeadershipManagement CorporateSkill Level 7 Skill Level 6Management OperationalTechnicalSkill Level 6Skill Level 6ProfessionalCorporate Services HRCorporate Services ITCorporate Services FinanceCorporate Services LegalCorporate Services GeneralCorporate Services AdministrationHealth & SafetyQualitySkill Level 7 Skill Level 6Skill Level 5Skill Level 5Skill Level 7 Skill Level 4Skill Level 2Skill Level 5Skill Level 5EnvironmentalPeople Development & SkillsGraduateTraineeSkill Level 5Skill Level 5Skill Level 5Skill Level 3ApprenticeSales & MarketingCommercialProcurementSkilled ManualSkill Level 3Skill Level 5Skill Level 5Skill Level 5Skill Level 4Semi Skilled OperativeSkill Level 3Not ProvidedNot ProvidedOtherNoneTechnical / ProfessionalCorporate ServicesHSEQPeople DevelopmentCommercial
Skill Levels FrameworkSkill levels are determined by: Regulated QualificationsFramework England and NorthernIreland (RQF),Credit and QualificationsFramework for Wales (CQFW),andScottish Credit and QualificationsFramework (SQCF)FrameworkSecondary /FurtherEducationRQF / CQFW LevelSQCF LevelLevel 14GCSE grade D-GBTEC at level 1OCR Nationals Functional Skills at level 15GCSE grade A* - CNVQ Level 2BTEC at Level 2Functional Skills at level 26AS/A LevelNVQ Level 3BTEC at Level 3OCR NationalsLevel 2Level 3Note: For the purposes of this report, all SkillLevels are referenced as RQF.Certificate of Higher EducationBTEC Diploma and Advanced Diploma at Level 4City & Guild LicentiateHigher National Certificate (HNC)Diploma in Teaching in the Life Long Learning Sector (DTLLS)Level 4 NVQLevel 4Level 4&5Framework forHigherEducationQualificationsExample Awards7-8Senior Command, Leadership & Management CoursesCombinedFoundation Degree Diploma of Higher EducationBTEC Diploma and Advanced Diploma at Level 5Higher National Diploma (HND)Individual University Modules at Level 2** (e.g. through Open University)Level 5UK Bachelors degreeLevel 69 - 10Level 711UK Masters DegreePostgraduate Certificate7 Enhanced DiplomaLevel 812Doctorates
Direct vs Indirect JobsDefinitionsDirect employment: refers to a FTE that is directly involved in theSelf-employed: Self-employed people are those who defineManufacturing, Development, Construction, Operation and Maintenance of anoffshore windfarm, including Engineering, Procurement, Construction, andInstallation of any of the wind farm's finalised kit: Turbines, Foundations,Substations and Cables.themselves as working for themselves, rather than receiving a wage or salaryfrom an employer. They are therefore not included in the census data wecollected from various offshore wind organisations as part of this analysis.When an organisation is involved in both direct and indirect work, we include it inthe category (direct or indirect) in which the company has the biggest contract (orbiggest project in MW).Indirect employment: refers to employment in industries that supplyand support the core activities of offshore wind renewable energydeployment. Usually, these workers do not consider themselves as working inrenewables; they produce steel, plastics, or other materials, or they providefinancial and other services. These industries are not directly involved inrenewable energy activities but produce intermediate inputs along the valuechain of each renewable energy technology (RET). A review of employmentfactors available in the literature indicates that the inclusion of indirect jobstypically increases overall job numbers by anywhere from 50% to 100%.The ratio for indirect/direct employment used in this analysis is 0.83. This meansthat adding indirect jobs to the total direct jobs estimated will increase theoverall job number by 83%.According to the ONS Labour Market Economic Commentary from May 2019,the construction sector has the highest share of self-employed workers in thesecondary industry while administration and support services are the highestin the tertiary industry. For this reason, this analysis focuses on workers fromthese two sectors only. The ratios for self employed used comes from the“self-employment analysis by NUTS1 2019” published by the ONS in 2020using their 2019 Annual Population Survey.IRENA definition used in Renewable Energy and Jobs, Box 2.2 key definitions:Employment factors, p.41, 2013.From Economic impacts of the UK offshore wind sector: Scenarios for the SectorDeal, Vivid Economics, March 2018: “Indirect jobs were estimated bymultiplying the total number of jobs supported in the offshore wind sector bya jobs multiplier of 0.83, as recommended in Centre for Economics andBusiness Research atasets/selfemploymentbynuts1region
Assumptions & MethodFuture Workforce Assumptions Using the level of investment (CAPEX, DEVEX, OPEXper year) estimates for 2020 and the jobs estimate for2020, we determine an index for the year.Using the investment projected per year, calculatedusing the capacity coming online over the next 15 years,we can project the level of jobs supported per year.Self-employed data only includes employees whoregister as self-employed and does not includecontracted workforce from temp or recruitmentorganisations, these are assumed to be accounted forwithin the survey data already.Using the ONS figures from 2019 and quick surveyingwith the biggest tier 1 construction organisations withinour sector, we evaluate that on average 57% of the totalworkforce in Construction services is self-employed,while 33% of the total workforce in administrationservices is self employed in the UK. The data providedby the ONS is split in regions so we can apply thecorresponding ratio to the corresponding job roles ineach region from our survey:Admin and support servicesRatio Self/EmployedNorth EastNorth WestYorkshire and The Humber0.250.270.30East MidlandsWest MidlandsEast of EnglandLondonSouth EastSouth WestWalesScotlandNorthern Ireland0.330.380.430.290.440.490.290.260.26Source: ONS, Self Employment by NUTS1 2020Primary production, utilities,constructionNorth EastTesting these figures with industry, we decided to applythis ratio to the relevant construction and administrationroles which we collected through our survey, separatingfor direct and indirect roles using the 0.83 multiplier. Wefind an extra 3,692 offshore wind workers self employed inthe various UK regions, working in administrative orconstruction/engineer jobs.Self-employed jobsAllAdmin and gineering 1.502,963.99727.520.25Ratio Self/Employed0.39North West0.55Yorkshire and The Humber0.47East Midlands0.53West Midlands0.62East of England0.53London0.67South East0.65South West0.66Wales0.65Scotland0.30Northern Ireland0.79Source: ONS, Self Employment by NUTS1 2020RESULTS. Adding the total jobs from our survey sampleestimates and our self-employed estimates from the ONSratios, the total number of estimated workers in theoffshore wind industry is 26,093 of which 15,205 directemployed.
CompaniesBelow highlights the contributing companies providing detailed survey responses into the Skills Intelligence Model. 4C OffshoreArmech SolutionsASCO UK Ltd Aspect Land & Hydrographic Surveys Ltd ATKINSAyrshire CollegeBorders CollegeBurntisland Fabrications LtdC&S Offshore ServicesComputer Service CentreCore Oil & GasDeepOceanDeutsche Windtechnik LtdDM Fabrication LtdDumfries & Galloway CollegeDundee & Angus CollegeDurham UniversityEarth Stream GlobalEast Coast CollegeECITBEDF RenewablesEEEGR EquinorFacilitating ChangeFife CollegeFrontera EnterpriseFurthermore MarketingGlobal Energy GroupGreen Tech Investment Partners ASHalpin Consulting LtdHarry Maiden LtdInnogyInosysITC Hydraulic Service LtdJames FisherJDR Cable Systems LtdLeask MarineLoad Monitoring SystemsLV ShippingMaclean ElectricalMaersk Training UK LtdMELCAL Marine UK LtdMHI VestasMiros Scotland North East Scotland CollegeNewcastle College - Energy AcademyNorth Highland CollegeNpowerOffshore Renewable Energy CatapultOHT RenewablesOpergy LtdOrstedOteac LtdPeople With EnergyPort of Cromarty FirthPrimo MarineProeon Systems LimitedProservRed Rock PowerRelyOn Nutec UK LtdRenewable Resource SolutionsRenewableUKRIGOCAL Engineering LtdRMi Engineering LtdRovCoRWE Renewables Schneider ElectricScottish PowerScottish RenewablesSeajacksSiemens GamesaSignum Geophysical LtdSSE RenewablesStowen GroupSuffolk County CouncilSunrock RecruitmentTaylor Hopkinson LtdTECOSIM Simulation LtdTekmar GroupUniversity of HullVan Oord Offshore Wind UK LimitedVattenfallWellton LimitedWhittaker Engineering (Stonehaven) LtdWindhoist
Today’sWorkforce
Today’s Workforce26,093Total UK Offshore Wind Workforce15,205 10,888Direct JobsIndirect ,093Source: Estimated figures by RenewableUK as at December 2020
Survey Results HeadlinesTotal Responses85Gender BalanceCompaniesContributing Data11,365(8813 Direct / 2552 Indirect)Employees RecordedSample of 44% of total estimatedcurrent UK workforceApprentices and GraduatesEthnicity1.8% 1.4%BAME3%206White97%Apprentices158Graduates & TraineesSource: NSAR Skills Intelligence Model Survey Results/Opergy Ltd., January 2021
Age Profile17UK Offshore Wind Workforce – Age Profile2,500Min Age41Mean Age76Max Age117At 65 4546-5051-5556-6061-6566-7071 Source: NSAR Skills Intelligence Model Survey Results/Opergy Ltd., January 2021
Age Profile by GenderUK Offshore Wind Workforce – Age Profile by Gender25002000150010005000Not 504134366-70158271 0511Not ProvidedSource: NSAR Skills Intelligence Model Survey Results/Opergy Ltd., January 2021
Gender Balance Survey data includes 2,003 women (18%)compared to 8,961 (79%) men Gender not provided for 401 employeesin the survey Dominant skills levels for women in theindustry are levels 6 & 5 (Batchelor’sDegree and Higher Education Diploma)Women most frequently work in corporateservices and management roles including: Operational Management Administration FinanceTechnical %8007006005004003002001000Development4%Semi SkilledOperative14%Skill Level 2 Skill Level 3 Skill Level 4 Skill Level 5 Skill Level 6 Skill Level7 Sales / Commercial /Procurement8%HSEQ4%Management21%Source: NSAR Skills Intelligence Model Survey Results/Opergy Ltd. January 2021
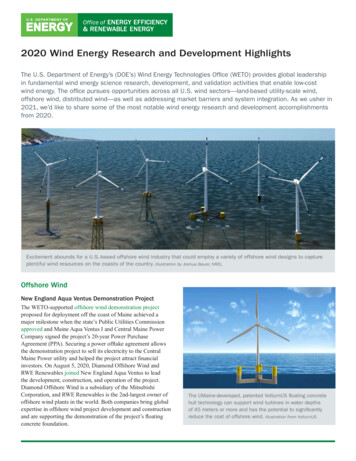
Case Studies[Top Left: Vattenfall supporting young women using VR technology; Bottom Left: Stine Myhre Selås,Equinor; Right: Scottish Power Renewables celebrating ‘Woman’s Day EAONE’ , 6-8th March 2020.]
Job GroupsUK Survey ResultsSkilled, Technical and Professional jobroles account for 62% of responses.Technical /Professional20%Not Provided Corporate Services2%8%Development5%HSEQ3%Leadership, Corporate and OperationalManagement roles account for 17% ofresponses.Management17%Skilled Manual20%Sales /Commercial /Procurement3%Semi SkilledOperative22%Source: NSAR Skills Intelligence Model Survey Results/Opergy Ltd. January 2021
Skill LevelsNote: reported using RQF levelsUK Survey Results71%38%Skill Level 7 4%of responses holdNot Provided2%Skill Level 22%Skill Level 325%qualifications at degree level orhigher (Level 6 )Skill Level 634%of responses are skilled rolesat Level 4 or above.Full Time / Part Time Status87.5% 3.5%Full Time EmployeesPart Time EmployeesNote: 9% of responses did not provide employment status data.Skill Level 419%Skill Level 514%Source: NSAR Skills Intelligence Model Survey Results/Opergy Ltd. January 2021
ApprenticeshipsTarget2.5%Industry agreed target for percentage of workforcerecruited through apprenticeship schemesCurrentApprenticesGraduates& TraineesApprentices and Graduates currently fulfil awide range of roles across all disciplines,from corporate service functions such asfinance, HR, and administration; to technicaland engineering roles both onshore andoffshore.1.8% (206)1.4%(158)Orsted Offshore Wind Technician Apprentices
RegionalSurvey Results
Regional BreakdownUK Survey ResultsData shown by UK region.1Map represents 44% of estimated totalUK offshore wind workforce, based onactual data submitted for 11,365 jobs.represents Sector Deal ‘Clusters’1.2.3.4.5.6.7.8.DeepWind (North Scotland)Forth and Tay OffshoreNorth East EnglandHumberEast AngliaSolentCeltic Sea ClusterNorth West and North WalesScotland3,417 jobs/ 30%North East1,171 jobs / 10%2North West772 jobs / 7%3Yorkshire & Humber1,710 jobs / 15%Northern Ireland22 jobs / 1%East of England1,083 jobs / 10%48Midlands190 / 2%Wales145 / 1%South West657 jobs / 6%5London892 jobs / 8%76South East961 jobs / 8%Source: NSAR Skills Intelligence Model Survey Results/Opergy Ltd. January 2021
UK Region0%RegionEast MidlandsEast of EnglandLondonNorth EastNorth WestNorthern IrelandScotlandSouth EastSouth WestWalesWest MidlandsYorkshire & HumberNo Location Data 53%8%2%1%6%10%8%7%0%3%East MidlandsEast of EnglandLondonNorth EastNorth WestNorthern IrelandNot ProvidedScotlandSouth EastSouth WestWalesWest MidlandsYorkshire & Humber30%Source: NSAR Skills Intelligence Model Survey Results/Opergy Ltd. January 2021
GenderRegionLondon and SouthWest are at 32%Yorkshire & Humber,South East and NorthWest have the lowestgender balance at 9%WomenMenNot ProvidedTotalTotal% of totalTotal% of totalTotal% of total330%770%00%10East of 92North East20918%89376%696%1,171North 42%3,417South East839%87691%20%961South West21132%43366%132%657Wales3927%10371%33%145West st MidlandsNorthern IrelandScotlandYorkshire & HumberSource: NSAR Skills Intelligence Model Survey Results/Opergy Ltd. January 2021
Regional BreakdownScotland676 women / 20%UK Survey ResultsGender Balance Data shown by UK region.Note: Figures are based on surveyresults, which represent 44% of theestimated total UK offshore windworkforce, based on actual datasubmitted for 11,365 jobs.North West66 women / 9%Northern Ireland3 women / 1%North East209 women / 18%Yorkshire & Humber148 women / 9%East of England216 women / 20%Midlands37 women / 19%Wales39 women / 27%South West211 women / 32%London283 women / 32%South East83 women / 9%Source: NSAR Skills Intelligence Model Survey Results/Opergy Ltd. January 2021
Skill Levels by Region100%90%80%70%Skill Level 7 60%Skill Level 6Skill Level 550%Skill Level 4Skill Level 340%Skill Level 2Not Provided30%20%10%0%EastMidlandsEast ofEnglandLondonNorth EastNorth WestNorthernIrelandRegion NotProvidedScotlandSouth EastSouth WestWalesWestMidlandsYorkshire &The HumberSource: NSAR Skills Intelligence Model Survey Results/Opergy Ltd. January 2021
Grand TotalNot ProvidedYorkshire &Humber6nil69428242nil174Skill Level 3nil2392221563394855416191666542800Skill Level 41289341573527751134392726336662219Skill Level 5116018619172nil4011011171617304301596Skill Level 68304543496214101028152385721183771763883Skill Level 7 nil5892427214816659142518496Not Providednil7nil5258nil72nil7nilnilnil1197Grand 5ScotlandLondonWales18South East15NorthernIreland26North EastnilEast ofEnglandSkill Level 2Skill LevelsWestMidlandsSouth WestNorth WestEast MidlandsSkill Levels by RegionSource: NSAR Skills Intelligence Model Survey Results/Opergy Ltd. January 2021
Job Groups by Region100%90%80%70%Technical / ProfessionalSkilled Manual60%Semi Skilled OperativeSales / Commercial / Procurement50%Not ProvidedManagement40%HSEQDevelopment30%Corporate Services20%10%0%EastMidlandsEast ofEnglandLondonNorth East North WestNorthernIrelandNotProvidedScotlandSouth East South WestWalesWestYorkshire &MidlandsHumberSource: NSAR Skills Intelligence Model Survey Results/Opergy Ltd. January 2021
Grand TotalNotProvidedYorkshire &HumberWestMidlandsWalesSouth WestSouth EastScotlandNorthernIrelandNorth WestNorth EastLondonEast ofEnglandEastMidlandsRole GroupsJob Groups by RegionCorporate 147771972Not Providednil7nil5258nil72nil7nilnilnil1197Sales / Commercial /Procurement15068476nil120843831215381Semi Skilled Operativenil2121618154388454312161573542549Skilled Manual1285171503706736132282226485652323Technical / 010838921171772223417961657145180171034511365Grand TotalSource: NSAR Skills Intelligence Model Survey Results/Opergy Ltd. January 2021
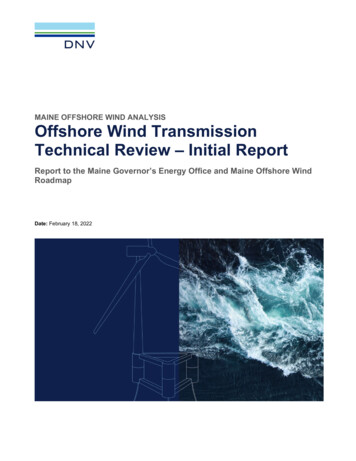
TraineeGrand Total3307415202934231215411Grand TotalYorkshire &HumberWestMidlandsWalesSouth WestSouth EastScotlandNorthernIrelandNorth WestNorth EastLondon18No Data AvailableGraduateNo Data AvailableApprenticeEast 0627111335310330241nilnil5591221765106364Images [Left to Right]: Former apprentice and now Triton Knoll turbine technician Chris Hughes; Hope Reynolds, left, training instructor Gary Croft and Jovita Beeston, ScottishPowerRenewables/East Anglia ONE; Nathan Jones, RWE Renewables Turbine Technician Apprentice at Greater Gabbard; Hope Reynolds and Jovita Beeston.Source: NSAR Skills Intelligence Model Survey Results/Opergy Ltd. January 2021
Apprentices by UK Regionincluding Graduates & TraineesApprentice, Graduate & Trainees by UK %540%30%103137182063020%3410%9230%East of EnglandLondonNorth EastNorth WestScotlandApprenticeSouth EastGraduateSouth WestTraineeWalesWest Midlands Yorkshire & TheHumberGrand Total
FutureWorkforce Forecasts
Jobs ForecastByDrawing from RenewableUK’s Project IntelligenceDatabase, the jobs forecasting model uses extrapolateddata and robust assumptions to forecast jobs growth andinvestment to 2026.2026, UK Offshore Wind is forecast to employA forecast potential investment of 60.8bn coveringthe whole project lifecycle through Devex, Capex, andOpex across all UK offshore wind projects between 2021and 2026.Assumptions include floating wind projects.The total workforce peaks at 69,848 in 2026 based oncurrent investment forecasts.At present, there is some assumed fluctuations in theconstruction profile for projects, which will have animpact on workforce requirements beyond this period.69,848jobs. 40,700 direct jobs and 29,148 indirect jobs.UK Offshore Wind Jobs Forecast to 00202020212022Total2023Direct jobs202420252026Indirect jobsSource: RenewableUK/Opergy Ltd., February 2021
16,00080000 14,00070000 12,00060000 10,00050000 8,00040000 6,00030000 4,00020000 2,00010000 -Workforce ForecastsInvestment ( millions)Jobs & Investment Forecast0202120222023CAPEXOPEX2024DEVEXDirect jobs20252026Indirect jobsSource: RenewableUK/Opergy Ltd., February 2021
Investment Profile 10.1bnInvestment Profile by Spend ( mn) 12,000Average Annual Investment 10,000(2021 to 2026) 8,000The investment forecasts, applied to all future projects,assumes the following assumed profile. 6,000 4,000 2,000 -20212022CAPEX2023OPEX202420252026Year 1 – DEVEXYear 2 – DEVEXYear 3 – DEVEXYear 4 – Year 1 CAPEXYear 5 – Year 2 CAPEXYear 6 – Year 3 CAPEX, Year 1 OPEX (30%)Year 7 – Year 4 CAPEX, Year 2 OPEX (60%)Years 8 – 33 – OPEX (at 100%)Years 33 – 35 – Decommissioning.DEVEXSource: RenewableUK/Opergy Ltd., February 2021
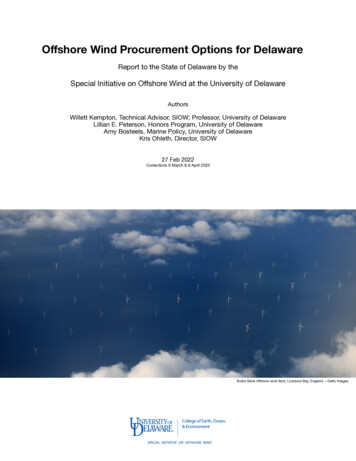
Regional Forecasts 2026UK Total Workforce ForecastsData shown by UK region.Scotland20,910 / 30%Scotland and the east coast regions of England are those withthe greatest share of forecasted jobs.Note: Regional Forecasts are extrapolated based on survey resultsproportions applied to investment forecasts.North West4,722 / 7%Forecast Skill Levels (at 2026)SkillLevel 2Northern Ireland138 / 0.2%SkillLevel 7 SkillLevel 3North East7,200 / 10%Yorkshire & Humber10,507 / 15%East of England6,656 / 10%SkillLevel 6Midlands1,150 / 1.7%Wales888 / 1.3%London5,483 / 8%SkillLevel 4SkillLevel 5South West4,039 / 6%South East5,900 / 8.5%Source: NSAR Skills Intelligence Model Survey Results/Opergy Ltd. February 2021
South 42209204904Sales / Commercial / Procurement730541728936-73750267471873Semi Skilled lled ,0398881,08610,507ManagementTechnical / ProfessionalOtherGrand TotalYorkshire &HumberSouth East757Scotland728NorthernIrelandNorth West-LondonCorporate ServicesEast ofEnglandNorth EastEast MidlandsRole GroupsJob Groups by Region 2026Source: NSAR Skills Intelligence Model Survey Results/Opergy Ltd. January 2021
For more information on the Offshore Wind IndustryCouncil and Sector Deal, visit leUKNational Skills Academy for RailSkills Intelligence Modelhttps://www.nsar.co.uk/sim@NSARLtdOpergy Grouphttps://opergy.co.uk@OpergyLtd
East Midlands 0.33 West Midlands 0.38 East of England 0.43 London 0.29 South East 0.44 South West 0.49 Wales 0.29 Scotland 0.26 Northern Ireland 0.26 Source: ONS, Self Employment by NUTS1 2020 Primary production, utilities, construction Ratio Self/Employed North East 0.39 North West 0.55 Yorkshire and The Humber 0.47 East Midlands 0.53 West .