Transcription
O shore Wind Procurement Options for DelawareReport to the State of Delaware by theSpecial Initiative on O shore Wind at the University of DelawareAuthorsWillett Kempton, Technical Advisor, SIOW; Professor, University of DelawareLillian E. Peterson, Honors Program, University of DelawareAmy Bosteels, Marine Policy, University of DelawareKris Ohleth, Director, SIOW27 Feb 2022Corrections 6 March & 8 April 2022ffffffBurbo Bank o shore wind farm, Liverpool Bay, England —Getty Images
Todd L. Goodman, Attorney, Phillips, McLaughlin & HallJason J. Folsom, Aker SolutionsStephanie A. McClellan, PhD, Simply Blue Group; and Founder of SIOWDeniz Ozkan, PhD, InvenergyPeer ReviewersNote: Some reviewers have reviewed only speci c sections; review does not constitute endorsement.Samual Beirne, Energy Program Manager, Maryland Energy AdministrationPhilipp Beiter, Senior O shore Wind Economic Analyst, National Renewable Energy LabAmanda Best, Senior Commission Advisor, Maryland Public Service CommissionJosh Kaplowitz, Vice President—O shore Wind, American Clean Power AssociationWalter Musial, O shore Wind Platform Lead, National Renewable Energy LabGary Norton, Consultant, O ce of Energy E ciency and Renewable Energy, US Dept. of EnergySara Parkison, Knauss Fellow, Bureau of Ocean Energy Management, US Dept. of InteriorErich Stephens, Founding CEO, Vineyard WindMarian Swain, Deputy Director of Policy and Planning, Massachusetts Dept. of Energy ResourcesGabe Tabak, Counsel, American Clean Power AssociationAbout the Special Initiative on O shore WindThe Special Initiative on O shore Wind is an independent project at the University of Delaware’s Collegeof Earth, Ocean and Environment that supports the advancement of o shore wind as part of acomprehensive solution to the most pressing energy problems facing the United States. The SpecialInitiative on O shore Wind provides expertise, analysis, information sharing, and strategic partnershipwith industry, advocacy and government stakeholders to build understanding and drive the deploymentof o shore wind.Acknowledgments, Funding, DisclosuresThe Rockefeller Brothers Fund provides ongoing support to the SIOW, including funding to prepare thisstudy. We are grateful to the many advisors, contributors, and reviewers who donated their time,including data and recommendations from DNREC. Kempton, the study’s lead author, has managed UDresearch funding in several areas related to this study, from the O ce of Economic Innovation andPartnerships to study marshaling ports on the East Coast and has applied for funding to UD for thestudy and design of two o shore wind facilities (a marshaling port and a training center) but he has nonancial interest in any topics in this report.Available fromSIOW publicatons: name: DE-OSWProcurement-SIOW-27Feb2022.pdfffffiPage 2 of 2fiffiffffffiffffffffffDelaware Procurement OptionsfffiAdvisors and contributors to this study
Table of ContentsExecutive summary3Objectives6Part I: State of the market and anticipated power price7State of the US o shore wind market in 20227Background & electricity units7Why procurements are tailored for o shore wind power8Methods for anticipating the o shore wind power price9Projected price of o shore wind power14Wind price compared with market price and external costs15Part II: Options for a Delaware SolicitationHow a Power Solicitation is developed18Steps in the power procurement process19Suggestions for establishing the procurement requirements and process19Representative schedule from law to power production23RFP requirements and bid evaluation24State actions to minimize cost25State urges BOEM to create more leases near Delaware26State de nes rules for siting the transmission cable landing27State coordinates electric transmission access with Maryland projects29DNREC reviews and provides early guidance on regulatory processes30Install meteorological buoy prior to RFP32Right-sizing the project3337Operations and maintenance port in Delaware38Marshaling port38Workforce development center39O shore wind visitor center40fffffffffffi37Developer contributes to a job-creating entity (e.g. OSW factory)Delaware’s future potential with o shore windfi18De nitions of the parties and documents of a power procurementState options to create employmentff1840
Summary of the e ects of policies and added facilities on power price42Conclusions44References Cited45Appendix A - Sources for Table 1, US o shore wind purchase agreements48Appendix B - Existing Delaware RECs49Appendix C - Use of CREST energy cost spreadsheet50ffffDelaware Procurement OptionsPage 2 of 50
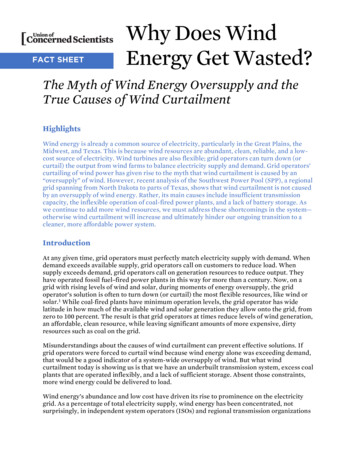
Executive summaryTo date, 14,000 megawatts (MW) of o shore wind power projects have been awarded, the rstof US state requirements totaling 40,000 MW by 2040 (Parkison & Kempton 2022). Substantialtechnology advancements and the in-progress American industrial scale-up of this industryhave dramatically reduced the cost of electricity from o shore wind in recent years. Thebuildout of the anticipated o shore wind projects through 2035, now required by eight EasternSeaboard states, will result in expenditures on components, installations, and operationsthrough 2035, estimated to be 109 billion (SIOW 2021), creating 45,000 to 83,000 jobs (AWEA2020).In response to interest from Delaware state government and citizens, the Special Initiative onO shore Wind (SIOW) has prepared this report, providing an analysis of the anticipated price ofelectricity from o shore wind power as well as guidance and options for the state if it decidesto initiate a procurement process.In Part I, we project the price of o shore wind for Delaware using three analytical methods: 1)examining recent US o shore wind power contract prices, 2) taking expert forecasts ofexpected price reductions and applying them to the recent contract prices, and 3) using abottom-up model based on component prices for future projects. We then compare theseprojected o shore wind prices with recent wholesale purchases of today’s power sources byDelmarva Power. For valid comparisons, all prices are made comparable and converted to2021 dollars. This comparison is shown in Figure ES-1.Figure ES-1. Delaware price of market electricity, mostly natural gas (top bar, grey) compared withthree methods for estimating future o shore wind prices (blue bars). All prices are /MWhnormalized to 2021 . (This gure is simpli ed from Figure 2 in the full report.)fiPage 3 of 50fffifffffffffiffffffffDelaware Procurement Options
We also calculate the health cost and carbon cost, based on federal guidance, of o shore windin comparison to our regional power mix. This is not a policy proposal, but a calculation so thatexternal costs can be considered as a quantitative benchmark, if desired.We compare o shore wind contracts across ve US states, to illustrate the factors a ectingpower prices. Lower prices result from more recent projects, turbines of 10 MW or larger,projects of at least 800 MW in size, and bid evaluations prioritizing least cost.Part I concludes: Two East Coast comparison states that recently approved o shore wind contracts (Marylandand Massachusetts) yielded prices from 56 to 86/MWh. Projects of at least 800 MW capacity have contracted to sell power at considerably lowerprices than smaller projects. A hypothetical 800 MW project o of Delaware’s coast, modeled for this report using astandard bottom-up price calculation tool (CREST) and assuming power beginningDecember 2027, yields 71.48/MWh. Recent wholesale power purchases by Delmarva range from 53 to 82/MWh. Therefore, today’s US o shore wind power prices fall within the range of wholesale powerbeing purchased for Delaware now. (No state subsidy nor external cost is used in thisprice comparison, nor is one required for an o shore wind procurement.) The Federal government now provides nancial cost guidance for health and climate changedamage. When added to the market costs of both o shore wind power and today'sconventional power, the result shows that o shore wind power is less than ½ the totalsocial cost of Delaware’s electricity today.In Part II, we draw on the state-initiated procurement processes of other eastern seaboardstates, and explain the entities involved and a owchart of their process and decision points.We then outline a process that Delaware could initiate to procure favorable bids for o shorewind power. The process includes creating an o shore-wind speci c solicitation using atailored Request for Proposals (RFP), choosing RFP requirements, and prioritizing evaluationcriteria for bids received. This report also models the estimated price impact (reduction orincrease) of potential state actions or policies, including RFP requirements, procurementassociated policies, and job-creating actions. We do so noting that di erent approaches havebeen taken by the coastal states north and south of Delaware, yielding di erent prices andbene ts. Some states have leaned more toward a “state economic bene ts” approach andothers have taken a “lowest o shore wind price” approach. If Delaware decides to create aprocurement for o shore wind, the state will develop its own approach based on its priorities,probably in the form of a procurement law. The electricity price impacts of these choices arecalculated by this report to clarify the price impact of the possible policies and alternativepriorities.For price reduction actions, this report describes nine actions or policies that will reduce theprice of o shore wind power, and two actions to avoid that would increase the price. Thepotential cost-reducing actions by the state are: Set up the procurement to use a Power Purchase Agreement (PPA) and to prevent anyimputed debt implications for the utilities buying power Specify in the RFP that the primary criterion for bid evaluation is low power price Encourage more than one Delaware utility to be the o taker Encourage the Bureau of Ocean Energy Management (BOEM) to create more leases nearDelaware, as part of the current Central Atlantic stakeholder processfffffffffifffiffffffffffflfiPage 4 of 50fffifffffffffffffiDelaware Procurement Options
Delaware electric power system Coordinate with Maryland on a single transmission corridor for MD & DE projects to lowercost and environmental/community impact Review and provide early guidance to developers on compliance with Delaware permitting(this would be performed by DNREC) State installation of a meteorological buoy in likely near-Delaware lease areas, prior to theRFPFor six of these price-reducing actions, the resulting reduction in the price of electricity iscalculated. The price reduction achieved by successfully implementing from 0 to all 6 actionsranges from 0 to 19.17/MWh, resulting in the range of prices shown as the lowest bar ingure ES-1.We describe a second list of optional actions that Delaware may consider to create jobs, newindustries, and new markets for Delaware businesses. These state options range fromrequirements in the RFP, separate administrative or legislative actions, to requirements uponthe developer. Independently of the actions below, some job creation is more likely once aprocurement process has been initiated, without any other explicit action or cost, simplybecause Delaware would have a state-approved process leading to an o shore wind project.Optional actions are as follows: State requires that the developer’s O&M port be located in Delaware State encourages private investment to build a Delaware Bay marshaling port Developer contributes to a large job-creating facility, like a wind component factory State or developer facilitates the creation of a wind worker training center Developer builds o shore wind visitor centerThe report estimates the costs of each of the job creation actions and their impact onelectricity price if the developer pays that cost. Job-creating options range widely in cost.Some have no budget cost but may require some targeted planning or minor actions byexisting state sta . Those actions that require developer payments range in wholesale costincreases from under 0.01/MWh to 3.40/MWh, with the cost unrelated to number of jobs; forexample, one of the largest job creation actions is estimated to raise cost by only 0.60/MWh.That is, contrary to widespread perception, there is not a strong correlation between spendingmore money (tax or ratepayer cost) and creating more employment in this industry.We brie y consider longer range options if the state decides to expand after the one o shorewind project considered here. Beyond one project, a joint Maryland-Delaware power line couldbe built for expandability, so that Sussex County substations could develop into transmissionthrough-connectors. If the Delaware o shore wind project is successful, the procurementprocess used for the rst project can be repeated for subsequent projects. With expansion ofo shore wind and its large-scale clean electricity supply, we outline synergistic industries forclean fuels, such as hydrogen electrolysis, ammonia from hydrogen, fertilizer and e-fuelsproduction, electri cation of cars and appliances, and other energy uses.In the nearer term, with an e cient procurement process, competitive bids, and a proposalevaluation emphasizing least-cost, by 2027 Delaware could have substantial power fromo shore wind and associated new businesses. The rst project alone would meet the state’scurrent legislative requirements for RECs by 2027 in a single project, at a price within the rangeof recent prices of traditional power. That project would also reduce Delaware's CO2 emissionsfrom the power sector by 28%, create new jobs, and would likely create new companies andbusiness opportunities.ffffPage 5 of 50fiffffififffifffiflffDelaware Procurement Optionsfffi Create a de ned, predictable state process to permit a cable landing from the ocean to the
ObjectivesThe Special Initiative on O shore Wind (SIOW) has previously conducted studies regardingo shore wind (OSW) procurements for New York State (McClellan et al. 2015) and for theCommonwealth of Massachusetts (Kempton et al. 2016). Those SIOW studies providedinformation on the cost of electricity from o shore wind power and how those states couldstructure procurements to reduce the cost to their electricity consumers. As demonstrated bythose reports, the SIOW provides independent, peer-reviewed, factual information to facilitateinformed choices by state decision-makers.The present report responds to discussions with the Delaware Department of NaturalResources and Environmental Control (DNREC) and the Delaware General Assembly (GA) withregard to o shore wind power. The objectives of the present report are guided by the followingcommunications: DNREC Secretary Garvin stated that “DNREC would like to work with the SIOW to convenesta and industry experts to conduct analysis of market trends, forward looking prices,supply chain and workforce development opportunities, technical obstacles, and options forthe possible procurement of o shore wind to serve Delaware” (Letter of 14 April 2021). The Chair and Co-chair of the Senate Environment and Energy Committee and the Chair andCo-chair of the House Energy Committee jointly wrote SIOW to encourage a “study ofpotential power solicitation, and options for such a procurement.” (letter of 5 May 2021)SIOW drew from these letters, discussions with interested members of the General Assemblyand Administration, discussions with citizen groups, and our prior experience to set thisreport’s objectives: Provide an overview of the process of OSW procurement and why that is di erent fromprocuring other electricity sources, Anticipate the likely cost of electricity from OSW based on the best information currentlyavailable, Explain how a process for procurement has worked in other states, and make Delawarespeci c recommendations for a solicitation process, Provide a basis for multiple options the State could choose among in a solicitation, includingchoices to emphasize di erent objectives, such as: Lowering or at least not raising the cost of electricity, Reducing CO2 emissions and criteria pollutants, and Improving the likelihood of state economic growth and job creation.As there could be some tradeo s between the price of electricity and other objectives, thisreport describes potential policies and opportunities and quanti es their relative e ect on theprice of electricity.Some questions frequently asked about o shore wind projects—the technology, environmentalimpacts, where to bring the power to shore, connecting to the regional power grid, consultationwith a ected communities, aesthetic impacts, etc.—are outside the scope of this report. Thesewill be addressed by legally-required state and federal reviews and approvals before anyproject can be built (for a readable summary of requirements, see Vann 2021). The goal of thisreport is to inform a state decision of whether to initiate a process so that o shore wind couldbe purchased for sale to Delaware utilities. Other questions and concerns will necessarily beresolved later in the process, as they have been in other states.fffffffiPage 6 of 50fffffffffffffffffiffffDelaware Procurement Options
Part I: State of the market and anticipated power pricePart I will provide a brief background, an overview of the terminology in this report, and anupdate on the o shore wind market in the US. Three methods for predicting the future price ofo shore wind are explained, then the expected price of o shore wind is compared to recentwholesale electricity market prices.State of the US o shore wind market in 2022Background & electricity unitsO shore wind is a local resource for generating electricity. In the mid-Atlantic region, it is analternative to producing electricity from natural gas, coal, nuclear, solar, and land-based wind.Within the past 2-6 years, the cost of o shore wind power has dropped dramatically (Lazard2020). More electricity generation is needed in the Mid-Atlantic region because many old coaland nuclear plants are reaching their end of life and because cars and other devices areincreasingly electric. Due to environmental and climate concerns, as well as the lower costs ofrenewable power, renewable electricity now dominates new power generation capacityadditions nationally.1O shore wind commitments are growing rapidly in our region. Eastern Seaboard statesbetween Massachusetts and North Carolina have collectively committed by state law to 39,880MW of o shore wind generation, including over 14,000 of that already under contract as ofOctober 2021 (Parkison & Kempton 2022, Table 3). This industry will require 109B investmentin supply chain components and services through 2030 (SIOW 2021), the factories, ports andboats to produce that, and will create 45,000 to 83,000 new jobs, with continued growthexpected after 2030 (AWEA, 2020).We next de ne electricity units and price concepts used here. Electric generation can bemeasured by power plant capacity, in megawatts (MW), and by energy production, inmegawatt-hours (MWh). For example, a power plant of 10 MW capacity can produce 10 MW ofpower at maximum output. If it were run at maximum output for two hours, that plant of 10 MWcapacity would produce 20 MWh of electric energy. To compare power plant sizes, a typicalnatural gas power plant might be 300 to 500 MW; today’s commercial o shore wind plants are800 to 1200 MW capacity, about the same size as a nuclear or large coal power plant.Regarding price units, wholesale electricity prices are in dollars per megawatt-hour ( /MWh).The retail price units are smaller, cents/kilowatt-hour, or /kWh.2 By convention, the capital costIn 2020, wind plus solar capacity was 76% of new generation, while natural gas was only 22% (EIA 2020).Continuing for 2021, US generation capacity additions are expected to be 70% wind and solar, as opposed to 16%natural gas (EIA 2021). The small amount of natural gas generation capacity that was built in 2021 is predominatelyin natural-gas producing states, which Delaware is not (EIA 2021).1A simple rule to convert wholesale to retail price is to change wholesale dollars to retail cents and divide by 10.Thus, 70/MWh is the same as 7 /kWh. The retail customer pays for the energy (kWh) plus the cost of distributingthat energy; on Delmarva Power bills, energy can be seen as “Standard O er Service Supply” which is also called“Price to compare.” There is an additional “Delivery Charge” on the bill that pays for wires, poles, substations, meterreadings, etc. The delivery charge is not a ected by decisions regarding the purchase of renewable versus othertypes of power.2ffffPage 7 of 50fffffffffffiffffffffDelaware Procurement Options
In order to compare the cost of electricity across di erent types of fuels and technologies,price of electricity is sometimes calculated as levelized cost of energy (LCOE). LCOE allowscomparing price despite di erent streams of costs and revenue through time. Because we willbe comparing projects with a price escalator equal to the projected in ation rate and withfuture operations and maintenance (O&M) costs included, this report will make electric pricecomparisons using power purchase agreement price, or PPA price rather than an LCOE price.Typically the PPA price, also called the “Year-One Cost of Energy” is the price paid per MWhthe rst year of operation, as speci ed on the PPA; it’s a tangible quantity and, in our view, ismore readily understandable. (The cost comparisons made here are valid and lead to the samedecisions, whether LCOE or PPA is used as the price metric.)Why procurements are tailored for offshore wind powerAs the United States and the world transition from fossil fuel-generated power to renewablepower, our understanding of electricity purchase procedures also changes. The states thathave procured OSW, or are in the process of procuring it, have generally begun with either aprocurement law or executive authority followed by a procurement law.4 This section explainswhy o shore wind requires a somewhat di erent approach from existing frameworks for fossilfuel generation and from smaller-scale renewables. This section also explains how lower costper MWh can be achieved, by both learning from other NE states, while also tailoring theprocurement process to Delaware’s speci c circumstances.It’s helpful to start with fundamental di erences in the cost of fuel-driven versus renewablegeneration. The cost of electricity is determined by capital cost for the generation plant andoperating cost for fuel plus O&M. Fuel prices uctuate greatly, and fuel has traditionally beenthe largest part of electricity costs. Renewables require more capital cost up front but their fuelis free, O&M is highly predictable (Stehly et al 2020), so operating costs for wind and solar areknown in advance and don’t uctuate.5One practical consequence of this is that utilities typically buy power from fossil fuel generationvia short-term power contracts, typically 2-3 years, but buy from large-scale renewablesources via long-term contracts, 15 to 25 years. Why? The wind or solar developer takes out aSource: “Average Electric Bill” updated 20 November 2021, iPropertyManagement, Nov 20, 2021. Last accessed 5Feb 2022 at: lectric-bill#delaware3Even in Virginia, the only state so far with a utility taking the lead, the state granted its regulated utilities approval todevelop OSW as part of its regulated activity (Code of Virginia, Title 56, Chap 23, § 56-585.1:11). This law alsocapped OSW projects’ total levelized cost to no more than 1.4 times the electricity cost of a simple cyclecombustion turbine.4Fossil fuel power plants can reduce fuel cost uctuations the rst few years by buying a nancial hedge, orincreasingly, by contracting for renewables with a constant price during long-term PPAs. A smaller source of priceuctuations is that towards the end of a project’s life, when generation equipment typically requires moremaintenance, whether wind or fossil. Turbine maintenance doesn’t cause wind power price uctuations because it isbaked into a PPA price, also late-lifecycle maintenance is balanced by capital-cost payo by that time.5flfiffflfifffiPage 8 of 50flfffiffflfiflffffDelaware Procurement Optionsfiflof power plants is measured in dollars per kW ( /kW) of capacity. This report will use /MWhfor wholesale energy cost, and we will use /kW for the capital cost of electric generation. Torelate the costs in this report to home electric bills, the average Delaware residence uses 932kWh3 or 0.932 MWh per month, and an 800 MW project would make up 33% of the electricitygoing to Delaware’s customers. For example, if a speci c policy change would lower or raisewholesale electricity by 1/MWh, that is a 31 /month (0.932*0.33) saving or cost in the averageDelaware home’s monthly bill, or 3.69 per year.
loan to build, and components and contracts are priced before they build. Therefore, theyknow what the price of electricity must be in year one and for every subsequent year. The fuelbased generator is paying o a smaller loan, but isn’t sure what their input fuel costs will be,even a couple of years into operation. The fuel-based generator needs the ability to adjustprices to account for changes in fuel costs, thus the need for short-term contracts.Conversely, large-scale renewable generation is determined by the ability for privatedevelopers to borrow money and then pay it back via electricity sales over 20 to 30 years. If alarge wind project, a 30-year asset, sells its output via a short-term contract with no assuranceof continuing sales, then the developer won’t be able to borrow money, or the borrowing ratewill be very costly. This problem is solved if the buyer and seller sign a long-term powerpurchase agreement (PPA) to sell at a de ned rate in /MWh. To the buyer, this means that theprice won’t rise unexpectedly due to fuel price increases or carbon taxes in the future. On theother hand, if competing sources of electricity become cheaper, the buyer cannot switch andtake advantage of a lower price until the end of the contract period. In summary, short termpower purchase contracts make sense for fossil fuel generation, but long-term contracts arepossible and will lower the cost of wind power and other renewables.One often hears that o shore wind power is expensive. Indeed, Table 1 shown below includessome high prices. But as previously stated, larger and newer o shore wind projects generallyhave lower prices, due to economies of scale and recent technology improvements. Mostimportantly, as we will see, state policy and state structuring of the procurement can increaseor reduce the electricity price. Some states have prioritized low cost electricity, but more havedecided to leverage power procurement to pay for job-creating facilities within their states.6 Wehave no position on whether low power cost or more job creation is preferred, but this reportwill inform state decision-making by laying out the options and the cost or saving of each.A long-term power contract was identi ed as a way to resolve the problem of risk in repaymentof loans for a long-lived investment. Other risks include incorrect prediction of wind speed(and thus revenue), development delay, unpredictable permitting outcomes, construction delay.All of these risks become cost items in the developer’s cost modeling spreadsheet, and/or theyincrease the cost of borrowing, both of which raise the cost of electricity without bene t to theseller or buyer. Thus, one state strategy to lower electricity cost discussed further in this reportis for the state to lower risks to the developer and then to make that lower risk clear to thedevelopers before they place competitive bids.As will be noted regarding projects in the recent years in Table 1 (discussed in the nextsection), state-requested project sizes have grown larger, as states have realized that o shorewind power is most cost-e ective in large increments. This is consistent with another driver ofstate OSW policy seen in Northeastern states, where governments compare all of their in-staterenewable resources with greenhouse gas reduction targets and nd that they cannot reachtheir targets without including large-scale o shore wind development.Methods for anticipating the offshore wind power priceThe price of electricity from o shore wind power is anticipated here using three methods, eachof which has varying strengths and weaknesses. The rst method is to examine recent OSWprices in states where utilities are purchasing it. Second is to use a sample of expert estimatesBundling the cost of facilities into a power solicitation may be due to developers realizing that criticalmanufacturing or ports are not available in the US, so they have to build the facilities in order to build the project.Another dynamic is that In promoting power contracts, developers may promise job creation, the cost of which isthen added to the capital cost of the wind project and thus is recovered in ratepayer cost.6fffififffiPage 9 of 50fffififfffffffDelaware Procurement Options
to adjust current prices, yielding the price anticipated ve years hence. The third method is abottom-up calculation from component costs, the third being the method used by developersto make power bids.Having more than one way to estimate the future price of OSW may give more con dence tothe result, and can help one understand how the state’s approach can lead to lower prices, jobcreation, or other objectives.ELECTRICITY PRICES FROM PRIOR US PROJECTS (METHOD 1)Table 1 shows all o shore wind purchase agreements in the US as of the end of 2021, groupedby state, with power prices adjusted to be consistent with each other.7The “PPA Price” column in Table 1, as noted is levelized real 2021 price.” This column showst
In Part I, we project the price of offshore wind for Delaware using three analytical methods: 1) examining recent US offshore wind power contract prices, 2) taking expert forecasts of expected price reductions and applying them to the recent contract prices, and 3) using a bottom-up model based on component prices for future projects.