Transcription
mineralsArticleRecovery of Alkali from Bayer Red Mud Using CaOand/or MgOBingxin Zhou 1,2,3,4 , Shaotao Cao 2,3, *, Fangfang Chen 2,3 , Fangfang Zhang 2,3 and Yi Zhang 2,31234*School of Chemical Engineering and Technology, Tianjin University, Tianjin 300072, China;zhoubingxin@163.comKey Laboratory of Green Process and Engineering, Institute of Process Engineering, Chinese Academy ofSciences, Beijing 100190, China; ffchen@ipe.ac.cn (F.C.); ffzhang@ipe.ac.cn (F.Z.); yizh@ipe.ac.cn (Y.Z.)National Engineering Laboratory for Hydrometallurgical Cleaner Production Technology, Institute ofProcess Engineering, Chinese Academy of Sciences, Beijing 100190, ChinaNational Engineering Research Center of Distillation Technology, Tianjin 300072, ChinaCorrespondence: stcao@ipe.ac.cn; Tel.: 86-1082544884 Received: 29 March 2019; Accepted: 26 April 2019; Published: 30 April 2019Abstract: Recovering alkali from Bayer red mud is crucial for storage security, resource utilization andenvironmental protection. In this study, the addition of MgO and/or CaO was conducted to recoveralkali from red mud with a hydrothermal method for the first time. A synergistic result with a residualNa2 O/SiO2 weight ratio of 0.03 was obtained by adding the blend of CaO and MgO at an appropriatetemperature. MgO was found to be more temperature-dependent than CaO when substituting Na2 Ofrom red mud due to their different hydration processes. The alkali recovery was controlled by areaction at a temperature of 200 C and by internal diffusion at a higher temperature for MgO, butcontrolled by internal diffusion for CaO in the whole temperature range studied. The formationof hydrotalcite-like compounds with a loose structure was verified with the help of XRD, FTIR,and SEM-EDS. It was proved that both the reaction kinetics and the characteristics of solid productshave a significant influence on the recovery of alkali.Keywords:recovering alkali;hydrotalcite-like compoundsBayer red mud;reaction kinetics;magnesium oxide;1. IntroductionRed mud is the solid waste emitted from the aluminum industry. China produced 69.02 milliontons of alumina in 2017, with more than 100 million tons of red mud generated [1]. The pH of redmud ranges from 9.2 to 13.0 with an average value of 11.3 1.0, and the high alkalinity of red mudis the primary reason for its classification as a hazardous material [2–5]. Although most aluminaproducers dispose of this residue in tailing dams [6], this is in no way a long-term solution consideringthe associated security, environmental and utilization problems [7–10].Several processes have been proposed to neutralize the alkali in red mud, such as acids and acidgases neutralization, seawater neutralization, microbial neutralization and revegetation [4,8,11–15],among which seawater neutralization has been highly valued for the abundance and low cost ofseawater. In the seawater neutralization process, the Ca- and Mg-rich brines play an importantrole in the reduction of pH and in the precipitation of hydroxide, carbonate or hydroxycarbonateminerals [13,16,17]. However, this method is only suitable for coastal areas.In addition, leaching and recovering alkali from red mud has also been widely investigated,such as the soda-lime roasting process, solvent extraction process, calcification-carbonation method,and water leaching and hydro-chemical process [8,18–20]. The addition of lime has been widely studiedMinerals 2019, 9, 269; s
Minerals 2019, 9, 2692 of 15because of its excellent performance in replacing Na2 O, as well as its abundance and cheapness. In fact,the insoluble sodium mainly lies in cancrinite, and the sodium can be leached out from it only if thestructure is broken down, or the included Na can be removed through the opening of the cancrinitestructure. Therefore, the leaching process is based on the ion exchange between Ca2 and Na [4].There are many studies about leaching alkali from red mud with lime, including the industrial use oflime to remove alkali, such as the “Lime Bayer” process and the Sagin process [4]. Yang et al. andLuo et al. investigated the recovery ratio of alkali with the addition of lime under different conditions,and obtained the best recovery ratio of 80% [21,22]. Li et al. conducted a thermodynamic analysis ofthe calcification reaction and studied the calcification mechanism under different conditions focusingon the calcification-carbonation processes [23].To summarize, CaO or MgO plays an essential part in alkali recovery and pH reduction of redmud because of its high efficiency, low cost and absence of secondary pollution, unlike Ca- and Mg-richbrines. However, few examples from the literature have systematically reported the differences inusing CaO and/or MgO as additions to recover alkali from red mud. Venancio et al. added CaO/MgObefore the carbonation, but only reported the change of pH [24].In this study, the hydrothermal reaction using a different molar ratio of CaO/MgO blend torecover alkali was conducted at different temperatures to determine the alkali recovery capacity,and the best recovery efficiency reached 89.3% with a residual Na2 O/SiO2 weight ratio (N/S) of 0.03.The reaction kinetics was regressed to ascertain the rate controlling step. Moreover, the detection ofphase composition, infrared spectroscopy analysis and micro-zone analysis were used to study thedifferences in CaO/MgO dealkalization. This study can provide reference for the reaction mechanisminvestigations of alkali recovery from red mud based on ion exchange.2. Materials and Methods2.1. MaterialsCalcium oxide (CaO, AR) and magnesium oxide (MgO, AR) were purchased from Beijing ChemicalIndustry Co. Ltd. and were used as received. Deionized water was used in all experiments. Redmud was supplied by Coalmine Alumina Co., Henan Province, China, dried overnight at 105 Con the ground, and finally put through a 200-mesh sieve. The standard reference red mud wasfrom Zhengzhou Light Metals Research Institute of CHINALCO, Henan Province, China. The flux(Li2 B4 O7 :LiBO2 12:22) was purchased from Luoyang Tenai Laboratory Equipment Co., Ltd., HenanProvince, China.2.2. Experimental MethodsThe experiments were carried out in 150 mL steel bomb reactors which were placed in ahomogeneous bath furnace. The reactors were made of nickel metal, and the furnace was filled withglycerin when the temperature was 160 C, while filled with a molten salt of 53 wt. % of KNO3 ,40 wt. % of NaNO2 , and 7 wt. % of NaNO3 when the temperature was higher than 160 C. The agitationof the reaction was driven by the rotation of the steel bombs at a speed of 30 rpm and strengthened bythe addition of nickel beads. The temperature of the furnace was controlled within 0.5 C.For each experiment, 15 g red mud and a blend with a specific molar ratio of CaO to MgO(100%:0%, 90%:10%, 70%:30%, 50%:50%, 30%:70%, 10%:90% and 0%:100%) was added in each steelbomb reactor. The liquid to solid (L/S) weight ratio was fixed at 4:1, which was the same as in the latestliterature focusing on alkali recovery of red mud [23]. The total amount of CaO and MgO in each bombreactor was 0.056 mol and remained constant, with the CaO and/or MgO:Na2 O molar ratio remainingat 4:1 [23,25]. The steel bomb reactors were then put in the furnace. The furnace was heated to 20 Cbelow the scheduled temperature in advance, and the start of the reaction was recorded upon reachingthe experimental temperature. The steel bombs were removed after reaction for 3 h, and then quickly
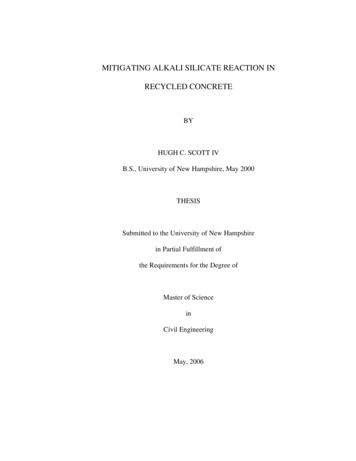
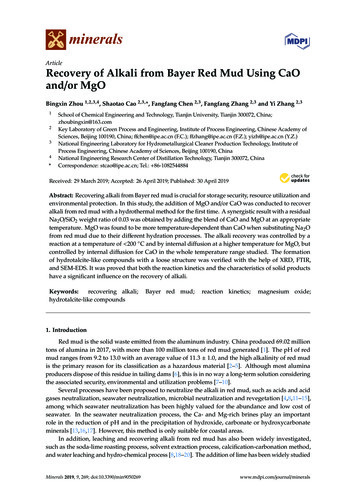
Minerals 2019, 9, 2693 of 15cooled in water. The solid cake and the filtrate were obtained by filtration. The obtained solids werewashed by deionized water and dried in a laboratory oven at 105 C for subsequent analysis.2.3. Analytical MethodsThe content of water-soluble sodium in the red mud was obtained by the titration method of thePingguo alumina factory, Guangxi, CHALCO. The analysis process is shown as follows:(a) An amount of 5 g red mud and 200 mL sodium chloride solution (0.1000 mol/L) were added ina 500 mL conical flask, and then the suspension was agitated for 15 min by a magnetic stirrer at anagitation speed of 300 rpm, before being filtrated.(b) An amount of 100 mL liquid filtrate obtained by filtration was moved into a 250 mL conicalflask, and the liquid was concentrated to about 50 mL, and heated in an electric furnace.(c) Between six and eight drops of bromothymol blue were added into the concentrated liquidand then the liquid was rapidly titrated with hydrochloric acid (0.1000 mol/L). We stopped addinghydrochloric acid when the color changed from blue to yellow and recorded the volume (V, mL) of thehydrochloric acid used.The content of water-soluble sodium in the red mud could be calculated through Equation (1):Na2 O wt.% 0.1 V200 62 100 0.124 V1000 10025(1)The chemical composition of the solids was determined by X-ray Fluorescence (XRF, ARL9800XP,Thermofisher, Waltham, MA, USA). The loss of sodium from the red mud could be obtained by theXRF measurement and calculation. The samples were pressed into disks before measurement: (1) thesolid samples were finely ground and dried at 110 C for 1 h; (2) 0.7000 g sample and 5.6000 g flux weremixed and melted into a disk with an automatic melting furnace (FLUXY10, Classise, Mississauga,Ontario, Canada). The disks were subsequently analyzed using the XRF instrument, operated at30 kV and 80 mA. The elemental concentrations (Al2 O3 , Fe2 O3 , CaO, TiO2 , SiO2 , MgO, Na2 O andK2 O) were quantified based on the measurements of disks using the MVR software. Prior to theanalysis of the samples, the XRF instrument was calibrated with standard reference red mud and theintensity–concentration working curve was made.During the hydrothermal process, the silicon oxide would not be leached into the liquor, and therecovery ratio of alkali from the red mud could be calculated through Equation (2):!Nα 1 100%N0(2)where α was the recovery ratio of alkali, N was the N/S in the solid sample, and N0 was the N/S of theinitial red mud.X-ray diffraction patterns of the solids were identified from powder diffraction patterns (XRD,X’pert MPD Pro, PanAnalytical, Almelo, the Netherlands) recorded with Cu Kα (λ 0.15408 nm)radiation. The structural investigation of solids was carried out by Fourier transform infraredspectroscopy (FTIR, T27-Hyperion-Vector22, Bruker, Bremen, Germany). The surface morphology ofsamples was detected by scanning electron microscopy (SEM, JSM-7001F, JEOL, Tokyo, Japan) withenergy dispersive X-ray spectroscopy (EDS, Inca X-MAX, Oxford, UK).3. Results and Discussion3.1. Characterization of Bayer Red MudFrom the X-ray diffraction patterns in Figure 1, Bayer red mud mainly consists of cancrinite(Na8 (Si6 Al6 O24 )(H0.88 (CO3 )1.44 )(H2 O)2 ), katoite (Ca2.93 Al1.97 Si0.64 O2.56 (OH)9.44 ), hematite (Fe2 O3 ),perovskite (CaTiO3 ) and calcite (CaCO3 ). The main chemical composition of red mud is shown inTable 1 and Na2 O accounts for 5.97 wt. % in the red mud. The content of water-soluble sodium in
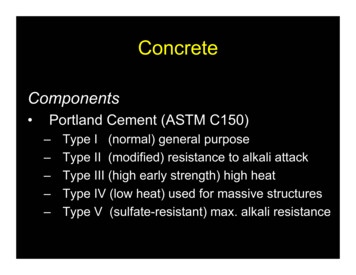
Minerals 2019, 9, 2694 of 15the red mud was obtained with the titration method as shown in Section 2.3, and the result showedMinerals2019, 9, x 0.95FOR PEERREVIEW4 of15thatV equaledmL, sothe water-soluble sodium and water-insoluble sodium were calculatedfor2.0 wt. % and 98.0 wt. % of the total sodium in the red mud, respectively. Besides, the X-ray diffractionbe seeninthatthe particlesof thered mudshow irregularappearanceand the distributionpatternFigure1 shows nodetectablechangesafter the removalof water-solublesodium.ofItsodiumis thusMinerals2019,9,xFORPEERREVIEW4 thatof 15 mostatoms focuseson somespecific hat mostwater-insolublealkalinewhichlies inisthecancrinite.IntheFigure2, it canbe seenthat theof the alkalilies in cancrinite.particlesof themud showirregularandthe distributionof sodium ofatomsfocusesbe seenthat redthe particlesof thered mudappearanceshow irregularappearanceand the distributionsodiumon iousassertionthatmostofthealkaliatoms focuses on some specific particles, which is consistent with the previous assertion that most liesin cancrinite.of the alkali lies in e1.1. X-raydiffractionanalysisof ofBayerredredmud(1—Na(H0.88(CO)1.44)(HO)Figure1. (CO3(CO)1.443)(H2O)2; 2 28 Si6 Al246(H2—Ca2.93AlSi1.97SiO0.64O2.562.56(OH)9.44; 3—CaCO22OO3;3;5—CaTiO3). 3). 3 ).2—Ca2.93Al1.972.56(OH)9.44; 3—CaCO33; 4—Fe4—Fe2—CaSi0.64O(OH); 3—CaCOO3 ; 5—CaTiO2.931.970.649.443 ; 4—Fe25—CaTiOFigure 2. Morphology of the red mud (the green parts represent Na).Table 1.Main ay fluorescence.Figure2. Morphologyof theofredmudpartsbyrepresentNa).Figure 2. Morphology of the red mud (the green parts represent le1. %)Main chemicalof Bayer8.14red mud5.97measuredContent(wt.24.42 composition21.1218.474.56by X-ray1.53 fluorescence.0.750.28ChemicalsAl2O3SiO23.2. Recovery of Na2O Using CaO/MgOContent (wt. %)24.4221.123.2. Recovery of Na2O Using 0.75N/S0.28
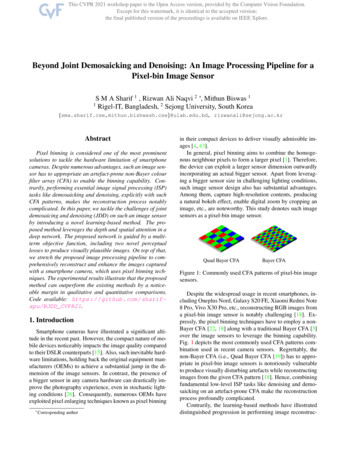
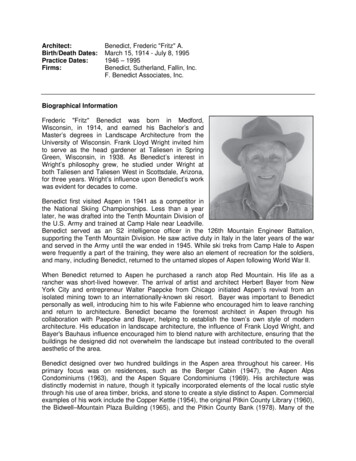
Minerals 2019, 9, 2695 of 15Table 1. Main chemical composition of Bayer red mud measured by X-ray fluorescence.ChemicalsAl2 O3SiO2CaOFe2 O3Na2 OTiO2K2 OMgON/SContent (wt. %)24.4221.1218.478.145.974.561.530.750.28Minerals 2019, 9, x FOR PEER REVIEW5 of 153.2. Recovery of Na2 O Using CaO/MgOThe influence of temperature on alkali recovery efficiency was investigated. The results areThe influence of temperature on alkali recovery efficiency was investigated. The results areillustrated in Figure 3 with pure CaO or MgO as an addition, and it is found that the recovery ratioillustrated in Figure 3 with pure CaO or MgO as an addition, and it is found that the recovery ratio ofof NaNa2OO positively correlates with temperature. The recovery ratio increased smoothly from 72.5%2 positively correlates with temperature. The recovery ratio increased smoothly from 72.5% toto 80.9%80.9%ininthethetemperaturetemperaturerangeof 90–210 C withan addition,butsharplymore sharplyfrom C withrangeof 90–210CaO CaOas an asaddition,but morefrom 13.4%13.4%to 78.9%whenadded200and C,thenand onlythen improvedonly improvedto 79.9%to 78.9%whenMgOMgOwas wasaddedfromfrom90 C90to C200to C,to 79.9%when whenthe thetemperaturetemperaturefurtherincreasedto210 C.AlthoughtherecoveryefficienciesofNa2O with CaOfurther increased to 210 C. Although the recovery efficiencies of Na2 O with CaO as anas additionan additionwere alwayshigherwithMgO,efficiencythe relativeefficiency(MgO:CaO)were alwayshigher thanthosethanwiththoseMgO, therelative(MgO:CaO)increasedfrom rom90 Cto210 C.Moreover,18.5% to 98.8% when temperature increased from 90 C to 210 C. Moreover, the recovery efficiencytherecoveryefficiencywassimilarfor bothCaO and MgOat temperatures 200 C.was similarfor bothCaOand MgOat temperatures 200C.Figure3. MgOCaO/MgO3 h).FigureInfluenceofoftemperaturetemperatureonon thethe recoveryrecovery ratio(t (t 3 h).Nevertheless,thetherecoveryrecovery ofa totallydifferentrule withblendCaO ofNevertheless,of sodiumsodiumoxideoxideshowsshowsa totallydifferentrule thewiththe ance,therecoveryefficiencydecreasedwiththeCaO and MgO as an addition, as shown in Figure 4. For instance, the recovery efficiency decreased C. However, the ewaslowerthan200with the increasing proportion of MgO when the temperature was lower than 200 C. However, theratios ofratiosNa2 Oofwithto 50% (molar ratio) MgO addition were higher than those of the single use ofrecoveryNa10%2O with 10% to 50% (molar ratio) MgO addition were higher than those of the C, and the maximum was obtained at 50%CaOorMgOwhenthetemperaturehigher than200highersingle use of CaO or MgO when thewastemperaturewasthan 200 C, and the maximum wasMgO addition. The best recovery of Na2 O was 89.3% in the experimental range, with N/S of 0.03 andobtained at 50% MgO addition. The best recovery of Na2O was 89.3% in the experimental range,only 0.64 wt. % Na2 O left in the residue.with N/S of 0.03 and only 0.64 wt. % Na2O left in the residue.
Minerals 2019, 9, 2696 of 15Minerals 2019, 9, x FOR PEER REVIEW6 of 15Figure 4. InfluenceInfluence ofof blendingblending MgOMgO andand CaOCaO onon the recovery ratio of Na22OO (t(t 33 h,h, %% meansmeans thetheFiguremole fractionfraction of MgO addition).mole3.3. Phase Differences of CaO/MgO Substituting Na O3.3. Phase Differences of CaO/MgO Substituting Na22OAs shown in Figure 5a, the dealkalization product bearing Ca is attributed to katoite with CaO asAs shown in Figure 5a, the dealkalization product bearing Ca is attributed to katoite with CaOan addition [23]. However, as shown in Figure 5b,c, most residues bearing Mg are MgO and Mg(OH)2as an addition [23]. However, as shown in Figure 5b,c, most residues bearing Mg are MgO andwith MgO as an addition at a temperature lower than 200 C, indicating the incomplete hydration ofMg(OH)2 with MgO as an addition at a temperature lower than 200 C, indicating the incompleteMgO and the difficulty in leaching Na O. In fact, temperature has been proven to play an importanthydration of MgO and the difficulty in2 leaching Na2O. In fact, temperature has been proven to playrole in the hydration process of MgO [26,27]. As the alkali recovery was based on the ion exchangean important2 role 2 in the hydration process of MgO [26,27]. As the alkali recovery was based on thebetween Ca /Mg and Na [23], the hydration of MgO and CaO to dissociate the ion was of greation exchange between Ca2 /Mg2 and Na [23], the hydration of MgO and CaO to dissociate the ionimportance to the alkali recovery. The reaction kinetics will be discussed in Section 3.4. The XRDwas of great importance to the alkali recovery. The reaction kinetics will be discussed in Section 3.4.patterns in Figure 5 and Table 2 also show the appearance of (Mg4.5 Al1.5 )(Si2.5 Al1.5 )O10 (OH)8 which isThe XRD patterns in Figure 5 and Table 2 also show the appearanceof (Mg4.5Al1.5)(Si2.5Al1.5)O10(OH)8a kind of hydrotalcite-like compound and contributed to the sodium removal. The related reactionswhich is a kind of hydrotalcite-like compound and contributed to the sodium removal. The relatedcan be simplified as follows:reactions can be simplified as follows:Na8 (Si)(H(CO)(HO (CO3)1.44)(H2 O)2O) CaO H22O CaAl1.97Si0.64O2.569.44 9.44 3 )1.4422 2.931.972.56 (OH) CaCO3 NaCaCONa OH OH 3 (3)(3)Na8(Si6Al6O24)(H0.88(CO3)1.44)(H2O)2 MgO H2O (Mg4.5Al1.5)(Si2.5Al1.5)O10(OH)8(4)Na8 (Si6 Al6 O24 )(H0.88 (CO3 )1.44 )(H2 O)2 MgO H2 O (Mg4.5 Al1.5 )(Si2.5 Al1.5 )O10 (OH)8 CO32- Na OH(4)2 CO3 Na OHTable 2. XRD patterns of solid products at temperatures 200 C.MgO%Temperature/ CMgOMg(OH)2(Mg4.5 Al1.5 )(Si2.5 Al1.5 )O10 (OH)809014019090140190xxx xxx50xxx xx 10090140190 x % means the mole fraction of MgO addition; only new phases in each sample are listed out;x: nonexistence.: existence;
Minerals9, x FOR PEER REVIEWMinerals2019,2019,9, 2697 of 157 of 15 C: addition;FigureXRD patternsof ofsolidproductsat temperatures 200 C: (a)0% MgO(b) 50%addition;Figure5. 5. XRDpatternssolidproductsat temperatures 200(a) 0% (H0.88(CO3)1.44)(H2O)2;(b) 50% MgO addition; (c) 100% MgO addition (1—Na8 Si6 Al6 O24 (H0.88 (CO3 )1.44 )(H2 O)2 ;2—Ca2.93Al1.97Si0.64O2.56(OH)9.44; 3—CaCO3; 4—Fe2O3; 5—CaTiO3; 6—MgO; 7—Mg(OH)2; 8—2—Ca2.93 Al1.97 Si0.64 O2.56 (OH)9.44 ; 3—CaCO3 ; 4—Fe2 O3 ; 5—CaTiO3 ; 6—MgO; 7—Mg(OH)2 ;(Mg4.5Al1.5)(Si2.5Al1.5)O10(OH)8); % means the mole fraction of MgO addition; only new phases are8— (Mg4.5 Al1.5 )(Si2.5 Al1.5 )O10 (OH)8 ); % means the mole fraction of MgO addition; only new phasesmarked out while the same XRD pattern for the red mud is presented without labels in each figureare markedout while the same XRD pattern for the red mud is presented without labels in each figurefor clarity).for clarity). C, the changes in XRD patterns are shown in Figure 6 andWhen the temperatureto 200Table increases2. XRD patternsof solidproducts at temperatures 200 C.Table 3. New hydrotalcite-like compounds of Ca10 Mg2 Al4 (SiO4 )5 (Si2 O7 )2 (OH)4 and Mg3 Si2 O5 (OH)4MgO% Temperature/ MgO Mg(OH)2 (Mg4.5Al1.5)(Si2.5Al1.5)O10(OH)8appear when MgO is added. The90 relating xreactionsx can be simplifiedx as follows:0140xxxx )(H2 O)xx Mg3 Si2 O5 (OH)4 Na8 (Si6 Al6 O24 )(H1900.88 (CO3 )1.442 MgO H2 O 90 xAl(OH)4 CO3 2 Na OH x140190 Na8 (Si6 Al690O24) (H0.88 (CO x3 )1.44 )(H2 O)2 MgO CaO H2O 100140 2 Ca10 Mg2190Al4 (SiO4 )5 (Si OH 4 Na CO 3 2 O7 )2 (OH) (5)50(6)
Na8(Si6Al6O24)(H0.88(CO3)1.44)(H2O)2 MgO H2O Mg3Si2O5(OH)4 Al(OH)4 CO32- Na OHMinerals 2019, 9, 269Na8(Si6Al6O24)(H0.88(CO3)1.44)(H2O)2 MgO CaO H2O Ca10Mg2Al4(SiO4)5(Si2O7)2(OH)4 Na CO32- OH-(5)8 of 15 (6) C: (a) Bayer red mud;Figure6. patternsXRDof patternsthe solidat 200Figure6. XRDthe solid ofproductsat 200products C: (a) Bayerred mud;(b) 0% MgO addition; (c)MgO (d)addition;(c) addition;10% MgOaddition;(d) 30% (f)MgOaddition;(e) 50%10% (b)MgO0%addition;30% MgO(e) 50%MgO addition;70% MgOaddition;(g) and(h)100%MgOMgO addition and (h) 100% MgO addition —Na8 Si6 Al6 O24 (H0.88 (CO3 )1.44 )(H2 O)2 ;2—Ca2.93 Al1.97 Si0.64 O2.56 (OH)9.44 ;9.44; 3—CaCO3; 4—Fe2O3; 5—CaTiO3; 7Si0.64O2.56(OH)3—CaCO3 ; 4—Fe2 O3 ; 5—CaTiO3 ; 6—Ca10 Mg2 Al4 (SiO4 )5 (Si2 O7 )2 (OH)4 ; 7—Mg3 Si2 O5 (OH)4 ;7—Mg3Si2O5(OH)4; 8—(Mg4.5Al1.5)(Si2.5Al1.5)O10(OH)8); % means the mole fraction of MgO addition;8—(Mg4.5 Al1.5 )(Si2.5 Al1.5 )O10 (OH)8 ); % means the mole fraction of MgO addition; only new phases areonly markednew phasesare markedtheXRDfor thered mudout whilethe same outXRDwhilepatternforsamethe redmudpatternis presentedwithoutlabelsisinpresentedeach figurewithoutforlabelsclarity).in each figure for clarity).
Minerals 2019, 9, 2699 of 15Minerals 2019, 9, x FOR PEER REVIEWTable 3. XRD patterns of the solid products at 200 C.MgO%9 of 15Table 3. XRD patterns of thesolid products at 200(Mg C. Al )(Si Al )O (OH)Mg3 Si2 O5 (OH)44.5 1.52.5 1.5108Ca10 Mg2 Al4 (SiO4 )5 (Si2 O7 )2 (OH)4xxxCa10Mg2Al4(SiO 4)5(Si2O7)2(OH)4 Mg3Si2O5(OH)4 (Mg4.5Al1.5)(Si2.5Al1.5)O10(OH)8xxx x x x x addition; only new phases in each sample are listed out; : existence;% means90the mole fraction of MgOx: nonexistence.100 0 MgO%10030105030705090100 70% means the mole fraction of MgO addition; only new phases in each sample are listed out; :3.4. ReactionKineticsof Alkali Recoveryexistence;x: nonexistence.The reaction kinetics has been implemented to express the alkali recovery process with CaO or3.4. Reaction Kinetics of Alkali RecoveryMgO as an addition. According to the shrinking core model (SCM) [28,29], the kinetic equation ofThe reaction kineticsimplementedto expressalkalirecoveryprocess withCaO orthe heterogeneousreaction hascanbeenbe expressedas Equation(7) theif theprocessis controlledby internalMgO as oranasaddition.to thebyshrinkingmodel (SCM) [28,29], the kinetic equation ofdiffusionEquationAccording(8) if controlledchemicalcorereaction:the heterogeneous reaction can be expressed as Equation (7) if the process is controlled by internal2diffusion or as Equation (8) if controlledchemicalka t by1 (7)α (1reaction: α)2/332kat 1 α (1 α)2/3(7)3kb t 1 (1 α)1/3(8)kbt 1 (1 α)1/3(8)where t represents the reaction time (min), α is the recovery ratio of Na2 O (%), ka is the rate constantwheret representsthe reactiontime(min),is ratethe recoveryofchemicalNa2O (%),ka is theTherateexternalconstantforthe processof internaldiffusion,andkb is αtheconstant ratiofor thereaction.for the wasprocessof internal becausediffusion,kb issystemthe rateconstantfor the chemical reaction. Thediffusionnot consideredtheandreactionwasfully ereactionsystemwasstirred. was relativelyAs shown in Figure 7, a period of time of 30 min was used becausefullythe reactionAs alkalishownrecoveryin Figure7, a periodof time ofmin wasused becausetheasreactionwas relativelyfast. Theprocessis controlledby30internaldiffusionwith CaOan additionand rnaldiffusionwithCaOasanadditiontheactivation energy is calculated to be 12.67 kJ/mol. In contrast, the recovery process with MgOandas ntrast,therecoveryprocesswithMgOasaddition is controlled by chemical reaction with an apparent activation energy of 40.99 kJ/mol whenanadditionis controlledbythanchemicalreactionan apparentactivationof diffusion40.99 kJ/molwhenthetemperatureis lower200 C,while withthis processis werthan200 ith apparent activation energy of 18.04 kJ/mol when the temperature is higher than 200 C. The supportinganapparent lementarytemperature isMaterialshigher than C. S2)Theinformationshowed theenergyrecoveryof alkaliTables200S1 andsupportinginformationshowed therecoveryratio ofalkalitimemodel(Supplementaryandthe calculationof the CaO/MgOleachingreactionwiththe versusother SCM(Figure S1) Materialsto Oleachingreactionwith the other SCMthe differences.model (Figure S1) to show the differences.Figure 7. Cont.
Minerals 2019, 9, 26910 of 15Minerals 2019, 9, x FOR PEER REVIEW10 of 15Figure 7. Kinetic fitting of (a) the plots of [1 23 α (1 α)2/3 ] versus time for CaO, (b) ln(Ka ) versus2/3] fortemperaturefor CaO,(c) theplots[1 of(1 [1 α)21/3timeMgOlowerC, (d)Figure 7. Kineticfittingof (a)theofplotsα ] versus(1 α)versustimefor thanCaO,200(b) ln(Ka) ln(Kversusa)32 C, (e) the plots of [1 α (1 α)2/3 ] versus time re for CaO, (c) the plots of [1 (1 α) ] versus time for3 MgO lower than 200 C, (d) C and (f) ln(Ka) versus temperature for MgO higher than 2MgOhigherthan200 (1C. α)2/3] versusln(Ka) versus temperature for MgO lower than 200 C, (e) the plots of [1 α2003time for MgO higher than 200 C and (f) ln(Ka) versus temperature for MgO higher than 200 C.Thealkali recovery process can be principally divided into the following five steps: (1) thehydration of CaO/MgO; (2) the dissociation of Ca(OH)2 /Mg(OH)2 ; (3) the diffusion of Ca2 /Mg2 fromThe alkali recovery process can be principally divided into the following five steps: (1) thethe bulk solution to the Na detached site of cancrinite; (4) the ion exchange between Ca2 /Mg2 andhydrationof CaO/MgO; (2)the dissociation of Ca(OH)2/Mg(OH)2; (3) the diffusion of Ca2 /Mg2 Na ; (5) the diffusion of Na to thebulk solution [28]. It can be speculated that the alkali recoveryfrom the bulk solution to the Na detached site of cancrinite; (4) the ion exchange between Ca2 /Mg2 process withCaOasanadditionmaybe controlled by the third step or the fifth step in this studyand Na ; (5) the diffusion of Na to the bulk solution [28]. It can be speculated that the alkalibased on a consideration of the hydration process, the obtained rate equation and the activationrecovery process with CaO as an addition may be controlled by the third step or the fifth step inenergy. In contrast, the process with MgO as an addition may be mostly controlled by the first stepthis study based on a consideration of the hydration process, the obtained rate equation and theat low temperatures, and the rate equation together with the activation energy is consistent withactivation energy. In contrast, the process with MgO as an addition may be mostly controlled by thethe results of MgO hydration under similar conditions [27]. Therefore, as the MgO hydration ratefirst step at low temperatures, and the rate equation together with the activation energy isincreases with increasing temperature, the recovery ratio of Na2 O with pure MgO as an addition alsoconsistent with the results of MgO hydration under similar conditions [27]. Therefore, as the MgOincreases significantly.hydration rate increases with increasing temperature, the recovery ratio of Na2O with pure MgO asAs shown above, the alkali recovery process with MgO as an addition was controlled by internalan addition also increases significantly.diffusion, rather than by reaction at higher temperatures. Besides, for 30 minutes the extraction ofAs shown above, the alkali recovery process with MgO as an addition was controlled byalkali using MgO (Figure 7e) was much lower than when using CaO (as compared to Figure 7a),internal diffusion, rather than by reaction at higher temperatures. Besides, for 30 minutes theand it was because the hydration of MgO was relatively slow compared with CaO, so there was anextraction of alkali using MgO (Figure 7e) was much lower than when using CaO (as compared toinduction period when using MgO. Moreover, as the solubility of calcium hydroxide is higher thanFigure 7a), and it was because the hydration of MgO was relatively slow compared with CaO, sothat of magnesium hydroxide, the hydrolysis rate of magnesium hydroxide may be slower than thatthere was an induction period when using MgO. Moreover, as the solubility of calcium hydroxideof calcium hydroxide. Theoretically, the cancrinite is hexagonal with the space g
spectroscopy (FTIR, T27-Hyperion-Vector22, Bruker, Bremen, Germany). The surface morphology of samples was detected by scanning electron microscopy (SEM, JSM-7001F, JEOL, Tokyo, Japan) with energy dispersive X-ray spectroscopy (EDS, Inca X-MAX, Oxford, UK). 3. Results and Discussion 3.1. Characterization of Bayer Red Mud