Transcription
PROF. JUN-MO KIM (Orcid ID : 0000-0002-6934-398X)Accepted ArticleDR. JON SLATE (Orcid ID : 0000-0003-3356-5123)Article type: Resource ArticleA high density SNP chip for genotyping great tit (Parus major) populations andits application to studying the genetic architecture of exploration behaviourJ-M Kim1,6, AW Santure1,7, HJ Barton1, JL Quinn2, EF Cole3, Great Tit HapMap Consortium, MEVisser4, BC Sheldon3, MAM Groenen5, K van Oers4 & J Slate1Addresses1. Department of Animal & Plant Sciences, University of Sheffield, Sheffield, S10 2TN, UK2. School of Biological, Earth and Environmental Science (BEES), University College Cork, DistilleryFields, North Mall, Cork, Ireland3. Edward Grey Institute, Department of Zoology, University of Oxford, Oxford, OX1 3PS, UK4. Department of Animal Ecology, Netherlands Institute of Ecology (NIOO-KNAW), Wageningen,Netherlands5. Wageningen University and Research - Animal Breeding and Genomics, Netherlands6. Department of Animal Science and Technology, Chung-Ang University, Anseong, Gyeonggi-do, 456756, Republic of Korea.7. School of Biological Sciences, University of Auckland, Private Bag 92019, Auckland 1142, NewZealandKeywords: GWAS, Axiom, exploration behaviour, personality, CNVCorresponding author: Jon Slate (j.slate@sheffield.ac.uk)This article has been accepted for publication and undergone full peer review but has notbeen through the copyediting, typesetting, pagination and proofreading process, which maylead to differences between this version and the Version of Record. Please cite this article asdoi: 10.1111/1755-0998.12778This article is protected by copyright. All rights reserved.
AbstractAccepted ArticleHigh density SNP microarrays (‘SNP chips’) are a rapid, accurate and efficient method forgenotyping several hundred thousand polymorphisms in large numbers of individuals. WhileSNP chips are routinely used in human genetics and in animal and plant breeding, they areless widely used in evolutionary and ecological research. In this paper we describe thedevelopment and application of a high density Affymetrix Axiom chip with around 500 000SNPs, designed to perform genomics studies of great tit (Parus major) populations. Wedemonstrate that the per-SNP genotype error rate is well below 1% and that the chip canalso be used to identify structural or copy number variation (CNVs). The chip is used toexplore the genetic architecture of exploration behaviour (EB), a personality trait that hasbeen widely studied in great tits and other species. No SNPs reached genome-widesignificance, including at DRD4, a candidate gene. However, EB is heritable and appears tohave a polygenic architecture. Researchers developing similar SNP chips may note: (i) SNPspreviously typed on alternative platforms are more likely to be converted to working assays,(ii) detecting SNPs by more than one pipeline, and in independent datasets, ensures a highproportion of working assays, (iii) allele frequency ascertainment bias is minimised byperforming SNP discovery in individuals from multiple populations and (iv) samples with thelowest call rates tend to also have the greatest genotyping error rates.IntroductionIt is now becoming commonplace to sequence and assemble the genomes of organisms thathave been the focus of ecological research but are not classical genetic model organisms(Brawand et al. 2014; Colbourne et al. 2011; Ellegren et al. 2012; Hu et al. 2011; Jones et al.2012; Lamichhaney et al. 2015; Soria-Carrasco et al. 2014). While assembled genomes areundoubtedly essential tools for understanding topics in evolutionary and ecological genetics,in taxa with moderate to large genomes the cost of sequencing the full genomes of hundredsor thousands of individuals remains prohibitive for the majority of laboratories, and beyondthe budget of even very large grants. Thus, analytical techniques that require large samplesizes, such as quantitative trait locus (QTL) linkage mapping / genome-wide associationstudies (GWAS) (Visscher et al. 2017), molecular quantitative genetics (Gienapp et al. 2017a;This article is protected by copyright. All rights reserved.
Jensen et al. 2014) and studies that utilise realised relatedness / inbreeding coefficientsAccepted Article(Powell et al. 2010) are reliant on alternative technologies. Broadly, these can be categorisedinto two approaches; (i) genotyping-by-sequencing (GBS) methods (Davey et al. 2011) such asrestriction-site associated sequencing (RAD-seq) (Hohenlohe et al. 2010) and double-digestRAD-seq (ddRAD-seq) (Peterson et al. 2012) and (ii) SNP microarray (‘SNP chip’) methods(Spencer et al. 2009; Syvanen 2001), where a set of known SNPs are probed on chipsmanufactured by providers such as Illumina (Shen et al. 2005) and Affymetrix (Matsuzaki etal. 2004).GBS-approaches while perhaps cheaper, are more technically demanding, both in terms oflaboratory work, and in post-sequencing processing of NGS data (Bajgain et al. 2016; Miller etal. 2012; Robledo et al. 2017). Furthermore, the sites that are typed are typically not knownin advance, and call rates can vary widely between different SNPs. SNP chips are moreexpensive, but tend to have higher call rates per SNP, and specific target SNPs can beincluded in chip design. In addition, the same SNPs are typed in every individual, which is notthe case for GBS approaches (Bajgain et al. 2016). A disadvantage of SNP chips isascertainment bias (Bajgain et al. 2016; Miller et al. 2012). Because SNPs have to bediscovered before they are designed to be on a chip, there is usually bias towards theinclusion of SNPs with higher minor allele frequencies (MAF) on the chip. For some types ofanalyses (e.g. GWAS) this is not necessarily a disadvantage, because statistical power isgreater for SNPs with higher MAF. However, ascertainment bias is clearly a problem for teststhat require an accurate description of the site frequency spectrum in different genomicregions (Albrechtsen et al. 2010) e.g. tests that aim to detect signatures of selection such asTajima’s D. Thus, the optimal method for genotyping many individuals can depend on thequestion being addressed, the laboratory and bioinformatics experience of the user and thelaboratory budget.The great tit (Parus major) is a model vertebrate system in evolutionary ecology because thispasserine bird readily breeds in nest boxes (making it possible to identify parents andoffspring and thus build pedigrees), it has a short generation time and large broods, and it isThis article is protected by copyright. All rights reserved.
widely distributed across Europe, Western Asia and parts of the Middle East (Perrins 1979).Accepted ArticleLongitudinal studies (Kluijver 1951; Lack 1964) of great tits have informed researchers aboutclassic topics in evolutionary and behavioural ecology (Lack 1968) including mating systemsand reproductive decisions (Smith et al. 1989), the frequency (Harvey et al. 1979) andimportance of dispersal (Garant et al. 2005; Postma & van Noordwijk 2005), adaptation toclimate change (Charmantier et al. 2008; Nussey et al. 2005; Visser et al. 1998), the study ofpersonality traits (Dingemanse et al. 2004; Groothuis & Carere 2005; Van Oers & Naguib2013), innovativeness and cognition (Cole et al. 2012; Quinn et al. 2016; Titulaer et al. 2012),social learning (Aplin et al. 2015; Aplin et al. 2012), and understanding how quantitativegenetic variation is maintained in natural populations (McCleery et al. 2004). In more recentyears, great tits have become the focus of molecular genetic studies exploring the geneticarchitecture of quantitative traits (Gienapp et al. 2017b; Robinson et al. 2013; Santure et al.2013; Santure et al. 2015), phylogeography (Kvist et al. 2003; Lemoine et al. 2016), fine-scalegenetic structure and dispersal (Garroway et al. 2013; Radersma et al. 2017), the efficacy,nature and relative occurrence of positive and purifying selection (Corcoran et al. 2017;Gossmann et al. 2014) and immunogenetics (Sepil et al. 2013; Sepil et al. 2012). Much of thiswork has been facilitated by a SNP chip containing probes for around 10,000 SNPs, of whicharound 6,000 are polymorphic and reliably scoreable (Van Bers et al. 2012). This ‘10K chip’has been used in QTL and GWAS mapping studies and to construct a great tit linkage map(van Oers et al. 2014) which led to insights into the nature of sex-differences inrecombination rate (heterochiasmy). The linkage map was in turn used to help assemble thegreat tit genome (Laine et al. 2016).While the 10K SNP chip has helped provide insight into the architecture of some quantitativetraits, it also suffers from some important limitations (Santure et al. 2015). The mostimportant of these is that the marker density ( 1 SNP per 20Kbp) is too low for most of thegenome to be adequately ‘tagged’ by typed SNPs that are in strong linkage disequilibrium(LD) with untyped sites. Furthermore, molecular quantitative genetic approaches such aschromosome partitioning (Yang et al. 2011) or regional heritability mapping (Nagamine et al.2012), where markers are used to measure between-individual relatedness in specificgenomic regions, typically require a much higher marker density than is afforded by the 10Kchip (Berenos et al. 2014).This article is protected by copyright. All rights reserved.
To overcome the low power of the 10K chip, and to provide better resolution in associationAccepted Articlestudies, outlier detection tests and molecular quantitative genetic analyses we havedeveloped a high density (HD) chip with probes for over 600 000 SNPs. In this paper wedescribe the development of this great tit HD SNP chip. The chip can also be used to detectthe presence of structural variation or copy number variants (McCarroll & Altshuler 2007) inthe great tit genome. We demonstrate an application of the HD chip, using a behaviouraltrait, to showcase how the genetic architecture of phenotypic variation can be estimated. It ishoped that the methods and lessons described in this paper will serve as a useful guide toresearchers developing high density SNP chips in other organisms.MethodsDNA sequencingTo identify SNPs to include on the chip, whole genome resequencing was performed on 30birds. Ten of the birds were from the long term study population at Wytham Woods, Oxford,UK (51 46’ N, 1 20’ W), and the remaining 20 were from locations across a wide area ofEurope (Fig. S1), collected as part of the Great Tit HapMap Project. The sequencing isdescribed elsewhere (Laine et al. 2016), but briefly, samples were sequenced on an IlluminaHiSeq 2000 platform at The Genome Institute, Washington University. Sequencing waspaired-end, with insert sizes 300 bp and a read length of 100 bp. Each bird was sequenced to 10x coverage. Note that one of the samples used in this paper, from near to Zurich inSwitzerland (population #27 in Fig. S1), was not used in the genome assembly paper (Laine etal. 2016), because coverage was lower than for other samples ( 5x). The Zurich sample isincluded in the NCBI sequence read archive submission (SRP066678).SNP DiscoverySNP discovery was performed in several steps, with the aim of identifying markers that arepolymorphic across multiple great tit populations, with minimal ascertainment bias towardspopulations where the SNPs were initially discovered. Paired-end reads were filtered andThis article is protected by copyright. All rights reserved.
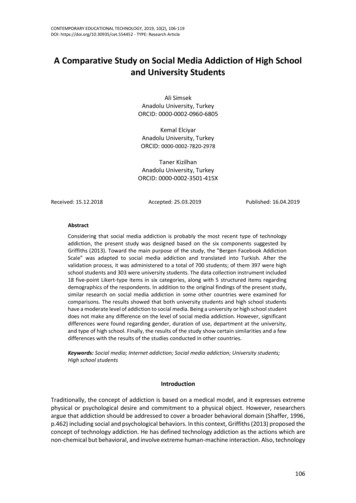
trimmed with the FASTX-Toolkit (http://hannonlab.cshl.edu/fastx toolkit/) using a length ofAccepted Article80 bp and quality score of 20 as minimum cut-off scores to remove low-quality reads. Theremaining reads from each individual were mapped onto the great tit reference genomev1.03 with the MEM algorithm of the Burrows-Wheeler Aligner (Li & Durbin 2009). Thealigned sequence reads on the genome were stored as individual BAM files. Using VCFtools(Danecek et al. 2011), the BAM files were filtered to a minimum quality score of 20 and readdepth of 5.Following alignment of reads to the great tit genome, a combination of different SNPdiscovery algorithms and different strata of the dataset were used, summarised in Figure 1.SNPs were independently called using the ANGSD v0.549 (Korneliussen et al. 2014),SAMTools v0.1.19 (Li 2011; Li et al. 2009) and GATK v2.4 (DePristo et al. 2011; McKenna et al.2010) packages. Parameter settings are reported in Table S1. SNPs were called either fromthe 10 UK birds, the 20 mainland European birds, or the combined dataset of 30 birds. SNPscalled from the different software/datasets were then compared (Figure 1) and a set of 1.4M SNPs that were common to all SNP discovery softwares and all datasets wereconsidered for inclusion on the SNP chip. VCFtools was used to filter out SNPs with minorallele frequency (MAF) less than 0.05 and call quality less than 50. SNPs that were predictedto be within 30 bp of each other were filtered out because it was likely that the presence ofone SNP would adversely affect the ability to successfully genotype the other(s), due toinefficient or biased hybridisation of allele-specific oligonucleotides. SNPs prone to this formof possible typing error are known as Off Target Variants (OTV) in the Affymetrix genotypecalling workflow (see below). A total of 1,213,160 SNPs passed all of these filtering criteria(Figure 1).SNP selectionThe SNP discovery phase of the work identified more SNPs than could be included on thechip. To prioritise which SNPs to use on the chip, the following criteria were used:1) ‘Top priority’ SNPs were those that had been successfully typed on the lower density10K chip described in earlier work (Van Bers et al. 2012) or had been discovered inThis article is protected by copyright. All rights reserved.
the SNP discovery pipeline described above and were discovered during theAccepted Articleconstruction of the earlier 10K chip but not included on it (Santure et al. 2011; vanBers et al. 2010). 6,773 SNPs that were typed on the original chip and a further 9,713SNPs that were discovered but not included on the 10K chip were included in the ‘Toppriority’ set.2) A list of candidate genes were identified that could potentially explain variation inecologically relevant traits such as personality traits (Fidler et al. 2007; van Oers et al.2004) and timing of breeding (Visser et al. 2003). A list of candidate genes andputatively associated traits is provided in Table S2. At the time the chip was beingdesigned, the great tit genome was not annotated. Therefore, to identify the locationof the candidate genes on the great tit genome, the cDNA sequence of the candidategene in zebra finch (Taeniopygia guttata), another passerine, chicken (Gallus gallus),or if none of those were available, human or mouse, was downloaded from NCBI andthe location on the great tit genome was identified by BLAST search. The start andend point of the gene was identified and SNPs were considered for inclusion if theywere within any part of the gene. 654 (of which 28 were also ‘Top Priority’ SNPs) from110 genes were chosen for inclusion on the chip.3) The remaining SNPs were selected based on how likely they were to be convertible toa working and scoreable assay on the chip. The list of SNPs and their flankingsequences were sent to the Affymetrix bioinformatics team who used their in silicodesign tool to model the probability (termed the ‘P convert design score’) of the SNPconverting to a working assay. The software uses the SNP bases and its flankingsequence, and considers factors such as GC content and the predicted amount ofnon-specific hybridisation to other (non-target) genomic regions. Following thisprocess, SNPs with a P convert design score 0.69 were retained for inclusion on thechip. This threshold compares favourably to those used in the design of HD chips forchicken (Kranis et al. 2013), catfish (Liu et al. 2014), and water buffalo (Iamartino etal. 2017), where thresholds of 0.20, 0.50 and 0.60 were used respectively.This article is protected by copyright. All rights reserved.
An Axiom myDesign high density chip was manufactured by Affymetrix. A total of 610 970Accepted ArticleSNPs were included on the final design, of which 17 122 were from criteria 1 or 2 and theremainder were from criteria 3. The genomic distribution of attempted SNPs are described inTable S3 and Fig. S1.GenotypingGenotyping was performed on a Gene Titan platform at Edinburgh Genomics. A total of 21plates, each with up to 96 samples, were typed (2016 available slots). Across the 21 plates, 9negative controls were included. All plates contained at least one duplicate sample to aidwith estimation of error rate. 1073 typed samples were from the Wytham Woods population.The remainder of the total 2007 birds came from a number of study sites (Table 1, Fig. S1)from across the species range in Europe and Asia, and were provided by members of theGreat Tit HapMap Consortium, either as pre-extracted DNA, or more usually as bloodsamples in Queen’s storage buffer or ethanol. DNA was extracted using an ammoniumacetate precipitation method (Bruford et al. 1998) and DNA quality and quantity measuredusing picogreen on a fluorometer. 1,696 samples were at a concentration exceeding 50ng/ul,while 89 were at concentrations lower than 20ng/ul. All except 33 samples passed themanufacturer’s recommendation of 200ng of DNA. 13 Japanese tit (Parus minor) birds weregenotyped, as well as 9 putative P. major / P. minor hybrids. Abel, the male used as thereference bird for the great tit genome assembly (Laine et al. 2016), was typed four times(two replicates on two different plates). SNP genotype calling was performed using thePs Metrics and Ps Classification functions within the Affymetrix Axiom Analysis Suite1.1.0.616. Samples with dish QC 0.82 or call rates 0.95 were discarded, as were SNPs withcall rates 0.97 or those identified as containing Off-Target Variants (OTVs).This article is protected by copyright. All rights reserved.
Quantifying Genotyping Error RateAccepted ArticleGenotyping errors were estimated in two ways. First, the replicated samples meant that theproportion of inconsistent genotypes between different typing attempts of the same birdcould be estimated. The error rate was obtained from the Z2 score - the proportion of SNPsat which two individuals (replicates) share both alleles identically-by-descent - reported bythe --genome command in Plink 1.9 (Chang et al. 2015). Second, genotypes from the SNPchip were compared with the whole genome resequencing SNP calls for 28 birds that weresuccessfully genotyped and sequenced to 10x coverage (Laine et al. 2016). Note thatdiscrepancies between chip and resequencing SNP genotypes can arise either because theSNP chip genotype is wrong, or because the SNP call from the resequencing is wrong.Therefore, comparison between the resequencing and the SNP chip genotyping provides anupper limit on the genotyping error on the SNP chip. Concordance between the chip and theresequencing data was determined using the GenotypeConcordance tool implementedwithin GATK, after SNPs with Genotype Quality Scores 30 were filtered from theresequencing dataset.Copy number variant (CNV) detectionCNVs were detected using the PennCNV software (Wang et al. 2007). PennCNV input files ofthe 996 birds from the Wytham Woods population were prepared using the Axiom AnalysisSuite’s CNVTool and probe intensities from all SNPs. PennCNV uses two parameters from theSNP genotyping, the logR ratio and the B allele frequency, to identify genomic segmentscontaining SNPs indicative of copy number variation. The logR ratio is a measure of signalintensity. SNP assays in individuals with extra copies of a genomic region (duplications)should generate higher intensity signals, while SNPs in individuals with fewer than two copiesof a genomic segment (deletions) should generate lower intensity signals. The B allelefrequency measures the relative signal intensity of the two possible alleles at each SNP.Ratios that are inconsistent with allele call ratios of 2:0 (i.e. A allele homozygote), 1:1 (i.e.heterozygote) or 0:2 (i.e. B allele homozygote) are indicative of departures from two copiesof that nucleotide (i.e. the normal diploid state) being present in the sample. For example, anindividual with a duplication at a CNV site on one chromosome, would have three copies inThis article is protected by copyright. All rights reserved.
total, meaning the ratios of alleles A:B could be 1:2 or 2:1, which is impossible when twoAccepted Articlecopies are present. CNVs called by PennCNV were retained and converted to Plink g/penncnv/download/penncnv to plink.pl).penncnv to plinkTheplinkcommands --cfile --cnv-overlap and --cnv-seglist were used to generate a list of all CNVs,identify overlapping CNVs, estimate CNV frequencies and summarise the CNVs present ineach individual (.cnv.indiv file).Additional CNV analyses included (i) an examination of two replicates of the referencegenome bird, Abel, and (ii) CNV calling using nine father-mother-offspring trios from theWytham Woods population. As with the analysis of all Wytham Woods birds, the PennCNVcommand detect cnv pl was used, only with the -trio argument included. In principle,detected CNVs are more likely to be reliable calls if they are observed to be inherited in aMendelian fashion.Genetic architecture of a personality traitThe chip was used to explore the genetic architecture of Exploration Behaviour in a novelenvironment (EB), a personality trait linked to aggression, risk-taking and dispersal in greattits (Quinn et al. 2009). EB is known to be heritable (Dingemanse et al. 2004; Drent et al.2003; Quinn et al. 2009; Santure et al. 2015) and it has also been the focus of candidate genestudies, especially at the Dopamine D4 receptor (DRD4) gene (Fidler et al. 2007; Korsten et al.2010), following the first report that DRD4 could affect novelty-seeking behaviour in humans(Ebstein et al. 1996). The protocol for measuring EB is described in detail elsewhere (Cole &Quinn 2014; Quinn et al. 2009). Briefly, wild birds were captured during February-March(2005) or September-March (2006-2009) and assayed in a novel environment room atWytham Woods field station. For the purposes of the downstream genetic analyses we usedthe same measure of EB as that used in previous studies. Briefly, the first principalcomponent (PC1) of 12 behavioural measures was treated as the EB score. PC1 was squareroot transformed prior to genetic analysis and a single value for each individual was obtainedby fitting a linear mixed model with the terms ID, year, days after September 1st, and assaynumber of that individual all included as predictors. Details are described elsewhere (QuinnThis article is protected by copyright. All rights reserved.
et al. 2009). Several aspects of EB genetics were explored. First, we performed a genome-Accepted Articlewide association study (GWAS) using the Grammar method (Aulchenko et al. 2007a),implemented in GenABEL (Aulchenko et al. 2007b). Grammar accounts for the possibility oftest statistic inflation caused by relatives in the dataset by fitting a realised genome-widerelationship matrix estimated from the SNP data as a random effect. The residual from therandom model was used as the phenotype. In addition, genomic correction was performedby estimating lambda, the slope of observed chi square values on expected chi square values,and dividing all tests statistics by lambda before estimating nominal P-value. Genome-widestatistical significance was estimated by permutation test, using the GenABEL mmscorecommand and 1000 permutations of the data. The GWAS was performed on a total of 415birds from Wytham Woods. All Z-linked SNPs and any autosomal SNPs with MAF 0.05 orsignificant departures from Hardy-Weinberg Equilibrium (P 1x10⁻⁵) were filtered from thedataset leaving a total of 459 502 autosomal SNPs.In addition to the GWAS, an additional analysis of the same dataset fitted all SNPssimultaneously, in one model. Here, the objective was to estimate the proportion ofphenotypic variation explained by each SNP, in order to understand aspects of the traitarchitecture such as the heritability, the number of SNPs in linkage disequilibrium with causalvariants and the distribution of effect sizes of those SNPs. The BayesR method (Erbe et al.2012), whereby it is assumed that the SNPs causing phenotypic variance are drawn from amixture of different effect size distributions, was used to model the genetic architecture ofEB. The BayesR package (Moser et al. 2015) was used to run the analyses, with defaultsettings of 4 distributions, with mean effect sizes of 0.01, 0.001, 0.0001 or 0 of thephenotypic variation. The program was run for 50 000 iterations of an MCMC chain, with thefirst 20 000 iterations treated as burn-in, and every 10th chain after that being sampled,giving a total of 3000 samples of the chain. Priors for VA and VE were specified using aninverted chi-squared distribution with scale parameters of 0.033 and 0.117 respectively, eachwith 4 degrees of freedom. These values give a prior heritability of around 0.20 which isconsistent with pedigree-based estimates of EB in the Wytham Woods population (Quinn etal. 2009; Santure et al. 2015). Note that setting the priors so that VA and VE were identical(i.e. the heritability was 0.5) gave almost identical posterior estimates, so the geneticarchitecture does not appear to be sensitive to the priors.This article is protected by copyright. All rights reserved.
ResultsAccepted ArticleSummary StatisticsFollowing genotype calling and quality control steps, a total of 1 846 samples typed at 502685 SNPs were retained for analysis. A summary of the different types of SNP category isprovided in Table 2. Samples that contained less than the recommended 200ng of DNA weremore likely to fail than those with 200ng of DNA; 9/33 failures versus 140/1962 failures(Fisher’s Exact Test: Odds ratio 4.87, 95% CI 1.95-11.12, P 0.0005). However, amongsamples that passed quality control, there was no relationship between the call rate and theamount of DNA present in the sample (F1,1844 0.942, P 0.33). SNPs that had beenpreviously typed on the 10K chip were more likely to be converted to a successfully typedSNP, and to pass QC checks. For previously typed SNPs the conversion rate was 5924/6773(0.87) compared to 496 826 / 604 197 (0.82) for unvalidated SNPs; Fisher’s Exact Test oddsratio 1.51, 95% CI 1.40-1.62, P 0.0006. However, SNPs that were discovered during boththe construction of the 10K chip and of the HD chip but were not typed on the 10K chipactually had a lower conversion success rate, 7807/9713 (0.80), than SNPs that were onlydiscovered during HD chip construction, 489 019 / 594 484 (0.82); Fisher’s Exact Test: Oddsratio 0.88, 95% CI 0.84-0.93, P 2.0 x 10⁻⁶. Thus, the untyped SNPs from the low densitychip were less reliable than the newly discovered SNPs.Genotyping Error RateAmong 30 individuals (resulting in 65 pairwise comparisons, due to some birds being typed 2 times) that were repeat genotyped on the SNP chip, there was a per SNP genotyping errorrate of 0.004. If comparisons were restricted to the 56 comparisons where both samples hadcall rates 0.98, the error rate was 0.002, indicating that individuals with lower call ratestended to be more error prone. The discordance in SNP calls between the chip and theresequenced data was 0.01, although this was apparently mostly driven by errors in thesequencing data, because the degree of discordance is negatively correlated with the depthof the genome coverage, which varies between 4.5x and 13.8x (see Fig. S3).This article is protected by copyright. All rights reserved.
Resequencing data predict SNP chip allele frequenciesAccepted ArticleThe minor allele frequencies (MAFs) of each SNP estimated from the 30 resequenced birdswere compared to the MAFs estimated from the 996 birds genotyped in the Wytham Woodspopulation. Notably, there was a very strong positive relationship between the minor allelefrequencies in the two datasets (Fig. S4A; HD Chip MAF 0.016 0.918*ReSeq MAF, F1,480756 1.65*106, r2 0.77, P 2.2x10⁻¹⁶). Thus, the MAFs estimated from the resequencing datafrom 30 birds sampled across Europe are a reliable predictor of the MAFs obtained by typinga much larger sample from a single population on the HD chip. Similar analyses usinggenotyped birds from two randomly selected mainland European populations showed thesame pattern (Fig. S4B, S4C); Montpellier, HD Chip MAF 0.023 0.867*ReSeq MAF, F1,480756 8.16*105, r2 0.63, P 2.2x10⁻¹⁶, 50 individuals; Gotland, HD Chip MAF 0.022 0.874*ReSeq MAF, F1,480756 8.69*105, r2 0.64, P 2.2x10⁻¹⁶, 47 individuals. The relationshipwas stronger for the Wytham Woods birds than the two other populations, but this is largelybecause the HD chip MAFs were estimated from more birds in the Wytham Woods dataset,and are therefore presumably estimated more accurately. A similar analysis conducted on 50randomly chosen birds from Wytham Woods produced a relationship that was only slightlystronger than that seen in the Montpellier and Gotland populations (Fig. S4D; HD Chip MAF 0.023 0.879*ReSeq MAF, F1,480756 9.76*105, r2 0.67, P 2.2x10⁻¹⁶). Thus, the strongrelationship between SNP chip MAF and resequencing is not simply an artefact of 10 of the30 resequenced birds being from Wytham Woods. The mean minor allele frequencies werevery similar in the three populations (Wytham 0.280, Montpellier 0.273, Gotland 0.274).CNV analysisA total of 41 526 putative CNVs (34,947 with PennCNV confidence scores 5) werediscovered in 996 birds from Wytham Woods. The great majority (37 419 or 90.1%) of CNVswere single copy duplications. Birds had a mean (SD) of 41.9 (160.9) CNVs each, spanning amean (SD) distance of 3.19 (16.22) Mbp. However, there was
2. School of Biological, Earth and Environmental Science (BEES), University College Cork, Distillery Fields, North Mall, Cork, Ireland 3. Edward Grey Institute, Department of Zoology, University of Oxford, Oxford, OX1 3PS, UK 4. Department of Animal Ecology, Netherlands Institute of Ecology (NIOO-KNAW), Wageningen, Netherlands 5.