Transcription
Report BackgroundThe Pennsylvania Department of Drug andAlcohol Programs compiles annually anassessment and report on the impact ofinteractive gaming in Pennsylvania to meetthe requirements set forth in PennsylvaniaAct 42 of 2017 that legalized interactivegaming in the Commonwealth ofPennsylvania. This was the first year for thecompletion of the assessment and reportcompilation.This report assists theDepartment in fulfilling its mission to assessand address how gambling behaviors impactcompulsive and problem gambling withinthe Commonwealth. The funding for thisreport is provided by law through thePennsylvania Gaming Control Board fromrevenues of the interactive gaminglicensees.The Pennsylvania Department of Drug andAlcohol Programs contracted with ThePennsylvania State University to conduct thisyearly assessment of interactive gaming inthe Commonwealth.The team ofresearchers is led by Dr. Glenn Sterner, anaccomplished assistant professor of criminaljustice with experience assessing theimpacts of compulsive behaviors withincommunities across the Commonwealth,and this assessment is administrativelyhoused within the Criminal Justice ResearchCenter in the College of the Liberal Arts. Dr.Mikael Ahlgren, Director of GamingInitiatives for the University, providedsubject matter expertise and context fromhis distinguished career associated with thegaming industry. Dr. Miranda Kaye, Directorof the Social Science Research Institute’sSurvey Research Center, oversaw thecollection of the data through arepresentative telephone survey.Dr.Raeven Chandler, Director of thePennsylvania Population Network, providedanalytical support for the report. Finally, thisassessment was supported by several otherkey faculty, researchers, and staff includingDr. Joshua Rosenberger, Diana Crom,Madison Miller, and Dennis Dozier.
Report SummaryInteractive Gaming, also referred to asonline gambling or iGaming, became legal inPennsylvania in 2017 through the PA Act 42of 2017. Licenses were first granted inPennsylvania to conduct interactive gamingin 2018. The addition of 7 new interactivegaming sites in Fiscal Year 2020/2021brought the Pennsylvania total to 19. These19 sites were operated by 10 differentcertificate holders. In terms of economicimpact, interactive gaming generated over 372 million in direct gaming taxes(Pennsylvania Gaming Control Board, 2021).Furthermore,onlinesportsbettingcontributed over 260 million dollars in taxrevenues in Fiscal Year 2020/2021(Pennsylvania Gaming Control Board, 2021).The magnitude of this number is bestunderstood by noting that traditional retailor ‘brick and mortar’ sports books onlygenerated slightly more than 48 million intax revenues. The latest revenue reportsgenerated by the PA Gaming Control Boardindicated continued increased revenue ofinteractivegamingacrosstheCommonwealth.those who are engaged in this practice inPennsylvania and should not be used tomake inferences about any other gamblingbehaviors.According to the results of the survey,approximately 1 in 10 Pennsylvanians(11.1%) engaged in interactive gaming (95%CI 0.5 0.028 [11.571, 11.628]; Margin ofSampling Error [MOSE] 3%), whileapproximately 28% i of Pennsylvaniansreported any gambling activity (which mayinclude interactive gaming) in the past 12months according to the Behavioral RiskFactorSurveillanceSystem(BRFSS)(Pennsylvania Department of Health, 2021).Revenue generation associated withinteractive gaming is one possible indicatorof activity trends. However, it remainsunclear if this is due to an increase inindividual spending or an increase inindividual participation in interactivegaming, or potentially both. To begin toanswer this question, this report providesthe results from analyses on data collectedfrom a representative sample ofPennsylvanians from 2020-2021. The resultsprovide insight into interactive gaming andPage 1
Interactive Gaming BehaviorsThis section describes the demographics ofthose who participate in interactive gamingin Pennsylvania as well as their gamblingbehaviors. This section helps to understandmore about the types of Pennsylvanians whoare engaged in these activities.11.1% of Pennsylvaniansparticipate in interactive gamingWithin Pennsylvania, 11.1% of residentsindicated they participated in interactivegaming within the past year. The averageage of those engaging in interactive gamingis 38 years, and their average householdincome is 73,302. Men (67.8%) are morelikely than women (31.3%) to be engaged inthis type of gambling. Interactive gamingparticipants are most likely to be white(73.4%). They are more likely to live within ametropolitan county (72.9%) than anonmetropolitan county (27.1%) ii. Table 1summarizes additional characteristics ofthose engaged in interactive gaming.Table 1: Pennsylvania Interactive Gaming Demographic StatisticsDemographic CategoryGenderManWomanOtherRace/EthnicityAfrican American/BlackAmerican Indian/Alaska NativeAsianHispanic/LatinoWhiteSome Other RaceMarital StatusMarried/Living with PartnerDivorcedSeparatedWidowedSingle/Never %3.2%41.5%5.1%1.6%1.6%44.5%Demographic CategoryPercentCounty Metro ment StatusFull TimePart TimeSelf EmployedRetiredStudentOtherEducationHigh School or LessSome CollegeAssociate DegreeBachelor’s DegreeAbove Bachelor’s DegreePage .9%
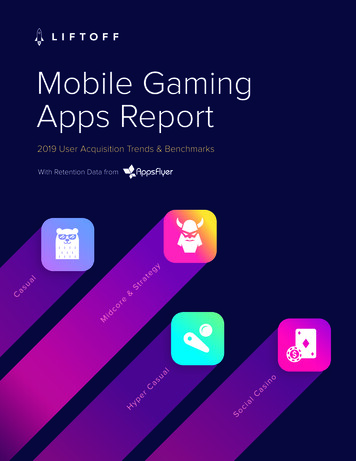
Figure 1: Participation in Types of Interactive GamingThose who engage in interactive gamingnoted they were spending on average about5.8 hours across 1.4 days in a typical weekengaged in online gambling. Individualswere spending 219 per week on interactivegambling on average. Nearly half (43.9%) ofthose engaged in interactive gaming preferthis type of gambling over all other types.Many individuals are utilizing this interactivegaming as a social experience, 45.2% areplaying online games with friends or othersocial acquaintances.Among those engaged in interactive gaming,the most popular type of gaming is sportsbetting (47.7%); followed by table games likeroulette, baccarat, blackjack, and craps(40.6%); fantasy sports betting (29.0%); Slotmachines (28.8%); iLottery (20.7%); Poker(16.4%); and other types of online gambling(9.8%). These results are shown in Figure 1.A small minority of individuals engaged ininteractive gaming indicated they alsoparticipated in unsanctioned, illegal onlinegambling. This included offshore onlinesports books (3.6%), offshore online pokersites (4.2%), offshore online casinos (3.5%),and some other online unapprovedgambling (4.5%). The majority (76.0%)indicated they were not engaged in anyunsanctioned gambling.Page 3
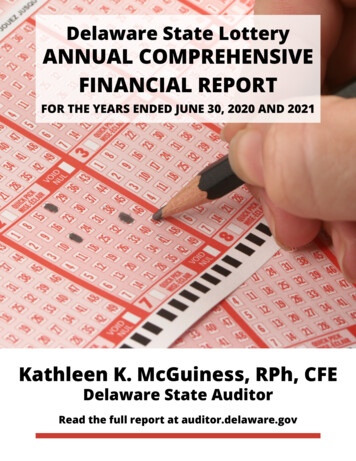
Over two-thirds (68.6%) of those whoengage in interactive gaming are alsoparticipating in gambling through in personexperiences. The most popular method isthrough the Pennsylvania lottery (45.9%),followed by Pennsylvania-based casinos(30.8%), Pennsylvania lottery instant scratchoffs (30.5%), fantasy sports leagues (25.3%),private lottery or strip tickets (21.8%),sporting events (15.5%), casinos outside ofPennsylvania (15.3%), private poker or cardgames (12.8%), horse racetrack or off-trackbetting (7.3%), bingo (6.02%), cash bashes(5.8%), or some other way (1.0%). Theseresults are found in Figure 2.Figure 2: Participation in In-Person GamblingPage 4
Problem Gambling BehaviorsProblem gambling remains a concern for thispopulation; due to the private nature of thelocation for gambling it may be more difficultto identify a need for intervention. Only2.1% of those engaged in interactive gaminghave ever contacted 1-800-GAMBLER orother resource for themselves or for anyoneelse for a problem with gambling.Toassessproblemgambling, the surveyutilizes a series of fivequestions based on thepractices of others withinthe field of problemgamblingresearch(Volberg & Williams,2011;Toce-Gerstein,Gerstein, & Volberg, 2009). These questionshelp to gauge the types of behaviors thatmay indicate a need for intervention. Forthose that engage in interactive gaming,29.7% indicate they have attempted to cutdown, control, or stop gambling in the past12 months, and 22.9% note they havegambled longer, with more money, or morefrequently than intended in the past 12months. To a lesser extent, individualsshared that they needed to gamble withlarger amounts of money to get the samefeeling of excitement in the past 12 months(12.8%), that they have been preoccupiedwith gambling in the past 12 months(10.2%), or that they have borrowed or soldanything to gamble in the past 12 months(3.8%).However, to gauge moreaccuratelywhetherthese behaviors indicateproblemgamblingissues, a scale wascreated utilizing thequestions from Table 2to assesses problemgambling risk (Volberg &Williams, 2011; ToceGerstein, Gerstein, & Volberg, 2009). Thisscale indicates that among thoseparticipating in interactive gaming in thesurvey, 44.6% of the sample of interactivegamblers answered “yes” to at least one ofthese questions. Therefore, monitoringproblem gambling behaviors among thispopulation will continue to be an importantaspect of understanding the implications oflegalizinginteractivegaminginPennsylvania.Table 2: Assessment of Problem Gambling Among Those Engaged in Interactive GamingProblem Gambling ComponentsResponse RatePreoccupied with gambling in the past 12 monthsNeeded to gamble with larger amounts of money to get thesame feeling of excitement in the past 12 monthsGambled longer, with more money, or more frequently thanintended in the past 12 monthsAttempted to cut down, control, or stop gambling in thepast 12 monthsBorrowed money or sold anything to gamble in the past 12monthsPage 510.2%12.8%22.9%29.7%3.8%
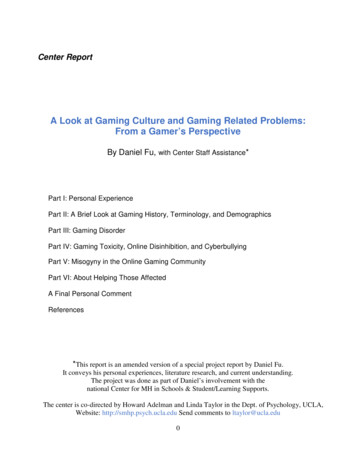
Data Collection and Analysis MethodologyData Collection MethodologyThe Penn State research team developed arepresentative sampling methodology usinga database of all directory-listed householdsin Pennsylvania. The probability sample wasgenerated using a database of “workingblocks” – a set of 100 contiguous numbersidentified by the first two digits of the lastfour digits of a telephone number. The blockwas termed to be working if one or more ofthe listed telephone numbers are found inthat block. The sample was generated usingstratified sampling procedures for eachcounty.Prior to sample selection, the sample isallocated proportionally across all strata inPennsylvania. This can be achieved by avariety of sampling frames. The Penn Stateresearch team used a total active blockmeasurement of size stratification in whichthe sample was distributed by county inproportion to the total eligible blocks in theexchanges assigned to that county. In thisway, all frame units are represented withequal probability across counties.In determining the sample, 50% of thesample was Random Digit Dialing (RDD)landline; 50% RDD cell with anticipatedresponse rates of 15% for the RDD landlineand 10% for the RDD cell. The first sampleincluded: 12,500 landline records, and15,000 wireless records for the state of PA.The RDD landline sample had the samplepassed to identify as many non-workingnumbers as possible. The RDD cell samplehad the activity code appended to denotenumbers that have been used in the last 10months. After adding this information, 4,726landline and 12,227 wirelessremained as good records.recordsThe Penn State research team programmedthe survey in their data collection systemand conducted fidelity tests. This includedthe back-end information regarding thesampling frame and the front-endinformation including the script, dispositionselection (the code given to the surveyrecord to denote its status), and survey thatthe phone center staff followed.The Penn State research team began datacollection with a soft project launch inDecember 2020 and January 2021. InFebruary 2021, testing indicated that callsfrom the 877 number were being identifiedas spam or screened by cell phone providers.Outgoing calls switched from an 877 (tollfree number) to an 814 number to combatspam labeling and increase call completionrates. Consequently, 34 different 814 phonenumbers were rotated to reduce the volumeof calls from any one number.In March 2021, the script was adapted inefforts to increase response rates. At thistime, the Penn State research teamidentified a second sample of records as thefirst set of records were contacted and fullyutilized. The second sample included 15,000landline records, and 12,500 cell phonerecords. After non-working numbers andphone activity were added, 5,276 landlinerecords, and 9,847 cell phone recordsremained, and were added to the portal.Figure 3 provides an overview of the RDDdata collection process for the survey.Page 6
Figure 3: Overview of the RDD Data Collection ProcessSampledRecordsResolve Record lNoRecordFinalizedNoRecordFinalizedYesScreen for Eligibility: PA residentaged 18 YesEligibleYesAdminister InterviewPage 7
Sample60,000 RDD records, 30,000 landline and30,000 cell phone, were sampled. Followingscreening 10,002 landline records and22,074 cell phone records were included inthe sample (total phone numbers 32,076).Figure 3 provides an overview of the datacollection process.Data collection ran from December 2020through June 2021 with 174,424 calls madeto 31,819 numbers (landline 9,939; cellphone 21,880). Cell phones were called upto 8 times and landlines up to 15 times,though this was exceeded in someinstances. Based on all the call attempts, arecord outcome was assigned to eachphone record. Table 4 details the recordoutcomes.Table 4: Record OutcomesNPercentNon-residential/NonworkingUnknown 8.36%Total31,819Eligible, no participationAll call attempts were also classified intothree rates: resolution rate, screening rate,and participation rate. In this round of datacollection, there was a resolution rate (i.e.,known record information - household, nonresidential, or non-working – divided by thetotal number of records) of over 45%. Thefirst cooperation rate, the screeningcompletion rate, is the number of recordsthat complete the screening (i.e., eligiblewith or without participation) out of thetotal number of eligible records (i.e.,including those who refuse participation).Screening completion was over 19%. Thesecond cooperation rate, the participationrate, is the number of records withparticipation out of those who participate orrefuse. The participation rate was 17% (seeTable 5 for information on the number ofcompleted surveys by month).Table 5: Completed SurveysMonthN ne150885048223214385Total1158Data ScreeningThe Penn State research team assessed thesurvey data throughout the data collectionperiod to ensure accuracy. This includedmonitoring completed calls and providingfeedback to interviewers on survey deliveryand entry, along with reviewing callrecordings to verify data entry either basedon a random sample or based on a questionor concern raised by an interviewer. Allsurvey responses with blank values, or anincome below the PA poverty level ( 12,880)were screened for accuracy.Disposition data was also screened to ensureaccuracy. Calls were matched betweensystems to ensure that the disposition entryhad a corresponding call record and viceversa. This process allowed for theidentification of human error in dialing anddispositionrecording.Inaddition,approximately 20% of calls with dispositionsthat disqualified individuals were screenedPage 8
for accuracy. This screening indicated anaccuracy rate of greater than 95%. Allidentified inaccuracies were updated to thecorrect espondents to the survey were 1,156individuals across Pennsylvania. 1,138participants completed the survey, and 18interviews were break-offs in whichparticipants declined to complete thesurvey. Descriptive statistics (means andfrequencies) were conducted on all variablesof interest.Weight techniques are used to re-balancedata to more accurately reflect thepopulation and/or include a multiplier whichprojects the results to a larger universe(Caughey et al., 2010; Mercer, Lau, &Kennedy, 2018); in the case of this project,the Commonwealth of Pennsylvania. Ademographic profile (based on known datasuch as a census age distribution) is oftenused as a target so that subsequent dataanalysis can match that profile. Multivariateweighting (i.e., using age and sex, etc.) is acomplex, iterative process used to achieveresults which are as useful as possible inreflecting real-world results. For this projecta multivariate weight was constructed basedon the age and sex of the respondent incomparison to the greater PA population.The formula used to calculate the weights isW T / A, where "T" represents the "Target"proportion, "A" represents the "Actual"sample proportions and "W" is the "Weight"value. Target proportions for each age groupby sex were derived from the 2015-2019American Community Survey data for thepopulation of Pennsylvania.Page 9
ReferencesCaughey, D., Berinsky, A., Chatfield, S., Hartman, E., Schickler, E., & Sekhon, J. (2020). Targetestimation and adjustment weighting for survey nonresponse and sampling bias.Cambridge: Cambridge University Press.Centerfor Rural Pennsylvania. (2014). Rural urban definitions. aphics rural urban.html.from:Pennsylvania Department of Health. (2021). Enterprise Dissemination Informatics Exchange:Behavioral Risk Factor Surveillance System (BRFSS). Retrieved spx.Pennsylvania Gaming Control Board. (2021). Annual report: 2020-2021. Retrieved nications/20202021 PGCB Annual Report.pdf.Mercer, A., Lau, A., & Kennedy, C. (2018). For weighting online opt-in samples, what mattersmost?. Retrieved from Volberg, R. A. & Williams, R. J. (2011). Developing a brief problem gambling screen usingclinically validated samples of at-risk, problem and pathological gamblers. Report to theAlberta Gaming Research Institute. Gemini Research.Toce-Gerstein, M., Gerstein, D. R. & Volberg, R. A. (2009). The NODS-CLiP: A rapid screen for adultpathological and problem gambling. Journal of gambling studies, 25(4), 541–555.End NotesThese data were provided by the Pennsylvania Department of Health. The Department specifically disclaims responsibility for any analyses,interpretations, or conclusions.ii Counties were designed as rural or urban based on using the Center for Rural Pennsylvania's definition. The Center for Rural Pennsylvania’sdefinition of rural and urban is based on population density. A county is considered rural when the number of people per square mile within thecounty is fewer than 291, based on 2020 Census Data (Center for Rural Pennsylvania, 2014).iP a g e 10
Furthermore, online sports betting contributed over 260 million dollars in tax revenues in Fiscal Year 2020/2021 (Pennsylvania Gaming Control Board, 2021). The magnitude of this number is best understood by noting that traditional retail or ‘brick and mortar’ sports books only