Transcription
Commercial Banking – executing a proven strategyPutting clients & communities atthe center of everything we do Coverage strategically aligned to best serve our clientsInvesting to capturetremendous market opportunity Adding talented bankers focused on adding great clients with deep relationshipsStrengthening our businessfoundation Enhancing client experience through innovation and process optimizationInnovating to extend ourcompetitive advantage Designing simple, digital solutions to deliver more value for clientsMaintainingfortress principles Rigorous client selection with a long-term, through-the-cycle orientationDelivering strongfinancial results High quality, resilient, diversified earnings Local delivery and decision-making, with deep sector expertise Expanding industry focus to drive client value Enabling our teams with extensive training, data and tools Innovating to add new client solutions and incremental revenue streams Strong credit and control culture with 2021 NCOs of 4bps Strong returns with 21% ROE in 2021, while investing for the long term2
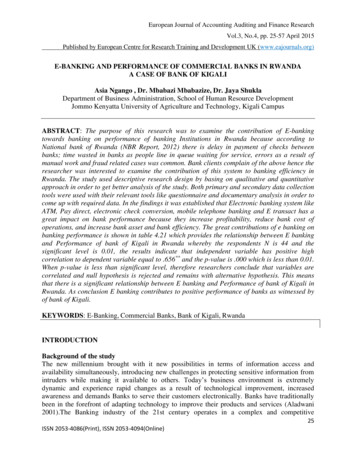
Long-term, through-the-cycle performance( B)2011CAGR2021 10.0Putting clients & communities atthe center of everything we do 6.45% 3.6BRevenueInvesting to capturetremendous market opportunityStrengthening our businessfoundation 2.4Net income8% 5.2 2x 205 104Average loans 2x7% 302Innovating to extend ourcompetitive advantageMaintainingfortress principles 1756% 1.15%Average depositsPayments fee 75% 1.8 65%revenue1 5.1Delivering strongfinancial resultsGross IBrevenue231 Represents2 Representsproduct revenue excluding deposit net interest incometotal JPMorgan Chase revenue from investment banking products provided to CB clients 1.414% 3.5x
JPMorgan Chase platform drives competitive advantage and unmatched value to clientsScale advantage as part of JPMorgan ChaseInvestmentBanking Global footprint with local coverage and expertisePrivateBankInternationalReach Investment capacity to drive long-term growth and innovationAssetManagementCIBAWM Community presence and impact Strong, global brand recognition bringing the best talent Robust technology infrastructurePayments Firmwide utilities provide significant scale and cost benefitCBBranchNetworkTechnologyCorporateFirmwide partnerships deliver unmatched client valueCCB CCB: Extensive branch network and small business client baseCardServicesBrand PB: CB bankers partnering locally creating powerful client impact AM: Providing pension services and liquidity solutions to CB clientsImpactBusinessBanking CIB: The best investment bank, with 5B revenue from CB clients1 Broad-based payments platform across consumer and wholesale41 Representstotal JPMorgan Chase revenue from investment banking products provided to CB clients
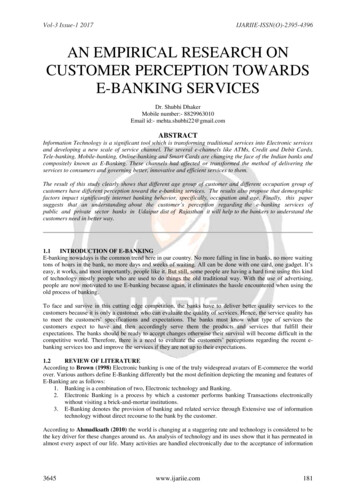
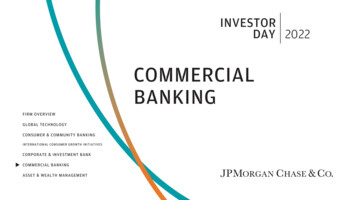
Delivering the #1 investment bank to CB clientsCommercial Banking gross investment banking revenue1 ( B) 46%Targeting key growth areas% of 2021 JPMC N.A. IB fees represented by CB clients2Middle MarketPrivate CapitalInternationalGreen Economy 5.121% CAGR 3.3 2.4 2.5 2.7 Adding to dedicated CB coverage teams Growing specialized industry and regional IBcoverage Expanding Sponsor M&A group with dedicatedteam focused on middle market companies2017201820192020202151 Represents2 FY21;JPMorgan Chase revenue from investment banking and markets products provided to CB clientsrepresents N.A. deal fees for, DCM, ECM, M&A, and SLF, excluding fees from markets products which are included in Commercial Banking gross investment banking revenue
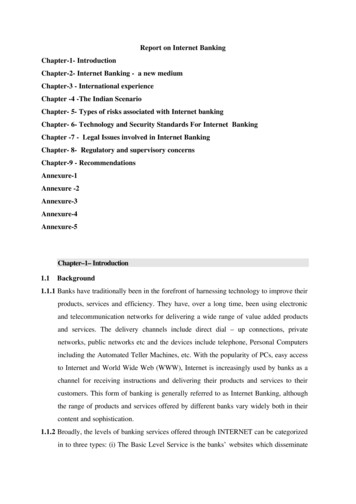
Comprehensive payments solutions drive deep relationships and core operating depositsCB payments fee revenue1 ( B)Average CB deposit balances ( B)14% CAGR6% CAGR 1.4 1.4 1.5 1.52017201820192020 238 1.82021 171 17320172018201920202021Unmatched capabilities across J.P. MorganPayments, card, merchant and digital Deposit growth driven by elevated market liquidityand expansion of CB global client franchise Integrated solutions providing simple delivery ofpayment functionality 5,000 new deposit clients with 23B in balancesrepresenting 18% of deposit growth2 Enhanced digital capabilities increasingconnectivity and improved experience Deposit betas managed dynamically through-thecycle for each LOB segmentSignificant revenue upside from rising market rates62 Measured 177 Strong momentum in 2022 –1Q22 Payments revenue up 19% YoY1 Represents 302product revenue excluding deposit net interest incomeas new clients based on deposit balances only from FY19 to FY21; excludes CTL
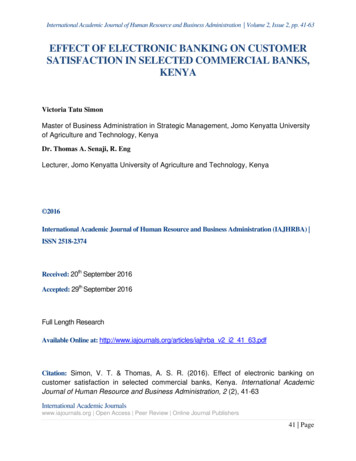
Diversified loan portfolioAverage loans by client segment ( B)C&I 198CRE1C&I 206 208 2020 loan growth driven by PPP and pandemic 219 205 Strong growth in 1Q22, on loan originations and higherrevolver utilization9699100110 Competition remains elevated, particularly from98non-bank lendersCRE Low client demand and defensive stance to the pandemicled to decline in average loans102106108109107 Strong pipeline across CRE Expected growth in multifamily loans given positive market2017201820192020fundamentals (e.g., positive rent growth, lower vacancy rates)driven by strong demand2021 Demand for refinancing will be rate dependent1Q22 loan growth up 5% YoY (excluding PPP)7Note: Commercial and Industrial (C&I) and Commercial Real Estate (CRE) groupings used herein are generally based on client segments and do not align with regulatory definitions; totals may not sum due to rounding1 Includes CCBSI Real Estate
Maintaining risk discipline – C&IPortfolio summaryMarket commentary Credit quality of the portfolio remains strong Monitoring impact of geopolitical tensions, inflation, supply chain,tight labor markets and interest rates Diversified across industries and regions Dedicated underwriters for targeted industries Closely watching potentially vulnerable sectors for stress 87% of non-investment grade exposure is secured1 Maintaining our strong risk focus and underwriting discipline whileC&I portfolio by industry2C&I net charge-off rate (%)31.0%0.5%8Note: Metrics in charts are as of Dec. 31, 2021, all other metrics are as of March 31, 2022 unless otherwise noted1 The Firm considers internal ratings equivalent to BB /Ba1 or lower as non-investment grade2 Portfolios based on sub-LOB are not regulatory definitions; totals may not sum due to rounding3 Peer average based on CB-equivalent CRE segments or wholesale portfolios at BAC, CMA, FITB, KEY, PNC, USB, WFC, which may not fully align with CB 0%201213%1.5%201116%10%Peer Average2.0%20103%4%5%5%Consumer & RetailIndustrialsHealthcareTech, Media & TelecommOil & GasBanks & Fin. Cos.UtilitiesAutomotiveOther200928%Commercial Banking2.5%200817%pursuing growth across the portfolio
Maintaining risk discipline – CREPortfolio summaryMarket commentary Strong credit performance, with NCOs of 2bps YTD Continue to limit exposure to riskier asset classes 72% of loans in Commercial Term Lending; avg. loan size 2mm Monitoring assets in urban dense markets, particularly office and 1% of loans in hospitality, homebuilders, condos and landoffice dependent retail Multifamily remains strong with favorable supply/demand dynamicsin our focus markets supported by housing affordability dynamics Majority of clients have fixed or hybrid rate structures which helpmitigate the impacts of a rapid rise in ratesCRE portfolio by asset class2CRE net charge-offs (%)3 New originations remain high quality LTV ratio of 52%, DSC ratio of 1.56x1 Focused on top-tier clients and lower-volatility asset classes4.0%Commercial BankingPeer strialOther2.0%1.0%0.0%9Note: Metrics in charts are as of Dec. 31, 2021, all other metrics are as of March 31, 2022 unless otherwise noted1 Loan to value (LTV) and debt service coverage (DSC) are weighted average calculations of new origination in CTL YTD2 Portfolios based on sub-LOB are not regulatory definitions; totals may not sum due to rounding3 Peer average based on CB-equivalent CRE segments or wholesale portfolios at BAC, CMA, FITB, KEY, PNC, USB, WFC, which may not fully align with CB 122011201020092008-1.0%
Significant investment in the franchise while maintaining strong expense disciplineCB adjusted expense ( B)1Investment expense20192021JPM CB OH ratio40%40%CB peer avg. OH ratio247%50% 14% 3.7 0.52019 0.2 0.1 0.1 4.0 0.7InvestmentVol / RevrelatedStructural2021 0.2 0.1 0.3Investments:Banker hiringInvestments:Technology,product, data &analytics 4.6 0.91Client coverage2Sales enablement3Data-driven business4Client solutions5Client experience 30%InvestmentVol / RevrelatedStructural2022Volume- /revenue-related Performance-driven comp Growth-driven middle officeStructural Front office (2 year tenure) Payments Middle/back office Technology (Run the bank) Support functions (e.g., risk)10Note: Numbers may not sum due to rounding1 Adjusted expense excludes CB legal expense and is a non-GAAP financial measure. Management believes this information helps investors understand the effect of certain items on reported results and provides an alternate presentation of the Firm’s performance2 Peer group consists of: Bank of America, Fifth Third, KeyCorp, PNC, Truist, US Bancorp, Wells Fargo
Focused, strategic investments to capture organic growth and deepen client relationshipsInvesting in talent to execute strategic investments 1BankersClientcoverageHire bankers to better cover existing andexpansion markets & targeted industries driving real valueMarket shareClient satisfaction2Design CoESalesenablementEnhance CRM tools, data analytics andcomprehensive training for bankersWin rateBanker productivityData Analytics & Tools3CB Solutions & DeliveryCB Client er powerful data analytics through acloud-based data platformSimplify and digitize existing client solutionsand develop new capabilitiesNew Business Ventures5Business OptimizationBanker satisfactionSpeedCost to serveCredit / operating riskNew product designClientexperienceOptimize client experience across the endto-end lifecycle (onboarding to servicing)11Operating leverage
1Client coverageOrganic expansion in Middle Market BankingExpansion market revenue growth ( mm)1National Middle Market coverage20kMiddle Marketclients 90%Middle Market offices locatedwithin branch network3x 28kSince 2016, doubled bankerheadcount while tripling revenue 2,000Prospects inexpansion markets 1,223 6.3kClients 1,000 91233% CAGR 714 422 329 234Expansion statesLegacy statesProspect density2 5375Top 100 MSAs in MiddleMarket footprint2010 44k Middle Market prospects3year revenue figures have been revised to conform to current presentationindicate number of prospects in a given city3 Includes Canadian presence2 Circles2014201620182020 Old 2021 NewTargetTargetNew 2B expansion market target121 Prior2012
1Client coverageReplicating our proven strategy internationallyMarketopportunity 5T cumulative foreign directinvestment in the U.S.1Competing from a position of strength 148T annual wholesale crossborder payments value2 780B annual wholesale paymentsrevenue outside of N.A.3International expansion coverage4Client focusTargeting non-U.S. headquartered, globalcompanies with cross-border needsEUROPE12Countries59Bankers 1,000ProspectsAPAC6Countries46Bankers 1,000ProspectsAMERICAS2Countries12Bankers 100ProspectsGLOBAL20Countries117Bankers2,000 ProspectsJPMC platform and capabilitiesWell-established Private Bank and CIBcoverage in our target marketsDifferentiated valueComprehensive investment banking, wholesalepayments, FX, trade and liquidity capabilitiesLong-term, patient and disciplinedBuilding for long-term franchise value,focusing on strong client selection1 Bureauof Economic Analysis, 2021 publication data of 20202 EY, How new entrants are redefining cross-border payments, 2021; wholesale defined as C2B, B2C and B2B3 The 2021 McKinsey Global Payments Report, data as of 20204 Bankers based on total revenue-producing employees as of Feb 202213
1Client coverageSpecialized industries model drives superior client value and risk management Prudent industry andclient selection Sector-specific advice andcontent to support clients Industry-tailoredclient solutions Deep industry expertisein underwriting18 focus industriesInnovation EconomyAgribusinessApparelLife Sciences Dedicated bankers across Life SciencesEnergyFinancialInstitutionsTechnology &DisruptiveCommerce1and Technology & Disruptive Commerce Strong connectivity across the VentureCapital tHigherEducationGreenEconomy Dedicated sector coverage to meet theFranchiseunique needs of companies focused onaddressing climate changeMedia andEntertainmentMultinationalCorporations 5,000ProspectsGreen Economy (launched Apr 2021) 500 Focused on renewable energy, energyReal Estate2Technologyefficiency, sustainable finance andagriculture / food technologyNonprofit1412Technology & Disruptive Commerce group covers MMBSI technology and high-growth consumer companiesReflects coverage of CCBSI clients in the Real Estate industryProspects
1Client coverageDisciplined, focused Private Equity coverageTremendous potential inMiddle Market1Private Equity industry with recorddry powder1# U.S. MM M&A dealsGlobal PE dry powder4.1k 1.1T 1.3T2.1k2017Executing a comprehensive strategyFocused coverage team for Middle Marketfinancial sponsorsRegional investment banking coverage forsponsors and portfolio companies2021U.S. PE MM company inventory by deal year2017Established sponsor M&A group with dedicatedteam on middle market sponsorsU.S. sponsor MM dry powder9.0k6.1k2021 449B 334BAdding banking, DCM and markets resources todeliver unitranche credit solutionsMaintaining risk discipline through specializedrisk and structuring teams2017202120172021151PitchBook Data, Inc.
Focused, strategic investments to capture organic growth and deepen client relationshipsInvesting in talent to execute strategic investments 1BankersClientcoverageHire bankers to better cover existing andexpansion markets & targeted industries driving real valueMarket shareClient satisfaction2Design CoESalesenablementEnhance CRM tools, data analytics, andcomprehensive training for bankersWin rateBanker productivityData Analytics & Tools3CB Solutions & DeliveryCB Client er powerful data analytics through acloud-based data platformSimplify and digitize existing client solutionsand develop new capabilitiesNew Business Ventures5Business OptimizationBanker satisfactionSpeedCost to serveCredit / operating riskNew product designClientexperienceOptimize client experience across the endto-end lifecycle (onboarding to servicing)16Operating leverage
2Sales EnablementBuilding an unmatched client coverage team with data-driven tools, insights and trainingEquipping our bankers with access to the best training and sales enablement tools to drive value for clientsTimely client & industry insights to identifyopportunities and increase proactivityPricing analytics tools to optimize revenueopportunitiesEnabling solutions-oriented coverageteams through targeted training sessionsDigital, mobile, interactive marketing toolsand collateral to improve client interactionsMarket information and analysis to driveclient insights and optimize operationsWorkflow optimization through crossfunctional collaboration and connectivity 16%24 months 10,000 Middle Market coverage banker productivityhas increased 16% per year since 20191On average, Middle Market bankersbreak even within 24 months210k active Commercial Banking employeesusing CB data tools (up 65% YoY)171 MiddleMarket coverage bankers defined as VPs and EDs working in Sales, and estimated productivity based on internal estimatesdefined as Middle Market coverage VPs and EDs working in Sales. Estimated revenue and expenses based on internal estimates. Breakeven is measured as the point at which projected total revenues exceed total estimated banker-related expenses2 Bankers
3Data-driven BusinessCapturing tremendous value from our cloud-based, client-focused data platformDeliver business value – use casesData intakeClient valueBusiness outcomesClient satisfaction Business optimizationJPMC internaldataUnified cloud-baseddata platform with365TB of data Peer benchmarking Cash flow forecastingSales enablementProduct marginsBanker productivity New lead generation Solution recommendations 5x Pricing analyticsSpeed to decision365Risk decisioning & portfolio mgmt.Win rate Credit pre-approvals2019 2020 20213rd party dataTerabytes Dynamic portfolio management Enhanced risk analyticsOperational excellenceRevenueCost Servicing automation and analytics Fraud prevention analytics Targeted quality control18Risk
4Client SolutionsInvesting to enhance our offerings and adapt to emerging and unmet client needsA design-led, client-focused organization allows us to develop innovative client solutionsEnhancing solutions to deliver more valueClient-focused, solutions-driven organizationDigitizing experiences with Chase ConnectOver 30k active users, up 20% YoYIntegrating InstaMed into JPM Healthcare PaymentsDesign Center of ExcellenceLaunched new B2B receivables offeringAdding new solutions to drive client value and revenue growthCB Client ExperienceNew Business VenturesDedicated team includes design, data, digital and paymentsexpertise focused on CB clientsIntegratedpayablesOptimizing payments with intelligent routingCREpaymentsDelivering CRE-focused payments solutionsStrong client demand for this differentiated solutionExpanding solutions to support our clientsNew solutions help deepen existing relationsand drive new client acquisition19
4Client SolutionsInvesting to deliver powerful solutions to our CRE client franchiseMarket-leading real estate lender 28,000 600 500Multifamily lending clients#1 Multifamily lender in the U.S.1Tremendous market opportunity 390k 50% 500BApartmentproperties (5 units)3Non-digital rentpayments4Annual rentalpayments5Affordable Housing clients#3 Affordable Housing lender in the U.S.2Real Estate Banking clientsDeveloping comprehensive payments solutions for our real estate clientsBuilding simple, digital experiences designed for CRE operatorsSector-specific payments capabilityC2B Rent CollectionB2B Rent CollectionDigital functionalityFraud protection Real-time 24/7 online access Limited manual processes Digital tenant notifications Reduced need for 3rd partiesComprehensive featuresVendor PaymentsSecurity Deposits Multiple payment channels Autopay optionality1Based on S&P Global Market Intelligence, Dec 31, 2021Housing Finance survey, 20213 CoStar, data as of Apr 20224 Boston Fed, Consumer Payment Choice for Bill Payments, data as of 20175 Zillow, U.S. housing rent paid in 20192 Affordable20Market knowledge Access to market data
5Client ExperienceRelentless focus on client experience and operational excellence1 Onboarding2 KYC Reduce onboarding cycle times Minimize client impact Streamline and digitize documentation Streamline and digitize documentation Expand client training & enablement Automate existing manual processes6 Servicing Streamline service channels Increase self-service capabilities Improve case productivityCommercialBankingClient5 Lending3 Client solutioning Proactive, analytics-driven solutioning 3rd party integrations for connectivity Client insights informing new designs4 Content delivery Increase speed to commitment Digital delivery of targeted JPMC content Data-driven decisioning Data-driven analytics & insights Simplified client journeyClient satisfactionOperating leverageSpeedCost to serve21Product complexityOperational risk
Setting new targets to continue driving strong, consistent returns for shareholdersRecordExecute growthinitiatives(longer-termrevenue targets)201720212017-2021TargetInvestment banking1 2.4B 5.1B21% CAGR 4.0BPayments fee2 1.4B 1.8B6% CAGRNEW 3.0BNEWMiddle Market expansion 0.6B 1.2B20% CAGR 2.0BCB International3 386mm 540mm9% CAGR 1.0BMaintain expensedisciplineOverhead ratio40%40%40% avg.40% /-OptimizereturnsReturn on equity17%21%17% avg.18% /-221 RepresentsJPMorgan Chase revenue from investment banking products provided to CB clientsproduct revenue excluding deposit net interest income3 Denotes non-U.S. revenue from U.S. multinational clients and CCBSI expansion efforts to serve non-U.S. headquartered companies internationally2 Represents
CB is positioned for continued success over the near, medium & long termPutting clients & communities atthe center of everything we doTremendous client franchise with 23k C&I clients across 170 locations; competitiveadvantage of JPMC, providing unmatched ability to our clients and communitiesInvesting to capturetremendous market opportunityIncreasing investments 30% YoY, with 2k bankers and growing, focusing on high-growthareas (e.g., Middle Market, PE, international, Green Economy) with 47k C&I prospectsStrengthening our businessfoundationEquipping bankers with access to the best training and sales enablement tools; capturingtremendous value from our cloud-based, client focused data platform (365TB)Innovating to extend ourcompetitive advantageDesigning simple, digital solutions to deliver more value for clients; innovating to add newrevenue streams (e.g., Chase Connect, InstaMed, CRE payments)Maintainingfortress principlesRigorous underwriting and client selection (87% non-investment grade exposure secured,CRE LTV ratio of 52%); strong credit and control culture with 10-year avg. NCOs of 6bpsDelivering strongfinancial resultsSetting long-term targets to drive growth ( 4B IB, 3B payments, 2B Middle Marketexpansion, 1B CB international) and consistent returns (18% /- ROE; 40% /- OH ratio)23
Delivering the #1 investment bank to CB clients 1 Represents JPMorgan Chase revenue from investment banking and markets products provided to CB clients 2 FY21; represents N.A. deal fees for, DCM, ECM, M&A, and SLF, excluding fees from markets products which are included in Commercial Banking gross investment banking revenue 2.4 2.5 2.7 3.3 5.1 .