Transcription
How Generalizable are Institutional Characteristics inCSET Studies to U.S. Higher Education? A StatisticalStudyMichael SpoonerIntegrated EngineeringMinnesota State University,MankatoJoshua BaumannIntegrated EngineeringMinnesota State University,MankatoAbstract—This study uses distribution-to-distributionstatistical tests to determine the level of similarity between theCSET offering institutions and the entire population of highereducation institutions in the United States, as listed in the Carnegiedata. These results show that the institutional context in whichU.S. CSET education occurs is sufficiently different from highereducation in the U.S. as a whole that CSET education researchneeds to continue as a stand-alone discipline. In particular, thelarge number of classifications in which the sample and populationdata are significantly different indicates that CSET education is aspecial case from higher education as a whole and thus needs itsown itutions,CarnegieI. INTRODUCTIONThis full paper reports the results of a statistical study todetermine the level of attribute similarity between thepopulation of institutions of higher education in the UnitedStates and a sample of over 700 of these institutions that offercomputer science, engineering, and technology (CSET)education. This sample is a proxy for CSET education in theU.S. as a whole. Knowing where this sample is generalizable tothe whole is important to policy makers, as they determinewhich evidence is appropriate in decision-making, and to CSETresearchers, as they consider which literature bases are anappropriate platform on which to base their study.This study uses distribution-to-distribution statistical tests todetermine the level of similarity between the CSET offeringinstitutions and the entire population of higher educationinstitutions in the United States, as listed in the CarnegieClassification data. These results provide a measure of thegeneralizability, or lack thereof, of institutional characteristicsbetween all of higher education and CSET offering highereducation in the United States. Categories analyzed ate/undergraduate student coexistence, and graduateresearch orientation), undergraduate and enrollment profiles(e.g., part/full time status, level of transfers, and level ofadmissions selectivity), institution size, amount of residentialversus commuting students, institutional control (e.g., public,The authors are wish to thank the National Science Foundation forawards EEC-1759958 and EEC- 1929320, which formed the basis for thetheoretical work in this paper.XXX-X-XXXX-XXXX-X/XX/ XX.00 20XX IEEEEric JamesIron Range EngineeringVirginia, MNJennifer KarlinIntegrated EngineeringMinnesota State University,Mankatoprivate, or for-profit), geographical region, and level ofurbanization. In addition, we consider percentage of institutionsthat have historically served certain populations. Thesecategories represent the majority of the Carnegie classificationdata and were selected to represent organizational attributesmore frequently seen in the context of CSET education researchstudies.II. SOURCES AND METHODSA. DataAs part of a larger study [1] of organizational infrastructurethat does (or does not) support CSET education research, wedetermined the subset of the institutions of higher education inthe United States with CSET education by including the collegeor university if it offers at least one ABET-accredited programsregardless of commission (i.e. engineering, engineeringtechnology, applied science, and computing) as of September,2018. We selected this sample as a proxy for CSET education inthe United States because it has defined edges to the samplewhile also including significant variety in institution type. Thissample of over 700 public and private institutions includes twoyear colleges (17%), special focus four-year institutions (2%),Baccalaureate colleges (13%), Master’s colleges anduniversities (32%), doctoral universities (36%), inclusiveinstitutions (25%), selective institutions (37%), and moreselective institutions (38%) among the many classifications.Category designations and population data were determinedby crossing the sample institutions with the publically availableCarnegie Classification data. The most recently availableCarnegie Classification data is a combination of the 2015classification data [2] with information from 2013 and 2014 andthe 2018 Classification Update [3] and uses a snapshot ofinformation from 2016 and 2017. This database contains over4000 institutions of higher education in the United States. Eachinstitution is classified using a host of variables and data frompublic sources, the College Board, the National ScienceFoundation [4, 5], and IPEDS (the Integrated PostsecondaryData System) [6, 7]. The areas of classification are broad andinclude: instructionalprogramclassificationsundergraduate and graduate studies,for
enrollment profiles of admitted students, institution size, setting (urban, rural, suburban),and geographic region, control (public, private for-profit, private not-forprofit), and special categories, such as minority servinginstitutions, women’s college, faith-relatedinstitution, and liberal arts colleges.An important connection between these categories is thatthey are all contextual variables of the college or university.When researchers or policy makers are determining the bestevidence on which to build their programs or studies,organizational contextual variables are important tounderstanding the strength of the adaptability between samples.B. MethodsThis statistical analysis compares the entire CarnegieClassification dataset and the institutions with ABET accreditedprogram(s) dataset. The goal of the testing was to findcorrelations between the different variables within the data. Toeffectively find potential correlations in the data, multiple t-testson the data sets were run. The t-tests are two-sample unequalvariance tests. The Carnegie Classification data contained fivetimes as many data points compared to the institutions withABET accredited programs data for all variables. Data sets ofthe same variable were compared (e.g., Minority ServingInstitutions 1, Not 0) within the two different data sets. TheNull Hypothesis states that there is a significant relationshipbetween the two sets of data. The Alternative hypothesis occurswhen the two sets of data are unequal, the data is said to berandom, there is no correlation. The results are found using aconfidence level of 0.05. The results of each test were comparedto the defined confidence level by their respective P two-tailvalue, as seen in Table I. If the P two-tail value was lower thanthe confidence level, the data was proven to be random, thealternative hypothesis. If the P two-tail value was higher thanthe confidence value, then there is a statistically significantcorrelation that can be made between the two data sets. Furtherinformation gathered during the t-tests such as the mean werealso taken into consideration when determining an outcome ortrend between the Carnegie Classification and institutions withABET accredited program(s) data.TABLE I.STATISTICAL TESTING TEMPLATEIII. RESULTS AND DISCUSSIONA. SectorThe Carnegie data includes the sector of each institution,which is a combination of organizational control (public, privatefor-profit, or private not-for-profit) and level of educationoffered (focus of either two-year programs to four-year andabove programs). These combine to create six sector options.Looking at the distribution of institutions across all sixoptions, as seen in Table II, there is a significant difference inthe means of each sample at a 0.05 confidence level. Due to alower p-value than our alpha, we must reject the null hypothesisthat there is no significant difference in the means of eachsample. This is based on the ABET programs having a lowermean compared to the Carnegie colleges, thus we see that theABET schools have more Public, and For-profit and Not-forProfit Private 4 - year or above institutions.TABLE II.STATISTICAL DATA, CONTROL AND LEVEL, ALL CATEGORIESLooking specifically at institutions classified as public,regardless of level, there is a significant difference in the meansof each sample at a 0.05 confidence level, as seen in Table III.(Due to a lower p-value than our alpha, we must reject the nullhypothesis that there is no significant difference in the means ofeach sample.) This is based on the institutions with ABETaccredited programs having a lower mean compared to thepopulation of Carnegie Classification institutions when onlytaking account 4 years and above and 2-year Publicinstitutions. Thus the institutions with ABET accreditedprograms have a higher trend of Public 4 -year or aboveinstitutions then population of all the Carnegie schools. Similaranalysis was completed for private 4-year and above institutions,Table IV, and private 2-year institutions, Table V. At the 0.05confidence level, there is a small but significant differencebetween the sample and population, indicating that theproportion of private 4-year and above institutions in the sampledata of institutions of ABET accredited programs is greater than
TABLE III.STATISTICAL DATA, CONTROL AND LEVEL, PUBLICINSTITUTIONSthe overall population. With the same confidence, there is nostatistically significant difference between the sample andpopulation data regarding private 2-year institutions.TABLE IV.STATISTICAL DATA, CONTROL AND LEVEL, PRIVATE, 4YEAR AND ABOVE INSTITUTIONSTABLE V.Overall, there is a significant difference in the means of thesample at a 0.05 confidence level, shown in Table VI. Due to alower p-value than our alpha, we must reject the null hypothesisthat there is no significant difference in the means of eachsample. This is based on the institutions with ABET accreditedprograms having a higher mean compared to the population ofthe Carnegie Classification dataset comparing the Size andSetting of the institutions, meaning the institutions with CSETprograms are more likely than the higher education populationas a whole to be larger and more residential.TABLE VI.B. Institution SizeInstitution size in the Carnegie Classification datasetdescribes the number of students at the institution and, for 4-yearand above institutions, residential character of the area in whichthe institution sits. Residential character is divided in primarilynon-residential, primarily residential, and highly residential.Size categories are very small (up to 500 students at a 2-yearinstitution or 1000 students otherwise), small (500-1999students at a 2-year institution or 1000-2999 students otherwise),medium (2000-4999 students at a 2-year institution or 30009999), large (5000-9999 students at a 2-year institution or10,000 or more students otherwise), and very large (10,000 ormore students at a 2-year institution; this category only appliesto 2-year institutions). Institutions that enroll no undergraduatestudents have a separate category that does not directly referencesize or setting.STATISTICAL DATA, CONTROL AND LEVEL, PRIVATE, 2YEAR INSTITUTIONSSTATISTICAL DATA, INSTITUTION SIZE, ALL CATEGORIESLooking solely at the 2-year institutions, as in Table VII,there is a significant difference in the means of each sample at a0.05 confidence level. Due to a lower p-value than our alpha, wemust reject the null hypothesis that there is no significantdifference in the means of each sample. This is based on theinstitutions with ABET accredited programs having a highermean compared to population of the Carnegie Classificationdataset comparing the Size and Setting of the various sizes ofthe two year institutions. Based on the means, the institutions
TABLE VII.STATISTICAL DATA, INSTITUTION SIZE, 2-YEARINSTITUTIONSwith ABET accredited programs in 2-year institutions are likelyto be larger than the 2-year institutions in the whole populationof the Carnegie Classification dataset.Switching our focus to 4-year and graduate institutions,shown in Table VIII, there is a significant difference in themeans of each sample at a 0.05 confidence level. Due to a lowerp-value than our alpha, we must reject the null hypothesis thatthere is no significant difference in the means of each sample.This is based on the institutions with ABET accredited programshaving a higher mean compared to the population of theCarnegie Classification dataset comparing the Size and Settingof the various sizes and locations of the four year institutions.Thus, the institutions with ABET accredited programs are morelikely to be medium or large four year institutions in bothresidential or nonresidential areas than the population of theCarnegie Classification dataset as a whole.C. Undergraduate Enrollment SelectivitySelectivity in undergraduate enrollment is determined fromthe average ACT score of the entering freshmen class in thesnapshot data year. It is important to note that this classificationis only assigned to 4-year and above institutions that are notTABLE VIII.STATISTICAL DATA, INSTITUTION SIZE, 4-YEAR ANDEXCLUSIVELY GRADUATE INSTITUTIONSTABLE IX.STATISTICAL DATA, UNDERGRADUATE ENROLLMENTSELECTIVITY, ALL CATEGORIESgraduate student only. Given the number of institutions that haveshifted to “test optional” admissions, the Carnegie Classificationteam uses the percentage of applied students who are admittedas well. Both of the measures have limitations.There is a significant difference in the means of each sampleat a 0.05 confidence level. Due to a lower p-value than our alpha,we must reject the null hypothesis that there is no significantdifference in the means of each sample. This is based on theinstitutions with ABET accredited programs having a highermean compared to the population of the Carnegie Classificationdataset comparing the selectivity data of the institutions. Themean of the institutions with ABET accredited programs datademonstrates a higher mean, above a 2, and thus are more likelyto be more selective than the population, as shown in Table IX.D. Institution ControlInstitutional control refers to legal organizational form of theinstitution. Public institutions are funded, to varying extents,through the government, usually at the state level. The fundingused for this determination includes state or federalappropriations, but not federal student financial aid. Publicinstitutions may be part of a larger state system, though that isnot required. Private institutions do not receive directgovernmental appropriations and thus are primarily fundedthrough other sources, such as endowment, religiousorganization, and/or tuition. Private institutions may bestructured as for-profit or not-for-profit organizations.Shown in Table X, there is a significant difference betweenthe sample and population institutional control data at allconfidence levels. Due to a lower p-value than our alpha, wemust reject the null hypothesis that there is no significantdifference in the means of each sample. The institutions withABET accredited programs are much more frequently publicinstitutions compared to the population of the CarnegieClassification dataset. This is particularly interesting as there aremore private institutions, particularly in the not-for-profit space,than public institutions in U.S. higher education.
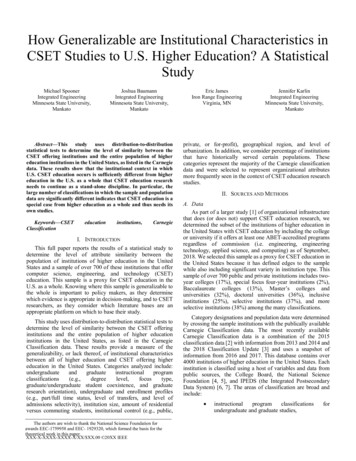
TABLE X.STATISTICAL DATA, INSTITUTIONAL CONTROL, ALLCATEGORIESt-Test: Two-Sample Assuming Unequal VariancesMeanVarianceObservationsHypothesized Mean Differencedft StatP(T t) one-tailt Critical one-tailP(T t) two-tailt Critical two-tailconf 0.01Random, NaCarnegieABET1.924116 1.32090.623314 .579852E. Instisutional LocaleInstitutional locale refers to the level of urbanization of thearea in which the institution is located. The highest level ofurbanization is called “city”, with the area related to but outsidethe city called “suburb”. An area that is not large enough to beclassified a city but still somewhat urbanized is called a “town”.The remaining areas, with no urbanization, are called “rural”.Cities and suburbs are subdivided by size, or small, medium, andlarge. Towns and rural areas are subdivided by distance fromlarger urbanized areas as on the fringes of the city or suburbanarea, distant from the primary urbanization, or in a remote area.Looking specifically at the institutions located in cities,shown in Table XI, there is significant difference between thesample and population datasets. At a confidence level of 0.05,the null hypothesis must be rejected. This means that there is asignificant difference between the means of the two sets of data.Through this outcome, we can make the assumption thatpopulation of the Carnegie Classification dataset are morefrequently within large cities, while the institutions with ABETaccredited programs are within smaller cities on average.When we analyze suburban institutions, we again have asignificant difference between the sample and population data.At a confidence level of 0.05, the null hypothesis must berejected. This means that there is a significant differencebetween the means of the two sets of data. This data, shown inTable XII, was much closer to being able to accept the nullhypothesis, but it still shows that the suburbs containinginstitutions of higher education as a whole are more frequentlyTABLE XI.TABLE XII.STATISTICAL DATA, INSTITUTIONAL LOCALE, SUBURBSt-Test: Two-Sample Assuming Unequal VariancesMeanVarianceObservationsHypothesized Mean Differencedft StatP(T t) one-tailt Critical one-tailP(T t) two-tailt Critical two-tailconf 0.05Random, NaCarnegie Suburbs ABET Suburbs21.20654716 21.339285710.274777694 650590.0124367681.972141222larger than the suburbs containing institutions with ABETaccredited program(s).Distinct from the city and suburb data, analysis of theinstitutions in towns, shown in Table XIII, is not statisticallydifferent. The p two-tail value is large than the confidence level,this means that the null hypothesis cannot be rejected. Bothinstitutions with ABET accredited programs and the institutionsin the Carnegie Classification population as a whole are heavilylocated within the fringes of a town setting.Institutions in rural settings, shown in Table XIV and similarto city and suburban locales, are significantly different betweenthe sample and population datasets. At a confidence level of0.05, the null hypothesis must be rejected. This means that thereis a significant difference between the means of the two sets ofdata. When analyzing rural institutions, those with ABETaccredited programs are much more frequently within the fringecompared to institutions in the Carnegie Classification data as awhole, which is much more heavily towards distant and remote.TABLE XIII.STATISTICAL DATA, INSTITUTIONAL LOCALE, TOWNt-Test: Two-Sample Assuming Unequal VariancesMeanVarianceObservationsHypothesized Mean Differencedft StatP(T t) one-tailt Critical one-tailP(T t) two-tailt Critical two-tailconf 0.05Significant Relation, N0Carnegie Town ABET Town32.2245827 32.117117120.454045228 4370.1333319761.976233309STATISTICAL DATA, INSTITUTIONAL LOCALE, CITYt-Test: Two-Sample Assuming Unequal VariancesMeanVarianceObservationsHypothesized Mean Differencedft StatP(T t) one-tailt Critical one-tailP(T t) two-tailt Critical two-tailconf 0.05Random, NaCarnegie CitABET City11.78148 11.93000.711668 .964545TABLE XIV.STATISTICAL DATA, INSTITUTIONAL LOCALE, RURALt-Test: Two-Sample Assuming Unequal VariancesMeanVarianceObservationsHypothesized Mean Differencedft StatP(T t) one-tailt Critical one-tailP(T t) two-tailt Critical two-tailconf 0.05Random, NaCarnegie Rural ABET Rural41.45124717 41.194444440.484549577 930.0038480182.009575237
F. Special PopulationsSome institutions have historically served a particularpopulation, such as women’s colleges and institutions with asignificant population of students who are Hispanic. Otherinstitutions are members of an organization representing aparticular population, for example the Council of Public LiberalArts Colleges, or are otherwise connected to a particulardemographic, such as faith-based institutions. These areinstitutions that serve special populations. We analyzed threetypes of these institutions: Hispanic serving institutions,minority serving institutions, and women’s colleges.Hispanic-Serving institutions, or HSIs, have no statisticaldifference between the sample and population datasets. Asshown in Table XV, there is a significant relationship in themeans of the sample and population at a 0.05 confidence level.Due to a higher p-value than our alpha, we can accept the nullhypothesis that there is no significant difference in the means ofeach sample. Thus it can be concluded there is a relationshipbetween all the population of all Carnegie classificationinstitutions that are HSIs and institutions with ABET accreditedprograms that are HSIs. However, neither the population ofCarnegie Classification institutions as a whole nor institutionswith ABET accredited programs are heavily Hispanic-Serving.For those institutions classified as Minority-Servinginstitutions, or MSIs, there is a significant difference in themeans of each sample at all confidence levels, as shown in TableXVI. Due to a lower p-value than our alpha, we must reject thenull hypothesis that there is no significant difference in themeans of each sample. The institutions with ABET accreditedprograms are much more frequently MSIs compared to theCarnegie Classification population as a whole. This is likelyconnected to the structural oppression in the original creation ofHistorically Black Colleges and Universities [8].The final special population we analyzed is women’scolleges. As shown in Table XVII, at a confidence level of 0.05,the null hypothesis must be rejected. This means that there is asignificant difference between the means of the two sets of data.This means that institutions with ABET accredited programs areTABLE XV.STATISTICAL DATA, SPECIAL POPULATIONS, HISPANICSERVING INSTITUTIONSTABLE XVI.STATISTICAL DATA, SPECIAL POPULATIONS, MINORITYSERVING INSTITUTIONSt-Test: Two-Sample Assuming Unequal VariancesMeanVarianceObservationsHypothesized Mean Differencedft StatP(T t) one-tailt Critical one-tailP(T t) two-tailt Critical two-tailconf 0.01Random, NaCarnegieABET0.13612 0.1797430.117617 72.581453TABLE XVII. STATISTICAL DATA, SPECIAL POPULATIONS, WOMEN’SCOLLEGESt-Test: Two-Sample Assuming Unequal VariancesMeanVarianceObservationsHypothesized Mean Differencedft StatP(T t) one-tailt Critical one-tailP(T t) two-tailt Critical two-tailconf 0.05Random, NaCarnegieABET0.008789 0.0028530.008713 51.961607much less frequently women's colleges than institutions ofhigher education as a whole.IV. CONCLUSIONS AND FUTURE WORKWhen we started this study, we were looking to discover thelimits of generalization from research on CSET education tohigher education as a whole. Our idea was to find where wecould expand the story of our CSET education research resultsto the larger higher education community. What we found is thatthe limits are so narrow, the story from the data is actually in theopposite direction: the institutional context in which U.S. CSETeducation occurs is sufficiently different from higher educationin the U.S. as a whole that CSET education research needs tocontinue as a stand-alone discipline in order to continue thepathway of improvement. For policy makers, this means thatassessments, definitions, and forms of high-impact practiceswhich are known to positive innovations in higher education inthe U.S. as whole should be systematically vetted for U.S. CSETeducation prior to wholesale adoption. For CSET educationresearchers, this work helps explain differences in researchresults between U.S. CSET education and higher education inthe U.S. as a whole as well as suggest organizational contextvariables that may describe why these differences exist.We will continue this work in two forms. First, we areexpanding our analysis to consider each ABET commissionindividually. We are intrigued with the similarities anddifferences in the institutional contexts where engineering,engineering technology, and computer science education occur.Second, we and, we hope, other researchers interested in
impacting governmental policy on CSET education at all levelswill use this data to clarify the limitations of their researchresults and encourage more resources to be earmarked forresearch, innovation, and application in this discipline.[4][5][6]REFERENCES[1][2][3]Riley, Donna, Ellen K. Foster, and Jennifer Karlin. "Show up anddisrupt." Journal of Engineering Education, 2019.Indiana University Center for Postsecondary Research. ublicDataFile.xlsx. 2016.Indiana University Center for Postsecondary Research. ublicDataFile.xlsx, 2018.[7][8]National Science Foundation, FY2017 NSF Higher Education Researchand Development (HERD) survey, 2018.National Science Foundation, FY2016 NSF Survey of Graduate Studentsand Postdoctorates in Science and Engineering (GSS), 2017.Ginder, Scott A., Janice E. Kelly-Reid, and Farrah B. Mann. "2015-16Integrated Postsecondary Education Data System (IPEDS): MethodologyReport. NCES 2016-111." National Center for Education Statistics, 2016.Ginder, Scott A., Janice E. Kelly-Reid, and Farrah B. Mann. "Enrollmentand Employees in Postsecondary Institutions, Fall 2017; and FinancialStatistics and Academic Libraries, Fiscal Year 2017: First Look(Provisional Data). NCES 2019-021Rev." National Center for EducationStatistics, 2019.Gasman, Marybeth, and Adriel Hilton. "Mixed Motivations, MixedResults: A History of Law, Legislation, Historically Black Colleges andUniversities, and Interest Convergence." Teachers College Record 114,no. 7, 2012.
education in the U.S. as a whole that CSET education research needs to continue as a stand-alone discipline. In particular, the large number of classifications in which the sample and population data are significantly different indicates that CSET education is a special case from higher education as a whole and thus needs its own studies.