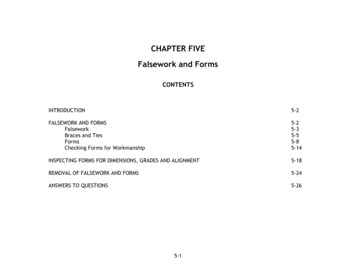
Transcription
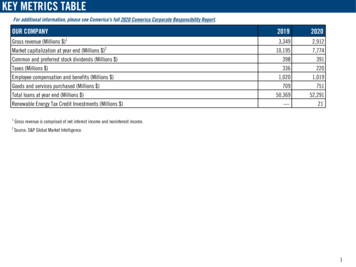
KEY METRICS TABLEFor additional information, please see Comerica's full 2020 Comerica Corporate Responsibility Report.OUR COMPANY1Gross revenue (Millions )Market capitalization at year end (Millions )2Common and preferred stock dividends (Millions )Taxes (Millions )Employee compensation and benefits (Millions )Goods and services purchased (Millions )Total loans at year end (Millions )Renewable Energy Tax Credit Investments (Millions )1Gross revenue is comprised of net interest income and noninterest income.2Source: S&P Global Market 69—2,9127,7743912201,01975152,291211
KEY METRICS TABLECUSTOMERS2019New small business loan commitments (Millions ) 1,000810128123215552Real Time Payments average monthly volume (% Change)4—252ACH average monthly volume (% Change)4—9Wire transfers average monthly volume (% Change)4—17Number of Mobile Banking Users (% Change)4—14Click & Capture Mobile Deposits (% Change)4—39—96—1Checking statements sent electronically / month (% Change)—7Banker Connect (video teller) machines deployed (Total number of)5493PPP loans closed accomplished by leveraging technology (Number of)—14,735SBA lending, including 7a and 504 loans (Millions )2020Privacy & ProtectionNumber of substantiated complaints received concerning breaches of customer privacy- complaints received fromoutside parties and substantiated by the organization3Total number of identified leaks, thefts or losses of customer dataInnovation & TechnologyZelle transactions (% Change)44Web Bill payment sent electronically (% Change)4ESG-Related Lending & InvestmentSee Environmentally Beneficial Lending Metrics- Environment SectionSee Community and Economic Development Loans and Tax Credit Investment Metrics- Community SectionSee Total in New Account Openings from Business Resource Group (BRG) Business Referrals Metric- Diversity, Equity & Inclusion Section3For 2020, the one substantiated complaint was also included in the total number of identified leaks, thefts or losses of customer data number.4Revised year-end 2020 innovation and technology metrics (updated on 8/31/21)2
KEY METRICS TABLERESPONSIBLE BUSINESS20192020Number of internal incidents of alleged corrupt behavior investigated241277Number of cases where allegations were substantiated and/or employee admitted involvement1038600Anti-Money Laundering99.699.9Comerica Code of Business Conduct and Ethics for Employees99.999.9Fair Lending Anti-Discrimination99.899.8Information Privacy and Protection99.999.9Community Reinvestment Act99.899.8Financial Abuse of Elderly and Vulnerable Adults99.999.9Workplace Harassment99.899.9Information Lifecycle 76Anti-Corruption, Ethics and Countering BriberyNumber of legal rulings against Comerica or its employees for corruptionColleague Annual Compliance Training (percent relevant employees who completed the required course)SustainabilityPublic Policy & Government RelationsComerica PAC contributions to political candidates and committees (Thousands )55Comerica PAC contributions (Nov 1 previous year-Oct 31 reporting year)3
KEY METRICS TABLECOLLEAGUES20192020Talent Attraction- Employee DemographicsFull-time equivalents (FTE)67,7477,681Total number of employees77,9487,8707,4677,429% Female6464% Male3636481441% Female8583% Male1517 0.10% Baby Boomer (1946-1964)3126% Gen X (1965-1980)3639% Millennial (1981-2000)3335 0.1 14545232417171515Full-timeTotal EmployeesPart-time% Traditionalist (Born prior to 1946)Employee Breakdown byGenerations% Generation Z (After 2000)% 0-5 YearsEmployee Breakdown by Length of % 6-15 YearsService% 16-25 Years% 26 Years67As reported in Comerica's 2020 10-K (page F-116).As reported in Comerica's 2020 10-K (page 11).4
KEY METRICS TABLECOLLEAGUES20192020Talent Attraction- Employee DemographicsFull-timePart-timeEmployee Breakdown by AgeOfficials and ManagersProfessionalsFemaleNew Hires By GenderMale% 30 years—12% 30-50 years—48% 50 years—40% 30 years—0% 30-50 years—53% 50 years—47% 30 years—16% 30-50 years—45% 50 years—39% 30 years—12% 30-50 years—48% 50 years—40Number of new hires74052458615253374239% of TotalNumber of new hires% of Total5
KEY METRICS TABLECOLLEAGUES20192020Talent Attraction- Employee Demographics5654553542165132712117165952317251 1389453474012515181217144552227261 1Average hours of training per employee (mandatory and non-mandatory)3524Percentage of colleagues who took advantage of non-mandatory, non-compliance skills training74969,346 6,900Leadership Development Program (number of graduates)8——Emerging Leaders Program (number of graduates)844—Under 30 Years OldNew Hires By Age30-50 Years OldOver 50 Years OldCaliforniaFloridaNew Hires By MarketMichiganTexas/ArizonaOtherNumber of new hires% of TotalNumber of new hires% of TotalNumber of new hires% of TotalNumber of new hires% of TotalNumber of new hires% of TotalNumber of new hires% of TotalNumber of new hires% of TotalNumber of new hires% of TotalTalent DevelopmentNumber of skills-based courses offered to Comerica colleagues8Comerica’s Leadership Development Program and Emerging Leaders Program are offered on a bi-annual basis in alternating years. In 2020, Comerica's Leadership DevelopmentProgram was anticipated to take place but was placed on hold due to the coronavirus pandemic.6
KEY METRICS TABLECOLLEAGUES20192020Talent RetentionServices provided through Comerica's Employee Assistance Program (# of 22,580578,1231,33493816.811.6Number of859600% of Total6464Number of475338% of Total3636Number of368292% of Total2831Number of581347% of Total4437Number of385299% of Total2932Employees receiving tuition assistance (total number)Value of tuition assistance received ( )Employee Awards (number of monetary awards to employees)Value of Employee Awards ( )Employee Turnover TotalNumber ofPercent of Total EmployeesFemaleEmployee Turnover By GenderMaleUnder 30 Years OldEmployee Turnover By Age30-50 Years OldOver 50 Years Old7
KEY METRICS TABLECOLLEAGUES20192020Talent Retention (Continued)VoluntaryEmployee Turnover By Type andMarketInvoluntaryNumber of974771% of Total7382California %252012Michigan %4755Texas/Arizona %2722Number of360167% of Total2718California %919Florida %10Michigan %6063Texas/Arizona %3017Florida %8
KEY METRICS TABLECOLLEAGUES201920207101318Number of Local Diversity Awareness Roundtable Teams56Number of Green Office Teams991837538486Bronze-level certified colleagues (number of)4,8074,823Silver-level certified colleagues (number of)3,9054,016Gold-level certified colleagues (number of)3,1903,318Platinum-level certified colleagues (number of)1,9282,012482515Seedling-level certified colleagues (number of)6977Sapling-level certified colleagues (number of)131454Employee EngagementNumber of Diversity-Related Employee Resource Network Group (ERNG) categoriesNumber of Diversity-Related ERNG chapters within our marketsNumber of employees participating in Financial Education BrigadeColleagues enrolled in Comerica's Master of Diversity Awareness (MDA) Program (Percent)9Colleagues enrolled in Comerica's Master of Sustainability Awareness (MSA) Program (Number of)9Mighty Oak-level certified colleagues (number of)9MDA/MSA level listings are cumulative. If a colleague has been certified at the highest level, employee is also counted in the lower certification levels.9
KEY METRICS TABLEDIVERSITY, EQUITY & INCLUSION201920206565684688Women Professionals (total number)101,5171,545Women Other (Administrative Support, Sales Worker, and Service Worker) (total number)102,9542,844Racial/Ethnic Minority Population employees (Percent of total employees)4041Racial/Ethnic Minority Officials and Managers (total number)10356375Racial/Ethnic Minority Professionals (total number)109329471,8821,8671919 160383Total Diverse Supplier Spend (Millions )115242Total Diverse Supplier Spend Goal (Millions )4745Tier 1 Diverse Supplier Spend (Million )3533Tier 2 Diverse Supplier Spend (Million )179Diversity, Equity & Inclusion- InternalWomen employees (Percent of total employees)Women Officials and Managers (total number)10Racial/Ethnic Minority Other (Administrative Support, Sales Worker, and Service Worker) (total number)10For more employee diversity metrics, please refer to the Key Metrics - Talent Attraction.Diversity, Equity & Inclusion- ExternalReaching Diverse CustomersNumber of Comerica Business Resource Groups (BRG) teamsTotal in new account openings from BRG business referrals (Millions )Supplier Diversity10EEO-1 categories used for breakdown of Women and Racial/Ethnic Minority employee numbers. Additional Diversity, Equity & Inclusion metrics are included within Comerica's MostRecent Diversity, Equity & Inclusion Progress Report.11Total Diverse Supplier Spend includes Tier 1 and Tier 2 spending10
KEY METRICS TABLEDIVERSITY & INCLUSION20192020Percent of RFPs tracked which included diverse suppliers125689Percent of contracts awarded to diverse suppliers for relevant RFPs133435Number of Board Directors1111% Independent Directors9191% Racial/Ethnic Minority Directors142727% Female Directors142727% Directors 30 years age—0% Directors 30-50 years age—9% Directors 50 years age—91Diversity, Equity & Inclusion- External (Continued)Supplier DiversityBoard Diversity12Our process to collect diverse supplier sourcing project data moved from a manual process to an automated process, which now consolidates data from our online suppliersourcing platform. As such, the process of data collection in 2020 is considered to be more accurate than the manual data collection process in 2019 and the two years of data maynot be truly comparable.13Percentage of projects that included diverse suppliers that were sourced to diverse suppliers14In 2020, a racial/ethnic minority Director held a key Board leadership position (Enterprise Risk Committee chair) and female Directors held key Board leadership positions(Independent Facilitating Director and Governance, Compensation and Nominating Committee chair)11
KEY METRICS TABLEENVIRONMENT2012201920209,0357,7477,681Human Resources-based employee FTEs - used for real estate intensity-based metrics15—7,6007,536Total Workers (including employees and contingent workers within our buildings, on FTE basis)used for real estate intensity-based metrics15—8,4228,210Total direct and indirect energy use- real estate and transport (MWh)153,210105,69995,286Total direct and indirect energy use- real estate and transport (Billion Joules)551,556380,407343,029Total direct and indirect energy use- real estate only (MWh)16148,266102,43893,662Direct energy use- fossil fuels (MWh)30,96627,64624,378Indirect energy use- purchased electricity, steam, chilled water in metered buildings (MWh)93,77956,96053,689Indirect energy use- estimated electricity use in leased (and unmetered) buildings (MWh)28,46513,62312,0480.02670.02530.0218Total direct and indirect energy use- real estate (MWh) per square foot - average square feetover four quarters—0.02340.0216Total direct and indirect energy use (MWh) per full time employee (FTE)—13.9012.64EnergyEmployee Numbers for Intensity MetricsAnnual Report-based employee FTEs - used for travel intensity-based metrics15Energy Use (MWh)Energy IntensityTotal direct and indirect energy use- real estate (MWh) per square foot at year end15Our Human Resources (HR)-generated FTE number uses a slightly different calculation than the Annual Report FTE number and allows us to break down workers by individuallocations. This allows for intensity metrics to be generated at the facility level. We use the HR-based FTE number for our real estate-related intensity-based metrics and AnnualReport employee FTE for the travel-intensity metrics (from 2020 Annual Report, Page F-116).16Total direct and indirect energy use- real estate only includes Natural Gas, Diesel Fuel, Metered and Estimated Electricity, Estimated Natural Gas and Propane Gas for heat, Steamand/or Chilled Water.12
KEY METRICS TABLEENVIRONMENT201220192020Total GHG Emissions from Scopes 1 & 2 Real Estate and Scope 1 Travel (Metric tons of CO2e)81,73542,62138,354GHG emissions- Scopes 1 and 2 Real Estate only- (Metric tons of CO2e)80,53341,82837,9540.01450.00960.0088Emissions intensity- real estate (metric tons of CO2e per square foot- average square feet over fourquarters) within organization—0.00960.0088Percent Cumulative Scope 1 & 2 Real Estate GHG reduction from 2012 base year (Goal 20 percentGHG reduction from base year by 32,9533,0554,5604,7581,2701,662957Life cycle emissions-other office paper use1,5632,7213,643Life cycle emissions-marketing paper use18222176159Total lifecycle computer emissions5202,8161,265Total lifecycle carpeting emissions137504157Climate Change and Greenhouse Gas (GHG) EmissionsEmissions intensity- real estate (metric tons of CO2e per square foot at year end) withinorganizationGHG emissions- Scope 1 transport onlyBreakdown by Scope17Scope 1 GHG emissions- natural gas, jet fuel, diesel, gasoline, and refrigerantsScope 2 GHG emissions- electricity, steam, and chilled water in company-controlled buildingsScope 3 GHG Emissions (Metric tons of CO2e)- Supply Chain and TransportPurchased Goods and ServicesTotal lifecycle paper emissions1818Life cycle emissions-office copy paper use1817Comerica utilizes the Greenhouse Gas Protocol: A Corporate Accounting and Reporting Standard (Revised Edition) for purposes of calculating its greenhouse gas (GHG) emissions.Specific methodologies for estimating Scope 1, Scope 2, and Scope 3 emissions, including activity data sources, estimation techniques, global warming potentials, and emissionconversion factors, are disclosed in Comerica's CDP Climate Change Response.18Paper Emissions in 2019-2020 were calculated using Environmental Paper Network Paper Calculator Version 4.0. 2012 Paper Emissions were calculated using EnvironmentalPaper Network Paper Calculator Version 3.2.13
KEY METRICS Shipping emissions19—195—Armored vehicle 0.14—25,83712,918Climate Change and Greenhouse Gas (GHG) Emissions (Continued)Scope 3 GHG Emissions (Metric tons of CO2e)- Supply Chain and Transport (Continued)Capital GoodsTotal lifecycle furniture emissionsFuel-and-energy related activitiesElectricity transmission/distribution loss emissionsUpstream Transportation and DistributionWaste Generated in OperationsScope 3 lifecycle emissions associated with landfilled mixed solid wasteBusiness TravelEmployee business travel by air and carEmissions intensity- Employee business travel emissions (metric tons of CO2e) per full-timeemployee (FTE)Employee CommutingEmployee commuting emissions19We have been informed by our shipping supplier that their emissions reporting platform, which we have used to estimate Comerica's previous years' shipping-related GHGemissions, is not available for estimating 2020 shipping-related emissions.14
KEY METRICS TABLEENVIRONMENT2012201920201,257629419Subleased metered electricity726397271Subleased estimated electricity4231210Subleased natural gas817165Subleased steam2800Subleased estimated heat-natural gas—05Subleased corporate jet 684,305,584137,63763,37562,725Average metered and unmetered square feet over four quarters—4,370,8164,332,328Average subleased square feet over four quarters—66,09963,178Climate Change and Greenhouse Gas (GHG) Emissions (Continued)Downstream Leased AssetsTotal Downstream Leased AssetsOther DownstreamCBRE Business Travel on Comerica Account20Comerica Leased FleetReal Estate Square Footage (Square feet at year end)Total metered and unmetered square feet at year endTotal subleased square feet at year endReal Estate Square Footage (Average square feet over four quarters)20In early 2020, we transferred much of our corporate fleet vehicles from Scope 1 to Scope 3 as we no longer own the vehicles (our security vendor now owns and manages thevehicles).15
KEY METRICS sed electronic equipment1498742Recycled operational waste110154157Recycled cardboard bailer waste—31Recycled pallets—28Universal waste31036260521,266602607Office copy paper consumption (tons)560245140Other office paper consumption (tons)618336447Marketing paper consumption (tons)882220Total office paper (office copy and other office paper) consumption in pounds per FTE—152.72172.51Office copy paper consumption in pounds per FTE—64.3876.70—56.375.0Environmental Resource ManagementWasteLandfilled employee waste (short tons)Percent Cumulative reduction from 2012 base year(Goal 20 percent Landfilled Waste Reduction by 2020)Total recycled/re-purposed waste (short tons)Recycled office paperTotal waste diverted from landfill (Percent)- including recycled office paper, recycled/repurposedelectronic equipment, recycled employee waste, and universal wastePaperTotal paper consumption (tons)Paper Intensity metrics (pounds consumed per FTE)Percent Cumulative reduction from 2012 base year(Goal 50 percent Office Copy Paper Reduction by 2020)16
KEY METRICS TABLEENVIRONMENT201220192020Total FSC-certified office paper (Percent of total)474324Total FSC-certified marketing paper (Percent of total)64100100Office copy paper 30 percent post-consumer recycled content (Percent of total office copypaper)979695All other papers (excluding office copy paper) 10 percent post-consumer recycled content(Percent of total papers except office copy paper)14926Total post-consumer recycled content by weight (Percent of total paper consumption)14137451,532301,369298,125Intensity metric- Water consumption (cubic meters per Total Employee FTE)—39.6539.56Intensity metric- Water consumption (cubic meters per Total Worker FTE)—35.7836.31Percent Cumulative reduction from 2012 base year(Goal 30 percent Water Reduction by 2020)—33.334.0Loan commitments (Billions )1.00.91.2Loan commitments (number of companies)12782120Environmental Attributes of PaperWater StewardshipTotal water consumption (cubic meters)21Environmentally-Beneficial Loans (part of ESG-Related Lending and Investment Impact Topic)21Our “direct billed” water consumption includes all properties for which Comerica receives and pays water bills directly via our utility bill payment and management system.Leased properties controlled by our landlords are not included in these totals.17
KEY METRICS TABLEENVIRONMENT201220192020Percentage of top spend screened every three years for environmental sustainability303939Percent of spend dollars with suppliers screened for sustainability with a score of A through C—5566Percent change in average sustainability score of suppliers (Round 3 scoring vs. Round 2 scoring)—-1-1Percentage of carpet purchases that were NSF 140 Gold rated2299100100Percentage of flooring purchases, including carpet and vinyl flooring, that contained recycledcontent22—9786Percentage of computers and displays purchased that carried an EPEAT rating23—99100Percentage of furniture purchases that were BIFMA level certified24—8394Percentage of office supplies purchased from Office Depot that contained post-consumer recycledcontent—1819Percentage of office supplies purchased from Office Depot that were at least "light green" inOffice Depot's GreenerOffice Eco-Rating System572424Supplier Sustainability EngagementPercentage of flooring purchases, including carpet and vinyl flooring, that were Cradle-to-Cradlesilver certified2222Inclusive of Shaw purchases, representing 95% of all 2020 flooring purchases.23EPEAT certified computers/displays for 2020 (39.4% silver and 60.3% gold)242020 data not directly comparable to 2019 as purchase and BIFMA certification data was not available from all 2020 furniture vendors.18
KEY METRICS TABLECOMMUNITY20192020Number of ATMs577584Number of U.S. banking centers435432Comerica Secured Credit Cards (Number of) for low- and moderate-income 3Low-income housing tax credit investment deals (Millions )8175New market tax credit investment deals (Millions )—10452828Financial Inclusion & Financial EducationNumber of Access Checking Customers (low- and moderate-income)25/26Access Checking Balances (Millions ) (low- and moderate-income customers) 25/26Number of low- and moderate-income individuals reached through Comerica-sponsored financial education eventswith nonprofit partnersCommunity Investment & DevelopmentCommunity and economic development loans (Millions )Percentage of projects that benefited from Comerica's tax credit investments that were LEED-certified housingprojects (Percent)Number of micro-enterprise loan funds supported25Tailored retail banking products within our CRA Assessment areas in Arizona, California, Florida, Michigan and Texas26Access Checking account has no monthly fee with direct deposit.19
KEY METRICS TABLECOMMUNITY (Continued)20192020Charitable gifts and corporate contributions (Millions )8.413.2Employee United Way contributions (Millions )1.71.6Employee time volunteered (hours)71,37639,368Corporate-wide employee volunteer goal (hours)2764,00064,0002,4901,8921.81.0Volunteerism & PhilanthropyNumber of employee volunteersApproximate worth of employee volunteer time (Millions )27Annual corporate-wide employee volunteer goal is equivalent to approximately eight hours per employee20
New small business loan commitments (Millions ) 1,000 810 SBA lending, including 7a and 504 loans (Millions ) 128 123 . Checking statements sent electronically / month (% Change)4 — 7 Banker Connect (video teller) machines deployed (Total number of) 54 93 . Comerica Code of Business Conduct and Ethics for Employees 99.9 99.9
