Transcription
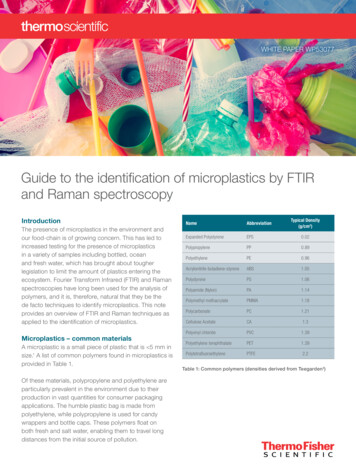
WHITE PAPER WP53077Guide to the identification of microplastics by FTIRand Raman spectroscopyIntroductionThe presence of microplastics in the environment andour food-chain is of growing concern. This has led toincreased testing for the presence of microplasticsin a variety of samples including bottled, oceanand fresh water, which has brought about tougherlegislation to limit the amount of plastics entering theecosystem. Fourier Transform Infrared (FTIR) and Ramanspectroscopies have long been used for the analysis ofpolymers, and it is, therefore, natural that they be thede facto techniques to identify microplastics. This noteprovides an overview of FTIR and Raman techniques asapplied to the identification of microplastics.Microplastics – common materialsA microplastic is a small piece of plastic that is 5 mm insize.1 A list of common polymers found in microplastics isprovided in Table 1.Of these materials, polypropylene and polyethylene areparticularly prevalent in the environment due to theirproduction in vast quantities for consumer packagingapplications. The humble plastic bag is made frompolyethylene, while polypropylene is used for candywrappers and bottle caps. These polymers float onboth fresh and salt water, enabling them to travel longdistances from the initial source of pollution.Typical Density(g/cm3)NameAbbreviationExpanded renePS1.06Polyamide (Nylon)PA1.14Polymethyl methacrylatePMMA1.18PolycarbonatePC1.21Cellulose AcetateCA1.3Polyvinyl chloridePVC1.39Polyethylene Table 1: Common polymers (densities derived from Teegarden2)
The infrared (IR) and Raman spectra of polyethylene andpolypropylene are shown in Figures 1 and 2, respectively.Although both polyethylene and polypropylene are simplepolyolefins, they can be readily identified and distinguishedFigure 1: IR spectra of Polyethylene and Polypropylene.Microplastics – spanning a range of sizesTo be classified as a microplastic, the piece of plasticin question has to be small. How small? The NationalOceanic and Atmospheric Administration (NOAA)defines a microplastic as being less than 5 mm long.Many particles of concern are smaller than this, typicallybetween 100 μm and 1 μm. This is quite a range of sizes;from objects that are easily visible to the naked eye tosmall particles or fibers that can only be observed with ahigh-quality microscope.Some microplastics are deliberately engineered to besmall. These are termed “primary” microplastics. Primarymicroplastics are a target for legislative control. Anexample is the US ban on microbeads in personal careproducts enacted under the Microbead-Free Waters Actof 2015 (H.R.1321). Other microplastics start off aslarger items that get broken down to smaller particlesin the environment. These are designated as secondarymicroplastics. Both primary and secondary microplastics,spanning the range of particle sizes, are of concern in theenvironment due to their potential impact on marine life.Concerns around the threat posed by microplastics to thehealth of organisms throughout the food chain includeingestion by marine organisms, e.g., zooplankton,3 thepresence of toxic materials used in the manufacture ofthe plastics, for example bisphenol-A, (BPA)4 and thetransport of persistent organic pollutants (POPs) by themicroplastic particles.5 While both FTIR and Ramancan identify a long list of plastic materials, a number ofinstrument choices come into play when addressingthe range of particle sizes. As the size of the particleby both FTIR and Raman instruments, which arecommonly used techniques throughout the polymer andplastics industries. The other polymers listed in Table 1 arealso identifiable by their IR and Raman spectra.Figure 2: Raman spectra of polyethylene and polypropylene.decreases, the sophistication and cost of the equipmentneeded for its analysis increases. Therefore, the firstconsideration should be given to the size of microplasticsto be studied when selecting the appropriate analyticalplatform. These considerations and more will bediscussed throughout this paper, providing an overviewand general guidance on spectroscopic instruments formicroplastics analysis.Analysis of particles from 5 mm to 100 micronsParticles in the size rangeof 5 mm to 100 micronsare visible to the eye andcan, with a steady hand, bemanipulated with tweezers.As these are easy to see andhandle, the spectroscopicsystem required for theiranalysis is relatively simple.Figure 3: Nicolet iS5 FTIRBy far the most commonSpectrometer with theiD7 ATR accessory in thespectroscopic technique forthe analysis of polymers is an sample compartment.FTIR spectrometer coupled with an Attenuated TotalReflection (ATR) accessory. The ATR allows the IRspectrum of a material to be obtained simply by pressingthe sample against a transparent crystal, commonlydiamond. The infrared light passes through the crystalinto the sample where energy is absorbed by the sample,and the light is reflected back into the crystal to generatea spectrum. A Thermo Scientific Nicolet iS5 FTIRSpectrometer equipped with a Thermo Scientific iD7Diamond ATR is shown in Figure 3. The diamond isa couple of mm in diameter and does not need to be
completely covered by the sample, making it ideal for theanalysis of samples in this size range. One caveat with anATR measurement is that it will detect materials that areon the surface of the sample. This is advantageous if asurface coating, such as an absorbed toxin, is of interest.However, if a sample has been weathered (irregularsurface), this may interfere with its identification. If thisoccurs, the surface should be removed prior to analysisby slicing or polishing.The ATR accessory pictured in Figure 3 does not allowthe sample to be viewed after it has been sandwichedbetween the ATR arm and the diamond crystal. Thispresents no issue when dealing with samples in the 5 mmto 1 mm range. However, for samples smaller than this,it is preferable to be able to see the sample throughoutits placement on the accessory and subsequentmeasurement. There are ATR accessories availablethat can provide viewing and magnification, facilitatinganalysis of samples in the 1 mm to 70 micron range. Anexample of such an accessory is the Czitek SurveyIR Microspectroscopy Accessory as pictured in Figure 4.Figure 4. Nicolet iS5 FTIRspectrometer with the SurveyIR Accessory in the samplecompartment.An FTIR spectrometer with an ATR accessory is simpleto use and relatively inexpensive. Further, the small formfactor of the Nicolet iS5 Spectrometer allows it to bemoved close to where microplastics are to be collectedand studied. This can be an advantage in environmentalstudies done outside the laboratory.Analysis of particles from 100 microns to 1 micronInfrared MicroscopyInfrared (IR) microscopy enables the identification ofparticles down to 10 microns or less. There are severaloptions available for IR microscopy in terms of boththe sampling technique used and the degree ofautomation desired for the analysis.Sampling techniques used in infrared microscopyinclude transmission, reflection and ATR. Transmissiongenerally results in the best quality spectra, but oftenrequires the sample to be pressed or otherwiseprocessed to be less than 100 microns thick in orderto allow the infrared light to pass through the sample.Reflection is, in principle, the easiest technique, as itrequires no sample preparation or interaction betweenthe microscope and the sample. However, it canresult in distorted spectra, which may complicate theidentification of polymer components. An ATR samplemeasurement works as described in the previoussection. A downside of using ATR with microscopy is thepotential of cross contamination between consecutivemeasurements because the ATR element comes intocontact with the sample. This is not an issue with manualATR systems where the crystal is easily cleaned betweenmeasurements. However, in automated microscopesystems, in which the ATR comes into repeated contactwith the sample without being cleaned betweenmeasurements, sample carry-over can present aproblem. The choice of sampling technique is, therefore,largely dependent upon the nature of the sample.The degree of automation available on an infraredmicroscope runs from simple point-and-shoot analysis ofa single spot to fully-automated imaging covering a largerarea of the sample and measuring multiple particles.Figure 5 shows the Thermo Scientific Nicolet iN5Infrared Microscope attached to the Nicolet iS20 FTIRSpectrometer. This is a point-and-shoot IR microscopedesigned for simplicity of operation. Example spectraOnce the particle size falls much below 100 microns,some magnification is required. There are two optionshere; IR microscopy and Raman microscopy (bothtechniques are also referred to as microspectroscopy).For particles less than 10 microns in size, Ramanmicroscopy is the preferred choice.Figure 5. Nicolet iN5 IR Microscope attached tothe Nicolet iS20 FTIR Spectrometer.
of microbeads, a primary microplastic in consumerproducts, were obtained using this IR microscope systemshown in Figure 6.Figure 6. Spectra of microbeads obtained on a Nicolet iN5 IRMicroscope. All spectra match polyethylene. The spectrum of theblue sphere also indicates the presence of barium sulfate.Point-and-shoot or single-point analysis is ideal forsituations in which only a small number of particles are tobe located and analyzed. The cost of this system is relativelylow and, due to the few operator controls, it is easy to learnand use. However, if large numbers of particles are to beanalyzed, some level of automation is desirable.Filtration is frequently used as a final step in the isolationof microplastics from their matrix. Many particles maybe captured on a filter surface where analyzing thesefiltered particles one by one is a laborious process. Thus,some level of automation is desirable when analyzingparticles across the filter surface.Data collection and analysis canbe automated through the use ofa microscope equipped with amotorized stage and associatedsoftware. The Thermo Scientific Nicolet iN10 MX FTIR ImagingMicroscope, pictured in Figure 7,provides this useful level of automation.Figure 7: Nicolet iN10 MXFTIR Imaging Microscopewith ATR accessories.There are two main approaches tocollecting data from particles distributed across a filter.The first is discrete particle analysis. In this approach,image analysis is performed on the video image of thefilter to locate the positions of the particles. The systemthen automatically collects IR spectra from each locationand then identifies each particle from its spectrum.The second approach is imaging. In this case, aninfrared image is collected from the entire region ofinterest, in which every pixel contains an infraredspectrum. This provides a chemical ‘picture’ of thefilter. Automated analysis of this image by softwarecan produce information about the identity, numberand sizes of the individual particles. Such an analysisis shown in Figure 8. Here, two types of particles areidentified from their IR spectra. Image analysis providesinformation about the number and dimensions of theseparticles. While, in principle, this is an elegant solution,there are some drawbacks compared to discreteparticle analysis. The first is that the image may containFigure 8. Chemicalimages of a filter (left)obtained on a NicoletiN10 MX FTIR ImagingMicroscope showingpolyethylene (PE)and polystyrene (PS)particles, together withparticle size statisticsderived from thechemical images.
a substantial amount of redundant data. There maybe only a small percentage of the image data set thatcontains information about the particles, the rest beingthe filter. As the image contains at least four dimensionsof data (x-positon, y-position, spectral wavelength andabsorption) the size of the ‘data cube’ containing manythousands of spectra can be excessive. The secondfactor is that the array detectors used for imaging aremore expensive than the simple, single-point detectorsused for discrete particle analysis. The approach chosenis situation dependent on 1.) how many particles areto be analyzed 2.) in what time period and 3.) overhow large an area. Fortunately, the Nicolet iN10 MX IRMicroscope provides options for all modes of samplingand automation.Raman microscopyBoth Raman and FTIR spectroscopy are capable ofidentifying microplastics. However, Raman spectroscopydoes have three distinct advantages when applied tomicroscopy. The first is that Raman spectroscopy usessub-micron wavelength lasers as its light source and, assuch, is capable of resolving particles down to 1 micronand less. FTIR microscopy uses mid-infrared light as itssource, resulting in a wavelength range that loses theability to identify particles much below 10 microns. Thesecond is that, unlike IR systems, Raman microscopesare built around research-grade, white-light microscopes,which facilitate easy viewing of the particles. The thirdis the ease of sampling. There is no need to choosebetween transmission, reflection and ATR samplingtechniques required for FTIR measurements. The Ramansystem laser is focused on the sample, and the spectrumis simply acquired by collecting the scattered light.So, why is Raman microscopy not always the best choicefor microplastics analysis? To balance the advantages,there are three key disadvantages to Raman microscopy.The first is the body of knowledge. FTIR spectroscopyhas been around longer than Raman spectroscopy asa common analytical technique, and it evolved as theApolymer industry grew. As such, there is a greater amountof historical data around IR spectroscopy than Ramanspectroscopy for the analysis of polymers. However,this gap is decreasing as time goes on, and there arecertainly enough reference spectra available to enable theidentification of common microplastics.
applied to the identification of microplastics. Microplastics – common materials A microplastic is a small piece of plastic that is 5 mm in size.1 A list of common polymers found in microplastics is provided in Table 1. Of these materials, polypropylene and polyethylene are particularly prevalent in