Transcription
PublishingHigh-QualityFiguresA supplement to the video “Publishing Figures:Eight Tips for Achieving High-Quality Results”A training resource of the ISMTE
Table of ContentsIntroduction.3I. Image Resolution and Size.3II. Color Considerations.4III. Figure Style Guidelines.5IV. Involving Authors.5V. Training Staff.6VI. Reviewing Proofs of Figures.7VII. Microsoft Office Considerations.7Appendix A (Example Figure Style Guidelines).9Appendix B (Example Frequently Asked Questions for Authors).10 2010 by the International Society of Managing and Technical Editors2
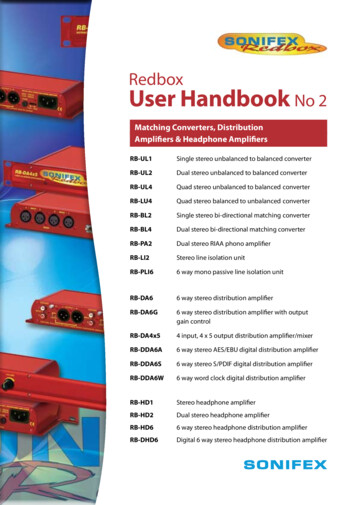
Introduction Why resolution is important:The resolution of an image determines its “sharpness” (at high resolution), or alternatively, its“blurriness” (at low resolution). For a good qualityprint, an image should have at least 300 ppi. It isoften assumed that an image that looks good on acomputer monitor will print well in a journal, but thatis not necessarily true. Images on a screen requirea much lower resolution (approximately 100 ppi) todisplay adequately. It’s important to look at both thephysical print dimensions and the ppi to determineif the print will be good quality.Publishing high-quality figures is a critical componentto achieving a visually cohesive and professionallooking journal. Images, photos, and graphs tell thereader a story, conveying data and information necessary for understanding the research process andresults.Poor quality figures can impact a reader’s experience and result in an overall negative perception ofthe journal’s quality. Factors such as improper sizing,poor resolution, and inconsistent style can ultimatelydetract from the journal’s overall visual appeal. Thegood news is that there are several simple measuresyour editorial office can take to improve the publication of figures in your journal. The following guide isa supplement to the video “Publishing Figures: EightTips for Achieving High-Quality Results”. The guideand video are intended to be used in tandem, as theyboth contain unique and valuable information to helpyou achieve maximum results.I. Image Resolution and SizeWhen assessing whether an image is suitable forprint, first look at two file attributes: the size and theresolution. Size and resolution are different, althoughboth are important. When you’re working with digitalfiles, it’s important to understand the distinction, andto know how to assist authors who may not. What is resolution, and how is ppi different fromdpi?Same size, different resolutions How to check image file resolution:Resolution is the number of pixels in a given area(usually inches); this measurement determines thequality of a printed image (the “fineness of detail”).Resolution is often given as “pixels per inch” or ppi.Sometimes this is mistakenly referred to as dotsper inch (dpi), although this term is not technicallythe same as pixels per inch (“dpi” actually refersto the dots of ink in printing). Size is the width andheight of the final printout (the “print size”). A filecan print at the correct column width, but can behigh or low resolution, depending upon how the image was captured or saved. 2010 by the International Society of Managing and Technical EditorsYou can determine both the size and resolution ofa jpeg or tiff image file within Adobe Photoshop .Go to Image Image Size. In the dialogue box,you will find both the Resolution and the Print Sizegiven in whatever units the program has set to thedefault (these could be percent, inches, centimeters, millimeters, picas, points, or columns; you canchange this under your Photoshop Preferencesmenu). Resolution should be at least 300 ppi toproduce a high-quality journal print. Also in the “Image Size” dialogue box, you will see that the Width,Height, and Resolution attributes can be linkedtogether or unlinked, by unchecking or checkingthe “Resample Image” box.3
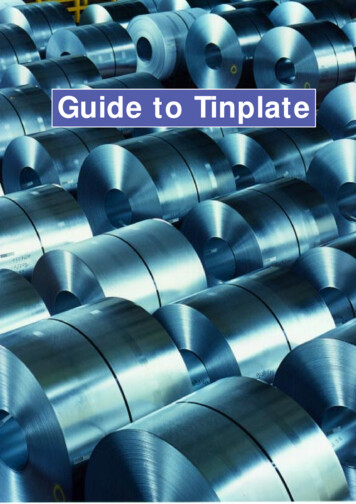
II. Color ConsiderationsColor is an important element of figure quality. Authors typically pay for color printing and thus havehigh expectations for their color images. To managethese expectations, the following issues are critical tounderstand: RGB vs. CMYK:RGB is a color mode used by computer monitors,video screens, digital cameras, and other technologies through which light is emitted. RGB mixesthree colors (red, green, and blue) in various combinations to build all the colors in the images wesee. CMYK is a color mode that uses four print inks(cyan, magenta, yellow, and black) mixed togetherin various ways to create all of the colors in printedimages. CMYK digital files simulate the four-colorprinting process used by printers. Although imagesin RGB mode usually appear brighter and moreattractive on screen (particularly with certain typesof images such as fluorescent cell stains), converting digital images to CMYK mode will show a morefaithful preview of what to expect in print publications.Checking figure image size in Adobe Photoshop Why you shouldn’t “upsample”:When the size of the image is linked to its resolution (by unchecking “Resample Image”), anyincrease in resolution causes the print size of theimage to decrease. When the size of the image isindependent of its resolution (by checking “Resample Image”), the resolution can be increasedwhile keeping the print size consistent. However,this latter case of adding pixels is called “upsampling” or “interpolating”, and it can lead to blurry,unusable images. In this case, Photoshop essentially takes an educated guess regarding where toadd pixels. In other words, the program adds datato the image that don’t really exist. The end resultis technically higher in resolution, but the overallresult is a blurrier, less accurate image. We do notrecommend this method. If your images are toosmall, it is better to publish them at a smaller size,or request larger ones from the author, rather thanto upsample them and publish blurry images.Two color modes most commonly encountered in print files How to check a figure’s color mode:To check the color mode of an image in Photoshop, open the image and go to Image Mode.The menu to the right will display the various colormodes and a check mark will appear next to thefile’s current color mode setup. To change to a newcolor mode, simply select a new color mode fromthis menu.“Upsampling” leads to blurry images 2010 by the International Society of Managing and Technical Editors4
editor is satisfied with the style prior to implementation. Suggestions for the development and maintenance of style guidelines include:Consider elements such as font size and style,capitalization, figure resolution, color quality,layout, line weight, figure labeling, and scientificnotation.Use AMA, APA, or other style manuals as afoundation.Evaluate what will be most legible, useful, andappropriate for your audience.Document all style modifications as the styleevolves.Checking figure color mode in Adobe Photoshop Mac vs. PC issues:Macs and PCs display color differently, so digitalimages will appear slightly brighter or darker, depending upon which system is used to view them.This can make quite a bit of difference, especiallyif the author is depending upon subtle color gradations to tell a story in their figures.Publicize updates to the style manual to authors and staff to ensure that your publication isconsistent. Publicize style guidelines. It’s important that yourauthors and staff are aware of your style guidelines. Examples for places to publicize your guidelines include: Color shift from screen to print:Regardless of how well a computer monitor iscalibrated, the colors on a monitor are created using light, and the colors in print media are createdusing ink, so the two are never going to appear exactly the same. In addition, the editorial office hasno control over the monitors each author is using toview their digital images at the time of submission.The bottom line is that some images may neverprint as vibrantly as authors might like, but this isthe nature of four-color printing.III. Figure Style Guidelines (see Appendix A forexample style guidelines)To achieve a consistent look in your journals, educateauthors, and maximize the efficiency of your staff, itis necessary to develop and implement a set of stylepoints for all figures. Tips: Develop and maintain style guidelines. Work witha graphic designer (internally or perhaps throughyour publisher) to develop a set of style pointsthat can be applied to all figures. Ensure that yourInstructions to authors (print and online)Manuscript management systemManuscript submission checklistsDecision lettersIV. Involving AuthorsOne of the easiest ways to publish high-quality figuresis to educate your authors on how to prepare theirfigures prior to submission. Tips: Make sure authors have a copy of your style guidelines. When authors have access to your styleguidelines early in the figure development process,they are more likely to submit figures that adhere toyour expectations. Request new figures when those submitted don’tmeet your guidelines. It is often easier to makesmall changes yourself rather than requesting newfigures, but in doing so, authors will not be awareof what you expect. Therefore, it is worthwhile toensure they understand and comply with your styleguidelines by requesting new figures. 2010 by the International Society of Managing and Technical Editors5
Develop a list of Frequently Asked Questions(FAQs) about figures. A list of FAQs will helpeducate your authors and minimize staff time inresponding to questions (see Appendix B for example FAQs). Provide convenient means for transferring largefigure files. Authors will become frustrated trying toemail large files and will therefore sometimes settlefor emailing smaller—and therefore lower resolution—files to get the job done. To avoid this issue,provide your authors with an FTP site to uploadfiles, providing support for use of the site whennecessary.Adobe PhotoshopAdobe Illustrator V. Training StaffOnce editorial office staff have become proficient with Photoshop, they will have a headstart on mastering Illustrator, as it has a similaruser interface. Although it is not necessary touse both software packages to manage smallerfigure edits, it is very helpful to have at leastbaic Illustrator skills to help with major figuremodifications performed on a routine basis.A key step in publishing high-quality figures is havinga staff that can evaluate submitted figures and modifythem if necessary. At the bare minimum, consider investing in the necessary training and software applications to equipyour staff to evaluate author-submitted figures.In-person seminars, online courses, and self-pacedDVDs on graphics training abound and are relatively affordable. Ideally, if budget and staffing availability permit,train your staff to modify author-submitted images.Altering font size, font type, line weight, shading,and figure size are easy tactics to developing aconsistent style. Software/equipment necessary for modifying figures:Adobe Photoshop Photoshop is the industry standard for workingwith digital graphics.Although the Adobe software requires moretraining and experience than Microsoft Office ,it provides an impressive amount of flexibilityand power for evaluating and manipulatinggraphics files.Adobe Illustrator 2010 by the International Society of Managing and Technical EditorsMicrosoft (MS) Office Although we recommend discouraging authorsfrom submitting materials in the MS Office fileformats, you will likely still receive a large number of these file types. Therefore, it is usefulto have at least a basic working knowledge ofthese products.6
VI. Reviewing Proofs of Figuresal edits to the figures? If so, are they acceptable? If your designer/compositor is making anyrevisions that don’t comply with your journal’sstyle guidelines, you should meet to discusshow to unify your style.The publication of high-quality figures can beachieved by reviewing article proofs as provided byyour designer, publisher, or compositor. To facilitatethe review process, both authors and editorial officestaff should be aware of several key points.Journal articleproof What authors need to know:The editorial office might edit the author’sfigures after submission. It is essential thatauthors are forewarned in multiple places, including the instructions to authors.The author will have a chance to review anyedits made by the staff. This can be handledin the first-proof stage, allowing enough time forthe author to review a second proof if needed.The author is responsible for thoroughlyproofing the figures to verify their accuracy.This point should be made clear so there areno misunderstandings later if any errors aremissed. Consider including a notice on theproof indicating that the artwork has been modified and should be carefully checked by theauthor for accuracy.The more the author complies with the journal’s figure guidelines, the less their figureswill need to be modified. This is sometimeshelpful in encouraging compliance with guidelines. What the editorial office staff needs to review:The editorial staff should watch for the followingitems when reviewing proofs:Are the figures set at an appropriate size? Isthe text legible?Is the resolution adequate? Do the printsappear to be good quality? You can’t determine the exact resolution by looking at figureson screen in a digital proof, but you can get asense of whether it looks blurry or clear, andthis is usually sufficient.How does the overall figure quality look(including color reproduction)?Has the designer/compositor made addition-VII. Microsoft Office ConsiderationsAuthors often take advantage of the Microsoft (MS)Office suite for figure layout because it is readily available and fairly easy to use. However, MS file formats(doc, ppt, xls) pose special problems for the editorialoffice staff. We therefore advise requiring authors tosend high-resolution jpegs or tiffs in addition to MSformatted files. Be aware of the following potentialproblems with MS files: Embedded color photos might experience a colorshift (that is, their color is displayed incorrectly).This problem is particularly noticeable in Word documents and can pose problems when color isimportant to conveying information such as in histology or fluorescence images. Fonts don’t always display correctly. Special fontssuch as Greek symbols can be lost, and the editorial office staff has no way of knowing what the 2010 by the International Society of Managing and Technical Editors7
correct text should be (and no way of correctingthe problem). Charts, tables, and figures don’t display correctly.When a chart, table, or figure has been createdin one MS application (such as Excel ) and thenembedded into another MS application (such asPowerPoint ), the final result may be misaligned. Word and Excel don’t allow direct export to jpegand tiff formats. To convert a Word or Excel fileto jpeg or tiff formats, an intermediate step usingAdobe Acrobat is necessary. The process is asfollows:In Word or Excel, print the file to PDF.Open the PDF file in Adobe Photoshop, settingthe resolution to at least 300 ppi (400 is recommended to ensure quality isn’t lost if the figuremust be resized).Use “Save As” to save the file as a jpeg, tiff, orwhichever file type is needed. Files created in the newest versions of MS Officecan be difficult to open with older versions of thesoftware.This document was developed by Sarah Williamson, MA, Senior Medical Illustrator, American Gastroenterological Association (AGA)and Lindsey Brounstein, Publications and Graphics Manager, AGA. It was edited by Erin Dubnansky, Senior Director of Scholarly Publishing, AGA.The 2010‒2011 ISMTE Training Committee (Erin Dubnansky, Chair; Kathy Brister, Maggie Haworth, Glenn Landis, and Maru Tapia)conceived of, contributed expertise to, and oversaw the project. 2010 by the International Society of Managing and Technical Editors8
Appendix A: Example Figure Style GuidelinesLINE ART CHECKLIST Fonts are an acceptable sans serif font (HelveticaNeue, Helvetica, or Arial) All symbols are in Symbol font (only exception is if you are not redrawing any of thetext) P values (capitalized, italic, no initial zeros) R values (capital, not italic, initial zeros ok), and r values (lower case, not italic, initialzeros ok) No hatch marks No 3-D style All ‘liter’ symbols are capitalized (e.g. mL, dL, L) Initial word is capitalized in all text (including axis labels, legends, and notes) Initial symbols on axis labels are spelled out (%, #) Panel labels are 18 pt, bold, capitals Axis label orientation X-axis is horizontal Y-axis, rotated 90 counter clockwise Y-axis on right side of graph (when two y-axes) rotated 90 clockwise Labels along x-axis (when too long to be horizontal) rotated 45 or 90 counterclockwise No boxes enclosing graphs (only exception is box and whisker plots) Font sizing (should be consistent throughout graphs within each manuscript; no smallerthan 5 pt and no larger than 12 pt) Alignment Total redraws: use rulers and alignment tool to ensure that axis labels, numbers, andtext are aligned Partial redraws: use your eye to ensure that nothing is noticeably out of alignment Line weights (.75 pt – 1.00 pt [2.00 pt for lines within flowcharts]; consistent withindocument) Boxes around figure keys (unless figure spaces is too limited to include it) Outline grey or colored bars/symbols with black Arrows are (at least close to) appropriate style (Illustrator arrowhead 2 scaled to 50%) Tic marks on graphs face outward and are used only for labeled quantities Figure key designators are squares, rather than rectangles Axis labels are bold Numbers on axes are not bold 2010 by the International Society of Managing and Technical Editors9
Appendix B: Example FAQs for Authors1. Why do you frequently redraw the artwork for the journals?2. What are your journal style guidelines? Can you provide some figure style assistance?3. What is the maximum number of figures and figure panels I can submit with myarticle?4. Is it OK to reproduce figures from previously published articles?5. We are the authors of the original article and have the original graph(s). Can they bereproduced from the originals without going to the publisher?6. Which figure file formats do you accept, and why?7. Why do you ask authors to upload each figure separately?8. Why do you require CMYK instead of RGB format?9. What is the difference between “raster” and “vector?” How does this apply to myfigures?10. How can I determine if my images are of sufficient quality for publication?11. You have asked me for higher quality figures. How do I improve the quality of myimage submission?12. What is the difference between JPEG and TIFF file formats? Which format should Iuse for my image files?13. How do I convert my PDF file to a high-resolution JPEG or TIFF?14. I created my figures in Microsoft Word, Excel, or PowerPoint, but your instructionsstate that you do not accept these file formats. Why are Microsoft files problematicfor your Graphics staff? What do I do now?15. Can I use an image I downloaded from the Internet?16. I changed the resolution of my file and sent it back to you, but I received anothere-mail staying that my image file was still of insufficient resolution. Why did thishappen? What else can I do?17. My files are too large to upload. How do I make them smaller?18. Why don’t the images in my proof look as good as my original figures?19. Can I submit my figures by mail as hard copies?20. I have done the best I can with my figures; however, I am not very skilled withgraphics software. Can you fine-tune my figures for me?21. How can I get help if my question wasn’t answered here?1. Why do you frequently redraw the artwork for the journals?All artwork must adhere to our journal style guidelines. When we receive yoursubmission, our Graphics staff will assess and sometimes modify your figures. Althoughwe request that all figures be sent to us correctly formatted, we make all final changes inhouse to facilitate production.The most common changes we make to figures include the following: re-sizing images,reinforcing of faint/thin lines or fonts that may be difficult for the reader to see in print,re-arranging figure plates for better use of page space, correcting text according to AMAstyle, sizing fonts for consistency, and removing hatch marks within graphs.You will have an opportunity to review any modifications to the redrawn figures during 2010 by the International Society of Managing and Technical Editors10
the proof stage, and you will be able to submit your comments before publication.2. What are your journal style guidelines? Can you provide some figure style assistance?We use the following guidelines for creating and modifying the graphs:Fonts:Helvetica is the preferred font. However, if you cannot use Helvetica, you must substituteanother sans-serif font such as Arial. Serif fonts are not acceptable. (Serif fonts are a styleof typefaces which have “serifs,” or small, extra strokes that adorn each character. Sansserif fonts lack these extra embellishments; they are cleaner, simpler fonts, created fromuniformly-weighted lines.)Examples of serif fonts: Times New Roman Palatino GaramondExamples of sans-serif fonts: Helvetica Arial MyriadSymbol font may be used for special characters, and Courier may be used for sequencealignments. All fonts must be outlined (Type Create Outlines) or embedded (select“Embed Fonts” in “save as EPS” dialogue box) when submitted in vector files such asIllustrator .eps.Capitalization:Please use sentence-style capitalization within figures. Capitalize the first word of eachfigure axis, figure key label, figure title, etc.; subsequent words should be lower case.Single-word labels should all be capitalized.Font sizes:Fonts should be 6 points or larger, but the largest font should not exceed 13 points (theonly exception being 18-point panel labels [A, B, C ]). Font styles and sizes should beconsistent throughout your figures. All fonts must be legible at actual print size.Scientific notation:P values (probability) are capital and italicized, with no zero before the decimal (forexample, P .01).r values (bivariate correlation coefficient) are lowercase.R values (multivariate correlation coefficient) are capital. 2010 by the International Society of Managing and Technical Editors11
Graph style:Graphs should not include hatches or other patterns. Instead, choose colors or shades ofgray with enough contrast to stand out and make clear the meaning of the graph. Graphbars should be delineated with grays that differ by at least 20% in value. Graph linesshould be .75—1.0 line weight. Please do not submit 3-D style graphs.Axis labels:Larger X and Y axis labels should be bold Helvetica. Axis numbers should be slightlysmaller, using regular Helvetica. Use only X and Y axis lines, when appropriate. Avoid theuse of complete boxes to enclose graphs. Use tick marks for only the major axis labels;smaller tick marks should be left off.Figure keys and figure legends:Figure keys must be included within the figure, not the legend. Figures legends should besaved as part of the main text, not within the figures.Color and grayscale:Keep in mind that figures might be photocopied by readers. Also, individuals who arecolor-blind should be able to understand the meaning of your figures. Therefore, pleaseavoid the combination of red and green. Make sure that lines, colors, and symbolsare easy to read by using high contrast, easily distinguishable dotted lines. Additionalinformation regarding use of color in figures can be found here:http://jfly.iam.u-tokyo.ac.jp/color/.Figure layout:Avoid unnecessary spacing within your figure layout. In addition, avoid using unnecessaryboxes (especially with heavy lines) to enclose graphs or images. This will ensure that yourimages and text conform to our journal style, and are as large and readable as possible.Panel labels:Each panel of a multi-part figure must be labeled with a bold, capital, 18-point letter (A,B, C ). Whenever possible, do not place this letter over other text or images.Column sizes:Our journal columns are as follows: 1 column approximately 85 mm, 1.5 columns approximately 133 mm, 2 columns approximately 174 mm. Your figures should printat one of these sizes, and still be readable and high quality.3. What is the maximum number of figures and panels per figure I can submit with myarticle?This varies by journal, and by the type of article you are submitting. Please reference theInstructions to Authors for this information. Also please note that any figures in excess ofthe section limits may be moved to the online supplemental materials. 2010 by the International Society of Managing and Technical Editors12
4. Is it OK to reproduce figures from previously published articles?Yes, we can reproduce the figure(s). However, the author is responsible for determiningthe copyright holder of the source material and obtaining permission to modify orreproduce the material according to the copyright holder’s policies. We request a copyof the permission form or other documentation that permission has been granted. Theoriginal source must be cited in the manuscript or figure legend(s).5. We are the authors of the original article and have the original graph(s). Can they bereproduced from the originals without going to the publisher?Although you created the original graph(s), the answer to the above question still applies.In some cases, the copyright may reside with the publisher, if those are the terms ofyour original copyright agreement. If this is the case, you can send us your figure(s), butwe will still require written documentation that permission for republication has beengranted.6. Which figure file formats do you accept, and why?Our preferred file formats have been chosen for compatibility with our industry-standardsoftware, resulting in the best print quality and faithful color reproduction. Preferredformats allow us to make the necessary edits consistent with our journal style, and aremuch less likely to cause significant production delays.Please note that all images must be high resolution, meaning at least 300 pixels per inch(ppi). Low-resolution files (less than 300 ppi) will not be accepted.Preferred file formats: Tagged Image File Format (.tiff or .tif) Joint Photographic Expert Group Image File (.jpeg or .jpg) — high quality onlyAcceptable but not preferred: Adobe Photoshop document (.psd) Adobe Illustrator File (.ai) — please embed or outline all fonts Adobe Illustrator Encapsulated PostScript file (.eps) — please embed or outline allfonts Adobe InDesign (.indd) — please embed or outline all fonts Portable Document Format File (.pdf) Graphical Interchange File Format (.gif) Bitmap Image File (.bmp) Targa Graphic (.tga) Portable Network Graphic (.png) Portable Bitmap Image (.pbm) Picture File (.pct or .pict) Microsoft Paint Bitmap Image (.msp) 2010 by the International Society of Managing and Technical Editors13
Paintbrush Bitmap Image File (.pcx) X11 Bitmap Graphic (.xbm)Not accepted: Microsoft Word Document (.doc) Microsoft Excel Spreadsheet (.xls) Microsoft PowerPoint Presentation (.ppt) Microsoft PowerPoint Open XML Document (.pptx) Canvas Image File, Canvas Drawing File, Canvas Image Format (.cnv, .cvi, .cvs, .cvx) CorelDRAW Image File (.cdr) FreeHand Drawing File (.fh9 or fhd) QuarkXPress Document (.qxp) Texture File (.tex) LaTaX Equation Editor File Cricketgraph File SigmaPlot File ChemDraw File DeltaGraph File MDL ISIS/Draw FileIf you are having trouble converting your images to the proper file format, or if you havequestions about the acceptability of a specific file format, please contact us early in theprocess of creating your figures for assistance.7. Why do you ask authors to upload each figure separately?Multi-part figure plates (A, B, C ) can be submitted to us whole. However, separatefigures (Figure 1, Figure 2 ) need to be submitted in separate files to allow our onlinemanuscript submission system to automatically generate a PDF for reviewers to view.In addition, upon acceptance of your manuscript for publication, our publisher needsseparate image files for the composition process. Most importantly, submitting separateimage files facilitates the submission and peer review process, so you can see faster results.Also, we do not accept many applications that contain multiple figures, such as MicrosoftPowerPoint , Word , and Excel .8. Why do you require CMYK instead of RGB format?CMYK (cyan, magenta, yellow, and black) is a color format designed for print, whichsimulates the four-color printing process used by the commercial printers that we use forpublication. RGB (red, green, and blue) is the color mode used by computer monitors,vid
provide your authors with an FTP site to upload files, providing support for use of the site when necessary. V. Training Staff A key step in publishing high-quality figures is having a staff that can evaluate submitted figures and modify them if necessary. At the bare minimum, consider investing in the nec-