Transcription
The qualityof clinicalcoding inthe NHSPayment by Results dataassurance frameworkSeptember 2014
4 Checklist to improve the qualityof clinical coded data5 Background and approach6 Findings10 ComorbiditiesSummaryChecklist3 ations16 Appendix – The importance ofclinical coded dataAppendix15 Implications for the developmentof the payment systemFindings13 Causes of error
There was poorer performance in the samples focusingon comorbidities. Despite being an area of concern forcommissioners, our audits found that providers wereconsistently under-recording comorbidities. However,auditors reported issues around the relevancy of comorbidities.National guidance states that non-mandatory comorbiditiesshould only be coded where identified as clinically relevant.However, clinicians are not making the differentiationbetween relevant and not relevant when recordingcomorbidities in the source documentation.To find out more about the PbR assurance framework, orto discuss data quality at your organisation, please Table 1: Headline error rates and financial impact% spells changing paymentLowest error rate1.1Average error rate7.0Highest error rate45.8Net financial impact10.1%Gross financial impact24.1%A spell is a continuous period of time spent as a patient within a hospital and may include more than one patient episode. Clinical coding is undertaken at the patient episode level; payment is made at spell level.A negative figure represents an overcharge to commissioners by providers.3The gross financial change is the total value of the spells that had errors, whether in favour of providers or commissioners.1ChecklistSummaryWe also identified recurring coder errors where codingdepartments had not applied new guidance on areas suchas heart disease, or where nationally there were persistentissues, such as the need to update diagnoses with the findingsfrom histology reports.Throughout the assurance framework we have identifiedconsistent issues that impact on data quality. We havedeveloped these themes using the learning from this year’saudit programme into a checklist of 10 areas designed toenable senior managers to identify ways of improving andmaintaining the quality of clinical coded data.CausesWe audited 8,990 episodes of care which equates to 15.3million of NHS expenditure. The accuracy of clinical codingacross the trusts audited was variable. No trust achieved a0 per cent error rate, and nearly half the spells at the poorestperforming trust changed payment following the audit.The overall net financial impact is minimal but there weresignificant over and under charges identified through theaudits. Table 1 summarises the key results from the 2013/14audit programme.Auditors noted the pressure coding departments are under –deadlines are becoming tighter; vacant posts andinexperienced staff increase the risk of error; and codingsystem issues are impacting on the accuracy of data capture.Trusts should beware of cutting costs on recruitment, trainingand IT systems for coding in an attempt to make savings.This increases the risk of inaccurate data – and as the qualityof coding goes down, so will the accuracy of paymentsbased on it.Monitor and NHS England have signalled a move to a paymentsystem that is more patient focused and outcome based.The effectiveness of these developments will depend on theaccuracy of the treatments and conditions recorded. It isimportant that the NHS continues to improve the quality ofits data so that the payment system is developed based onaccurate and representative data, and that it is implementedeffectively, in a way that benefits patients and improvespatient care.ImplicationsIn 2013/14 we audited the accuracy of clinical coding at50 acute trusts. 40 trusts were selected because of the highnumber of spells1 changing payment in previous audits; 10were selected at random. The audit sample at each trust wassplit between a national theme focusing on comorbidities,and an area of local concern selected by the commissioner.The quality of the source documentation remains a persistentcause for concern. When paper case notes are in a poor condition,it slows the coders’ work and makes it difficult to extract theright information from them. To hit deadlines coders oftenrely on discharge summaries to clarify diagnoses andtreatments. However the information in the dischargesummaries is often poor and incomplete, resulting in errorsin comorbidities and definitive diagnoses.AppendixFor the past seven years the Paymentby Results data assurance frameworkhas provided assurance over thequality of the data that underpinpayments in the NHS.ComorbiditiesSummary
SummaryDischargesummariesWhere discharge summaries are used to support coding, they should be complete and consistentwith other source documentation, containing a definitive diagnosis and all relevant comorbidities.Multi-episode spells should be coded using the full case notes.3Deadlines &completenessIf challenging deadlines are adopted ensure there is a process for updating coding with information that maynot be available at the time of coding, such as histology reports.4ClinicalengagementRegular engagement with clinicians will clarify issues for both clinicians and coders about how the care deliveredshould be described in the source documentation for clinical coding purposes. And routine clinical validation ofclinical coding data helps ensure accuracy.5Audit andanalysisRegular analysis of coded information and routine audit by a Clinical Classifications Service approved clinicalcoding auditor should be a key part of a trust’s quality assurance programme, and feed into coder training.6StaffingVacant posts and inexperienced staff increase the risk of poor coded information – the skill mix and numberof coders should be fit for the purpose of good quality clinical coding.7Training andguidanceAccurate coding relies on well trained staff who can accurately employ the four-step coding process, and whokeep up to speed with changes in national standards and guidance.8IT systemsEnsure the IT system used for coding and other data capture are fit for purpose, allow coding in line with nationalguidelines, and that routine fields such as age are accurately calculated.9AssessmentunitsThe process for data capture in new patient pathways such as assessment units should be formalised to make sureall patient information is captured completely and accurately, including admissions and discharge dates.10Broader usesClinical coded information underpins all aspects of health care management within the NHS – joining upits various uses will help clarify the importance of data quality and identify areas for improvement.The appendix of this briefing contains a list of these broader uses.Background2FindingsMedical records are a legal document and must be fit for their many purposes. Physical case notes shouldbe kept in manageable volumes, with information recorded clearly and sequentially, and be made availablein full for coding purposes. Electronic records should be complete and easy to tionsAreas for senior managers to support,challenge and seek assurance onto increase the quality of admittedpatient care data.Checklistto improve the quality of clinical coded dataAppendixChecklist
This programme focused on three key areas:Between September 2013 and March 2014 we audited clinicalcoding and other data items that drive payment at 50 acutetrusts. These trusts consisted of:nnWe used a risk assessment to identify the 40 ‘at risk’ trusts,similar to the reference costs review programme alsoundertaken this year. This assessment covered:nnnna dmitted patient care data audits at a sample of 50 NHSproviders, auditing a national area of concern and a localarea agreed with commissioners;r eference cost returns auditing the arrangements andaccuracy for the submission at 50 NHS providers; andm ental health PbR data quality reviews at 25 mentalhealth providers, supporting tariff development andimplementation.np revious coding audit results, particularly the coding ofcomorbidities7 and complications; and benchmarking of coding data, using indicators that focus oncomorbidities and complications, based on the analysisavailable in the National Benchmarker8.At all trusts, 200 finished consultant episodes (FCEs) inadmitted patient care were audited. Of these:nThis briefing outlines the key messages from our review ofcoding audits at acute trusts. Findings from our costing reviews5and mental health audits6 have been reported separately.4 0 trusts “at risk” of poor coding quality to improve localdata quality; and,10 trusts selected at random.1 00 FCEs were chosen centrally, following a national themefocusing on comorbidities and complications, with theexact HRG9 sub-chapter identified from nationalbenchmarking analysis; andCommissioners were provided with risk profiles to helpinform the local programme selection. These risk profilescombined the comparative analysis from the NationalBenchmarker and previous audit results used as part of theadmitted patient care risk assessment process. SecondaryUses Service (SUS) continues to be the source of data for allaspects of the local audit programme. This risk profile alsodetermined the focus of the comorbidity and complicationssection of the audit.Each clinical coding audit used the Clinical Coding AuditMethodology 2013/14 – 14 v7.0, compiled by the Health andSocial Care Information Centre (HSCIC).We also tested the accuracy of other data items that affectthe price commissioners pay for a spell under PbR: age onadmission, admission method, sex, and length of stay.For each of these data items the information in SUS wasverified against information in source documentation.A review of each Trust’s previous PbR audit action plan wasalso undertaken to assess its progress against previous auditreport recommendations.For more information of the PbR data assurance programme visit ayment by results data assurance framework, Improving the quality of costing in the NHS, June 20146Payment by results data assurance framework, The quality of Mental Health care cluster costing and activity data in the NHS, August 20147Comorbidities are conditions that exist in conjunction with another disease. Common examples of comorbidities are diabetes, asthma, hypertension, chronic obstructive airways disease and ischaemic heart disease.8The National Benchmarker is freely available to the NHS. To request a log-in go to www.nationalbenchmarker.co.uk9HRGs are a case mix grouping methodology organised by the body system and given clinical coherence by allocating diagnosis and procedure code combinations into groups which consume a similar level of resources.ChecklistSummaryThe coding of comorbidities and complications was selectedas a national theme because audit results identified this as anissue that had an impact on the quality of clinical coding inevery previous year of the PbR audit programme.Background1 00 FCEs were chosen for local review by clinicalcommissioning groups (CCGs), to address an area of localconcern or to gauge the benefit of undertaking qualityimprovement work in a specific area.FindingsApproachnComorbiditiesThe assurance framework4 is an integral part of the paymentsystem and provides the only independent and comprehensivedata quality programme within the NHS. The focus of this workis to improve the quality of data that underpins payments,but the data reviewed is also of wider importance to the NHSas it is used to plan and oversee healthcare provision.The assurance framework is delivered by Capita CHKS.Responsibility for the data assurance framework has movedto the Department of Health from the Audit Commission.The Department of Health, Monitor, NHS England and theNHS Trust Development Authority provide overall managerialdirection for the agreed assurance framework’s workprogramme for 2013/14.CausesFor the past seven years the Paymentby Results (PbR) data assuranceframework has provided assuranceover the quality of the data thatunderpins payments as part of PbR,promoting improvement in dataquality and supporting the accuracyof payment within the NHS.ImplicationsBackground and approach4Appendix5
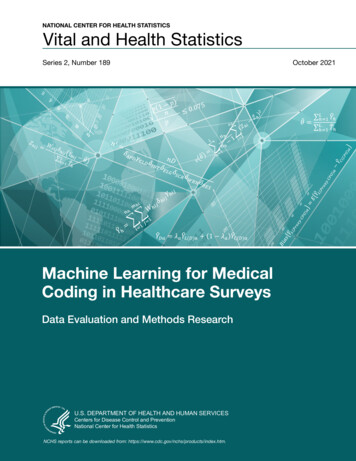
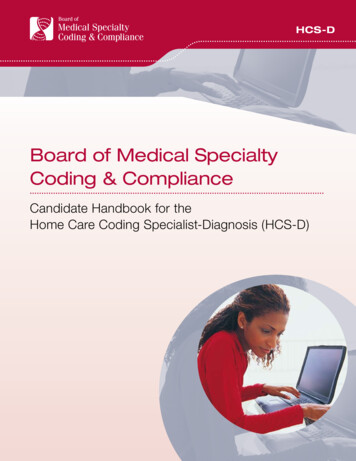
Table 2: Percentage of spells changing payment at trusts auditedInterquartile rangeSpells changing priceMinimumLower quartileMeanUpper quartileMaximum1.15.27.010.545.8Figure 1: Spells changing payment by trust auditedFigure 2: Net difference in charges to commissioners by trust auditedLower quartile50%45%40% 30,000Upper quartile 20,000 10,00035%30%25%ChecklistSummaryWhilst the average net error rate is low, there were significantoutliers identified through the audit. Although some trustshad low rates of spells changing payment, these errors relatedto activity with a high monetary value. Figure 2 shows thenet difference in charges to commissioners. A negative valuereflects an overcharge to the commissioner.BackgroundThe best performing 25 per cent of trusts had error rates between1.1 and 5.2 per cent of spells changing price. The average errorrate at trusts audited was 7.0 per cent of spells changingprice. 25 per cent of trusts had between 10.5 per cent and45.8 per cent of spells changing price.40 trusts in the audit sample were selected because theywere identified as being at risk of poor data quality, and 10were selected at random. Looking at the results of these twogroups, the error rate for the random sample was lower, withan average of 7.1 per cent spells changing payment in therandom sample compared with 9.5 per cent in the “at risk”group. As the areas selected varied by Trust, this does notallow a direct national comparison of the data results acrossall Trusts audited.We audited 8,990 episodes of care which equates to 15.3million of NHS expenditure. There was a gross financial errorof 633,016; 4.1 per cent, for the spells audited. This is thetotal value of the errors, irrespective of who they favoured.The net financial error was 0.1 per cent, or 20,634, andreflected a small under-charge by providers in total.FindingsTable 2 below shows the percentage of spells changingpayment in the sample audited. Figure 1 shows the spread oferrors in spells changing payment across the trusts audited. CausesThere was a large range in theproportion of spells changing priceat trusts audited. No trust achieveda 0 per cent error rate.ComorbiditiesFindings- 1,000%5%0%- 2,000%- 30,000- 40,000Appendix15%10%Implications20%
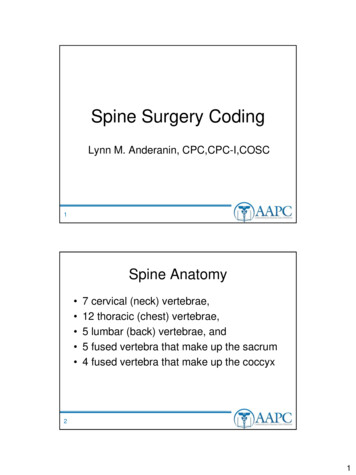
SummaryOne trust, which accounted for 10% of the spell length ofstay errors, had errors specifically relating to short stayassessment units. These units sometimes have governanceissues in respect of clerking in patients which can result inpoor data quality. This poor data quality also impacted onthe classification of patients’ subsequent admission methods.Other common causes for incorrect admission and dischargeinformation were poor source documentation and datacapture not being carried out in real time which meansvalues can often be left as a system default.10MeanUpper quartileMaximumClinical codesincorrect3.18.010.814.838.4Primary diagnosiscoding error1.05.18.812.834.0Secondary diagnosiscoding error3.47.611.415.239.3Primary procedurecoding error 100.54.76.714.325.7Secondary procedurecoding error1.510.617.429.172.2Figure 3: Spells changing payment 2013/14 results vs.2012/13 results by trust auditedFigure 4: Split of errors made in other data itemsat trusts auditedSpells changing payment2013–14Spells changing payment 2012–13or HRGs changing 2011–1244% Spell LoS43% Age13%AdmissionMethod0% Sex50%40%30%20%10%0%10%20%30%In this case the primary procedure is the procedure recorded in the first position in the data, which may not by the dominant procedure that determines the HRG when the spell is grouped.BackgroundLower quartileFindingsMinimumComorbidities29 of the 50 trusts audited had no data item errors. Of theremaining 21 trusts with errors, these mainly related to errorsin length of stay or age. Figure 4 shows the percentage splitof the errors. Spell length of stay relies on accurate recordingof admission date and discharge date. Accurate recording ofadmission and discharge dates is important to ensure that,where applicable, the correct trimpoint and excess bedday calculations are generated. It is also important in thecompliance with readmission rules.Interquartile rangeCausesTrust performance varies each year and many trusts have notbeen able to consistently achieve good levels of accuracy. Thisis partly because we focus work on areas where commissionersand benchmarking data suggest there is room for improvement.We also audit different areas each year. Coding is more complexin some areas than others and this can lead to varying trusterror rates. Figure 3 shows the latest error rates compared tothe previous error rates for the trusts audited in 2013/14.The audits also looked at the accuracy of other data itemsthat affect the price commissioners pay for a spell under PbR:age on admission, admission method, sex, and length of stay.For each of these data items the information in SUS wasverified against information in source documentation.Table 3: Variation in performance for clinical coding at trusts auditedImplicationsThe accuracy of clinical coding across the trusts auditedwas variable. Table 3 shows the variation in performancefor clinical coding data for the sample audited.ChecklistcontinuedAppendixFindings
SummaryGenerally there was little variance in trust performance ineach of the samples. A trust either performed well in bothsamples or poorly in both.Lower quartileMeanUpper quartileMaximumComorbidities andComplications0.06.08.111.145.5Area ofLocal Choice0.03.06.012.246.3Table 5: Financial information (percentages are of original audit value11)Comorbiditiesand ComplicationsLocal area of choiceOverallTotal value of samplepre audit 8,454,536 6,841,299 15,295,835Total value of samplepost audit 8,510,212 6,806,257 15,316,469Gross difference 338,926 294,090 633,016Gross difference4.0%4.3%4.1%Net difference 55,676- 35,042 20,634Net difference0.7%-0.5%0.1%The pre-and post-audit sample is priced using full PbR business rules but does not take local amendments into account such as market forces factor (MFF), non-payment for emergency readmissions, non-electivethreshold, and any local agreements.11 AppendixImplicationsThe post audit value of the comorbidities and complicationssample showed an undercharge to commissioners. As outlinedin the next section, this is because on the whole the auditidentified an under-recording of comorbidities. The oppositeis true of the local area of choice sample, which showed anovercharge to commissioners and would often be focused onarea of concern to the commissioner. Table 5 gives thefinancial information split by the audit samples.MinimumBackgroundWhilst the results show that the interquartile spread is largerin the local area of choice, there was poorer performance incomorbidities and complications.Interquartile rangeFindingsThe audit was split into two samples; comorbidities andcomplications and an area of local choice. Table 4 shows thespread of errors in spells changing payment across the trustsaudited split by type.Table 4: Percentage of spells changing payment in the sample auditedComorbiditiesAnother trust accounted for 95 per cent of the errors on age.These were caused by the incorrect age being calculated bythe trust’s patient administration system.ChecklistcontinuedCausesFindings
In many HRGs the fifth character indicates the level ofcomplication or comorbidities (CC) of an HRG – for exampleFZ17A Abdominal Hernia Procedures 19 years and over withMajor CC where the last digit “A” indicates “with Major CC”.The first four digits of the HRG describe the disorder ortreatment, such as FZ17 indicating “Abdominal HerniaProcedures 19 years and over”. The first four digits are knownas the HRG root.A fifth digit of Z (such as in PA55Z Respite Care) denotes noCC split for that HRG. There are some HRG subchapters that12SummaryBackground1400012000100008000have no HRGs with CC splits, such as BZ Eyes and PeriorbitaProcedures and Disorders.Secondary diagnosisincorrect40002000Secondary diagnosiscorrect0Comorbidities andcomplicationsLocal areaname, the majority of HRGs that grouped to a level of CCin the audit sample were as a result of comorbidities, notcomplications.When the grouping logic for a HRG with a CC split changes aspart of HRG design updates, the HSCIC change the fifth digit,which is why some HRGs use different letters such as D-F orS-V to denote the level of CCs.Length of stay can also impact on HRGs. For example, agastrointestinal bleed with a length of stay of 1 day willgroup to FZ38F gastrointestinal bleed with length of stay1 day or less irrespective of the level of complications andWhether a comorbidity impacts on the level of CC of an HRGcomorbidities recorded. The patient would need to staydepends on whether it appears on the code to group CC list for in hospital 2 days or more to group to HRG FZ38Dthat HRG subchapter produced by the HSCIC as part of theGastrointestinal Bleed with length of stay 2 days or more withdocumentation for the local payment grouper, these listsMajor CC, dependent on the secondary diagnoses recorded.contain conditions likely to impact on the resources used forthe delivery of care for each HRG subchapter. Despite thePage 40 of Coding Clinic April 2014.HSCIC clinical coding audit methodology excludes errors from the final audit figures that result from including codes that are not relevant to the episode of care. The PbR data assurance framework admittedpatient care audits include all error types, including “not relevant” codes in the report data as they can have a direct impact on the assignment of HRGs and therefore payment.13 Findings6000Whilst we focused half the audit sample on comorbidities,the issue impacts on all spells that are coded. Figure 5 showsthat the number of secondary diagnoses and error rates inthe local choice area were very similar to those in thecomorbidities area. 13.0 per cent of secondary diagnoseswere incorrect in the comorbidities and complications area,and 13.6 per cent of the secondary diagnoses were incorrectin the locally selected area13.ComorbiditiesHRGs with comorbidities and complications16000CausesIn March 2011, updated guidance for recording comorbiditieswas published by NHS Connecting For Health (now part ofthe HSCIC). This was followed in April 2013 by a list ofmedical conditions and other factors influencing health thatare always considered to be clinically relevant. The conditionsincluded on this list must always be coded for any admittedThe audit sample in this area comprised spells that groupedto an HRG where the level of comorbidities and complicationsaffects the price charged – half the spells were designated as“with comorbidities and complications” (including intermediateand major comorbidities and complications) and half werewithout comorbidities and complications.Figure 5: Accuracy of secondary diagnoses in the audit sampleImplicationsComorbidities are conditions that exist in conjunction withanother disease, such as diabetes, asthma, hypertension, chronicobstructive airways disease and ischaemic heart disease. Theinclusion of these in the data that underpins payment mayincrease the price paid for individual patients.patient care episode (including day cases) when documentedin the patient’s medical record for the current hospitalprovider spell, regardless of specialty12.AppendixThis year we focused half the auditprogramme on comorbidities inresponse to growing concern fromcommissioners in this area.ChecklistComorbidities
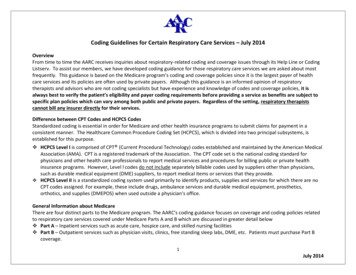
Figure 6 shows that across the whole audit sample just 19 percent of comorbidities audited were coded in error. Instead,nearly half of the comorbidity errors identified were causedby trusts not identifying legitimate secondary diagnoses.SummarynGuidance stipulates that non-mandatory comorbiditiesshould only be coded where identified as clinically relevantand 46 per cent of the comorbidities not coded werenon-mandatory. However, no distinction is being made byclinicians between relevant and not relevant whencomorbidities are recorded in source documentation. As such,any comorbidities written in the notes will be included by theclinical coder, and will be viewed as relevant for the purposesof our audit. More work needs to be done nationally andlocally to ensure only clinically relevant comorbidities areincluded in coding.nnc oding the comorbidities – coders need to fully understandthe rules around comorbidities, and be coding themaccurately; capturing the comorbidities – adequate information mustbe captured consistently in source documentation, and thisinformation should be made fully available for the purposesof clinical coding; and ensuring the comorbidities are relevant – which onlyclinicians can decide.Figure 7: Levels of complications for spells changing paymentin the comorbidities audit sampleFigure 6: Types of comorbidity coding errors50%Moved to HRGwithout a CC split45%40%11%24%30%HRG changed butlevel of CC has not25%Causes35%Moved to a differentHRG sub chapterChecklistOur audits therefore point to three issues that need to beimproved in order so that comorbidity information is fit forpayment purposes:BackgroundDespite being an area of concern for commissioners, ouraudits found that providers were consistently under recordingcomorbidities. In particular, lesser known mandatorycomorbidities (such as personal use of anticoagulant therapy)were often omitted by coders.These findings point to an under-recording of comorbidities,which may be caused by the quality of source documentationand tight deadlines highlighted in the next section. However,auditors reported issues around the relevancy of comorbidities.FindingsWhilst overall the results of the comorbidity audit samplereflected a slight under-charge by providers, there was noconsistent theme to the HRG errors. Figure 7 shows themovement in the levels of complications for the 368 spellschanging payment in the comorbidities audit sample. 32 percent of spells changed the level of complications within thesame HRG %0%Comorbiditiesnot codedComorbiditiescoded that shouldnot have beenComorbiditiescoded inaccuratelyMoved to lowerlevel of CC17%Moved to higherlevel of CCAppendix10%Implications15%
big and cumbersome; in a poor physical condition and were held together withelastic bands;replaced by temporary plastic folders; and disorderly, with information on individual episodes spreadthroughout a volume, individual specialties not filed inseparate sections, and loose sheets not filed at all.nnnnWhen paper case notes are in a poor condition, it slows thecoders work and makes it difficult for coders to extract theright information from them. To hit deadlines coders oftenrely on discharge summaries to clarify diagnoses and treatmentsthat are difficult to find in the notes. 48 per cent of the trustsaudited used the discharge summary as the only or mainsource for coding.Auditors also noted the pressure coding departments areunder. Areas of concern were:nnnnnt ighter deadlines – the deadline for coding variedconsiderably, with some trusts still working to the freezedate (70 days after month end); however 58 per cent oftrusts had deadlines under 10 days after month end, with12 trusts fully coded in 2–3 days; vacant posts – 54 per cent of trusts audited had vacanciesat the time of audit, with one Trust having 11 posts unfilled; inexperienced staff – even if posts are filled, the skill mix ofstaff can still be an issue; 42 per cent of trusts had at leastone unqualified coder; coding manager involved in coding duties – 42 per cent ofcoding managers were also coding as well, although onlyseven coding managers spent longer that 25 per cent oftheir time coding; auditors and trainers – regular reviews and support tocoders are necessary to achieve and maintain accuratecoding, however 40 per cent of trusts did not employ aThe Clinical Classifications Service at the HSCIC is thedefinitive source of clinical coding guidance and sets thenational standards used by the NHS in coding clinical data.Some errors were caused by coders not following nationalstandards or not using correctly following the four-stepprocess for coding.The HSCIC have released updated clinical coding guidance in2013/14 which coding teams must follow to ensure that theyare maintaining their coding levels to the national standards.Payment by results data assurance framework, Findings from the first year of the national clinical coding audit programme, August 2008have a direct impact on the assignment of HRGs and therefore payment.Trusts can buy in training and audit from external companies to fulfil this requirement.ChecklistSummaryRecurring coding errorsBackgroundThe NHS is facing unprecedented financial challenges. Trustsshould beware of cutting costs on recruitment, training and ITsystem for coding in an attempt to make savings. The increasedpressure on staff is resulting in inaccurate data and as thequality of coding goes down, so will the accuracy of paymentsbased on it.FindingsThe condition of the notes is impacting on data quality andthe accuracy of payments made. It also poses a risk to patientsafety. Medical records are a legal document and trusts mustensure they are fit for their many purposes.nqualified coding auditor, and 58 per cent of trusts did nothave their own approved trainer15; and coding system issues – 24 per cent of trusts had errorscaused by the limitations of their systems, such as notaccepting the 5th digit on diagnosis codes, limiting thenumber of diagnoses and procedure codes that can berecorded or submitted, and problems with the use ofdagger and asterisk f
coding and other data items that drive payment at 50 acute trusts. These trusts consisted of: n 40 trusts "at risk" of poor coding quality to improve local data quality; and, n 10 trusts selected at random. We used a risk assessment to identify the 40 'at risk' trusts, similar to the reference costs review programme also undertaken this .