Transcription
Author's personal copyInternational Journal of Food Microbiology 130 (2009) 27–34Contents lists available at ScienceDirectInternational Journal of Food Microbiologyj o u r n a l h o m e p a g e : w w w. e l s e v i e r. c o m / l o c a t e / i j f o o d m i c r oPrevalence and factors associated with aflatoxin contamination ofpeanuts from Western KenyaC.K. Mutegi a,b,⁎, H.K. Ngugi c, S.L. Hendriks a, R.B. Jones daAfrican Centre for Food Security, University of KwaZulu-Natal, Private Bag X01, Scottsville, 3209, South AfricaKenya Agricultural Research Institute, P.O Box 57811-00200, Nairobi, KenyaDepartment of Plant Pathology, Pennsylvania State University, 290 University Drive, Biglerville, PA 17307, USAdInternational Crops Research Institute for the Semi Arid Tropics (ICRISAT), P.O Box 39063-00623, Nairobi, Kenyabca r t i c l ei n f oArticle history:Received 25 August 2008Received in revised form 3 December 2008Accepted 21 December 2008Keywords:AflatoxinMycotoxinsKenyaGroundnutsa b s t r a c tAflatoxin contamination of peanuts poses a risk to human health and has been identified as a majorconstraint to trade in eastern Africa. A survey was carried out to obtain baseline data on levels of aflatoxin inpeanuts from major production regions in western Kenya. A total of 384 and 385 samples from Busia andHomabay districts, respectively, were obtained and analyzed for aflatoxin content with an indirectcompetitive ELISA protocol. Levels of aflatoxin ranged from 0 to 2688 and 7525 µg/kg in samples from Busiaand Homa Bay, respectively. Of 769 samples, 87.01% contained b 4 µg/kg of aflatoxin, 5.45% were in the range 4 and 20 µg/kg, while 7.54% exceeded the Kenya's regulatory limit of 20 µg/kg. There was a highly significant(χ2 14.17; P b 0.0002) association between district of origin and sample aflatoxin levels. This observationwas supported by a significant (χ2 11.98; P 0.0005) association between levels of aflatoxin and agroecological zones. Only 3.26% of the samples from the dryer LM3 zone had N 20 µg/kg compared with 10.28% ofthe samples from the wetter and humid LM1 zone. There was also a highly significant (χ2 9.73; P 0.0018)association between cultivar improvement status and aflatoxin levels. Logistic regression analysis revealedthat the odds for peanuts from Busia being contaminated were 2.6 times greater than those for peanuts fromHomabay. Planting improved cultivars would lower the odds of contamination to a half (odds ratio 0.552)those for local landraces. These results are discussed in relation to the risk of human exposure to aflatoxinsand the need for proper sampling procedures for regulatory purposes. 2009 Elsevier B.V. All rights reserved.1. IntroductionPeanut is an important crop in terms of nutrition and income inwestern Kenya. The nuts contain high levels of protein (Desai et al.,1999) and are relatively affordable compared to other sources ofprotein (Mayatepek et al., 1992). In western Kenya, peanut has theadded appeal in that two crops can be harvested in a year. WesternKenya encompasses Nyanza and Western provinces, which are mainpeanut producing areas in the country according to the CropDevelopment Division Annual Report of 2004 (Anon, 2004). Nyanzaprovince is the country's largest peanut producer with 14,723 haunder production while Western province with 2667 ha ranks thirdafter Eastern province (Anon, 2004). Most of the produce is traded inlocal markets (Ogwang, 2006).Aflatoxin contamination of peanuts poses a risk to human healthand has been identified as a major constraint to trade in Africa(Lubulwa and Davis, 1994). Little is known about the prevalence orlevels of aflatoxin in peanuts harvested in western Kenya. However,⁎ Corresponding author. Kenya Agricultural Research Institute, P.O Box 57811-00200,Nairobi, Kenya. Tel.: 254 20 7224556/ 254 734 605268.E-mail address: ckawirra@yahoo.com (C.K. Mutegi).0168-1605/ – see front matter 2009 Elsevier B.V. All rights ral indicators and anecdotal evidence suggest possible humanexposure to aflatoxins. First, western Kenya has repeatedly recordedhigh levels of stunting in children (Central Bureau of Statistics, 2003),an aspect often positively correlated with long-term ingestion of sublethal doses of aflatoxin (Gong et al., 2002; Bhat and Vasanthi, 2003).Second, erratic rainfall, high temperatures and high humidityprevalent in the major production areas favour peanut contaminationand development of aflatoxin. Wet and humid areas have been linkedto higher levels of aflatoxin producing fungi in other parts of EasternAfrica (Udoh et al., 2000; Kaaya and Kyamuhangire, 2006) and Nigeria(Atehnkeng et al., 2008). Third, peanuts in Kenya are produced undersmall holder conditions, characterised by mechanical damage to pods,poor harvesting, drying and storage methods, linked to aflatoxincontamination of peanut elsewhere in sub-Saharan Africa (Jones andDuncan, 1981; Bilgrami and Choudhary, 1990; Waliyar et al., 2005a).Fourth, many farmers plant local varieties that are susceptible todisease such as rosette, mould and leaf spots (Ogwang, 2006). Whiledisease and pests of peanut are common in western Kenya (Ngugi,H.K., personal communication), the small holder nature of peanutcultivation that uses minimal investment in inputs precludes theuse of modern management tactics such as chemical pesticides;stress from disease and insect pests can predispose peanut plants to
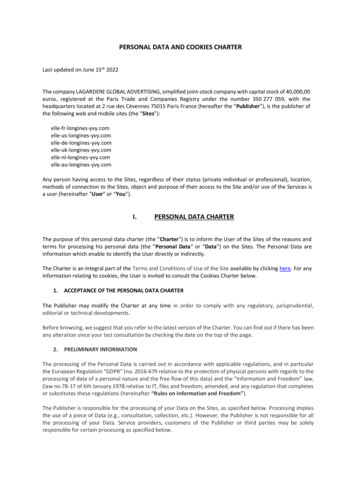
Author's personal copy28C.K. Mutegi et al. / International Journal of Food Microbiology 130 (2009) 27–34Fig. 1. Sampling areas within Busia and Homabay districts, stratified based on agro ecological zones. Some sampling points may overlap on the map.
Author's personal copyC.K. Mutegi et al. / International Journal of Food Microbiology 130 (2009) 27–34aflatoxin contamination (Hell et al., 2000; Chapin et al., 2004; Timperet al., 2004; Kaaya et al., 2005).In spite of the paucity of data on aflatoxin, production of peanuts inwestern Kenya is on the increase due to recent initiatives. For example,the International Crops Research Institute for the Semi Arid Tropics(ICRISAT) has introduced improved varieties and seed bulkingprograms to meet increasing demand for high quality seed. Increasedproduction will require peanut traders in the region to seek externalmarkets that impose strict safety standards. These stringent measuresare mainly driven by the health implications of aflatoxin, which is bothcarcinogenic and immunosuppressive (Fooladi and Farahnaky, 2003),and the toxin's common presence in peanut and maize commodities(Council for Agricultural Sciences and Technology, 1989). For example,the European Union (EU) market has a tolerance level of 2 µg/kg foraflatoxin B1 and 4 µg/kg for total aflatoxin for peanut kernels importedinto the EU (Sobolev, 2007).To ensure aflatoxin requirements for external markets are attained,there is a need to develop sampling procedures suited to localproduction systems and identify factors associated with high levels ofaflatoxin contamination. Information on factors that influence thelevel of aflatoxin is critical to developing mitigating strategiesappropriate for the region. This study was undertaken to: establishbaseline levels of aflatoxin in peanuts harvested in western Kenya;identify factors associated with high levels of aflatoxin; and to modelthe relationship between these factors and the likelihood of a peanutsample from western Kenya exceeding the national aflatoxin regulatory threshold.2. Methods2.1. Survey and peanut sample collectionA household survey was carried out in Busia and Homabay districtsin western Kenya (Fig. 1). These districts were chosen based on theirsignificance in terms of peanut production, and because they offered acontrasting environment under which peanuts are cultivated. In Busiadistrict, peanuts are mainly grown in the wetter and more humidLower Midlands (LM) agro ecological zone (AEZ), otherwise referredto as LM1, in contrast with Homabay district where the crop is mainlyproduced in the drier LM3 zone.The survey was based on a total of 769 peanut-growing households, with 384 and 385 respondents from Busia and Homabaydistricts, respectively. Information was collected through personalinterviews using a pre-tested questionnaire, which was developedafter conducting focus group discussions involving 40 and 44 participants from Busia and Homabay districts respectively. The participants were drawn from peanut farmers, village elders, communityleaders and provincial administration staff. Thereafter a total of 40randomly selected households were used to pre-test the developedquestionnaire, 20 from Asego division of Homabay district and 20from Butula division of Busia district. Each of the 40 households wasselected by staggering every fourth household within the locationadministrative boundary, the starting point being the fourth household from the division's agricultural office from where activities forthe day commenced.For the purposes of sampling, the district was stratified into AgroEcological Zones (AEZs), namely LM1, LM2 and LM3, where peanut iscommonly grown. The AEZs are determined based on altitude, meanannual rainfall, temperature, evapotranspiration and the probability ofsuccessfully growing the main crops of that zone (Jaetzold andSchmidt, 1982; Ngugi et al., 2002). The sample size for each AEZ wasproportionate to acreage under peanut production (Table 1). Production statistics were obtained from the Ministry of Agriculture, whileupdated information on the AEZ mapping was acquired from theGeographic Information Systems Centre at the World Agro ForestryCentre, Nairobi, Kenya. Within the AEZs, farmers were randomly29Table 1Numbera of peanut samples obtained from households in different agro ecologicalzones (AEZ) within each of the two districts surveyed in western Kenya, August 2006DistrictAEZBusiaHomabayTotalLower Midland1Lower Midland 2Lower Midland 3Total (n)193 (221)152 (174)39 (45)38432 (487)161 (2455)192 (2930)385225313231769aValues in parenthesis represent peanut production in hectares.selected at village level from a list compiled by the extension staff ofthe Kenya Ministry of Agriculture (MOA).Data collected through the survey included farm size; whether ornot respondents practiced crop rotation; number of times a crop wasweeded per season; fertiliser use (whether commercial fertilisers,organic fertilisers or no fertiliser was used on the crop); pest anddisease management practices (commercial pesticides, organic pesticides, cultural methods, and no control method at all); whether or notrespondents perceived drought, erratic rainfall, damage by moles and/or rats as production problems; type of cultivar(s) planted (whetherimproved or local landrace); aspects of peanut utilisation (e.g. methodsof food preparation and whether crop was sold); and various aspectsof awareness about aflatoxin. Farmers also were asked whether ornot they belonged to a Producer Marketing Group (PMG); a PMG beinga group of local peanut farmers brought together for the purposes ofsourcing markets and to facilitate technology transfer (Mutegi et al.,2007). A 1 kg peanut sample was obtained from each interviewedhousehold for aflatoxin testing. The sample was drawn from differentparts of the farmer's storage container and thoroughly mixed. Thesamples were assayed for levels of aflatoxin as described below.2.2. Determination of levels of aflatoxinA 200 g sub-sample was drawn from each 1 kg sample and groundinto a fine powder using a dry mill kitchen grinder (KanchanMultipurpose Kitchen Machine, Kanchan International Limited,Mumbai, India). The ground sample was then sub-divided into twoequal portions. The powder was triturated in 70% methanol (v/v 70 mlabsolute methanol in 30 ml distilled water) containing 0.5% w/vpotassium chloride in a blender, until thoroughly mixed. The extractwas transferred to a conical flask and shaken for 30 min at 300 rpm.The extract was then filtered through Whatman No.41 filter paper anddiluted 1:10 in phosphate buffered saline containing 500 µl/l Tween20 (PBS–Tween) and analyzed for aflatoxin with an indirectcompetitive ELISA (Waliyar et al., 2005b) by preparing an aflatoxin–bovine serum albumin conjugate in carbonate coating buffer at100 ng/ml concentration and dispensing 150 µl in each well of theNunc-Maxisorp ELISA plates (Thermo Fisher Scientific Inc).The plates were incubated at 37 C for 1 h before the toxin solutionwas collected and stored in a large glass bottle for disposal. The plateswere washed in three changes of PBS–Tween, allowing a holding timeof 3 min per wash. The plates were blocked with a 200 µl per wellsolution of 0.2% bovine serum albumin (BSA) in PBS–Tween andincubated at 37 C for 1 h. The blocked plates were then washed inthree changes of PBS–Tween allowing 3 min for each wash. To thewashed plates, 100 µl of peanut kernel extract was added followed by50 µl of antiserum. Instead of the peanut kernel extract, 100 µl aliquotsof different concentrations of AFB1 (25 ng to 100 pg) were added intothe first 20 wells (two rows of 10 wells each) to serve as a standard.The plates were then incubated for 1 h at 37 C to facilitate reactionbetween the toxins and the antibody.The plates were subsequently washed in three changes of PBS–Tween allowing 3 min for each wash. A dilution of 1:1000 goat antirabbit IgG labeled with alkaline phosphatase was prepared in PBS–Tween containing 0.2% BSA. A 150 µl aliquot was added to each well,
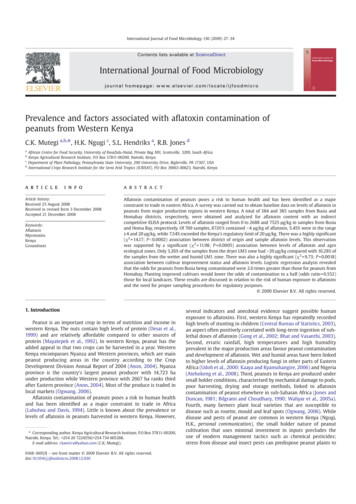
Author's personal copy30C.K. Mutegi et al. / International Journal of Food Microbiology 130 (2009) 27–34Table 2Amounts of aflatoxin with biological and/ or economic relevance used to establishfrequency distributions of aflatoxin levels in Busia and Homabay districtsDescription of economic or biological relevanceCategory based onCategorybiological and/ormid-pointsplotted (µg/kg) economic relevance(µg/kg)020N0– V 00–6000Undetectable levelsPermissible levels for total aflatoxins underthe EU regulations (Sobolev, 2007)Permissible levels for total aflatoxins accordingto KEBS (Mehan et al., 1991)Not safe for human consumption underKEBS standards, but safe for animal feed(Mehan et al., 1991)Based on LD 50 of various animal species(Mehan et al., 1991)Based on LD 50 of various animal species(Mehan et al., 1991)Manifestation of sickness symptoms—nausea,headaches, rush (http://ehs.ucdavis.edu/ucbso/FactSheet Aflatoxin.html)content: samples with b4 µg/kg; 4 µg/kg to 20 µg/kg, and N20 µg/kg. The b4 µg/kg category represents the EU regulatory limit for totalaflatoxins (Felicia, 2004); peanuts in the second group would berejected in the EU but accepted under the Kenya Bureau of Standards(KEBS) limits (Felicia, 2004), while nuts in the third category would berejected under the KEBS and EU standards. Categorical data analysisby means of contingency tables was used to assess for associationbetween these aflatoxin categories and descriptive variables.The relationship between factors identified as significantlyassociated with levels of aflatoxin and the likelihood of a sampleexceeding Kenya's regulatory limit of 20 µg/kg (here-after consideredcontaminated) was modelled using a logistic regression approach.The binary response variable was the sample level of aflatoxin(AL) whereby 1 20 µg/kg and 0 b20 µg/kg. All variables with asignificant association (P b 0.05) were tested as explanatory variablesand those found to be insignificant were dropped to obtain the mostparsimonious model. Categorical data analyses (Stokes et al., 2000)were carried out using SAS Ver. 9.1 (SAS Institute, Carry, NC).3. Resultsand incubated for 1 h at 37 C. The plates were washed in threechanges of PBS–Tween, added a 150 µl per well of substrate solution(p-nitro phenyl phosphate prepared in 10% diethanolamine buffer,pH 9.8) and incubated for about 1 h at room temperature. Absorbancewas measured at 405 nm in an ELISA plate reader (Multiskan Plus,Labsystems Company, Helsinki, Finland).2.3. Statistical analysesIn order to characterise the distribution of aflatoxin levels, sampleswere grouped into categories with established economic (levels usedto impose trade restrictions) or biological relevance (based on LD 50 ofvarious animal species), based on their aflatoxin content (Table 2). Foreach district, the percentage of samples in each category wascalculated and plotted against median values for the categories toobtain frequency distribution histograms. To test if the resultingfrequency distributions were similar for the two districts, the datawere subjected to Kolmogorov–Smirnoff and the Mann–Whitney Utwo samples tests (Sprent and Smeeton, 2001). Several probabilitydistribution models (negative binomial, gamma and lognormaldistributions) were also evaluated for their ability to describe thefrequency distributions. Goodness of fit for the probability distribution models was assessed by analysis of deviance using GenStat Ver 9.1(Lawes Agricultural Trust, Rothamsted Experimental Station).To identify factors associated with different levels of aflatoxin, thesamples were grouped into three categories based on their aflatoxin3.1. Levels of aflatoxin in peanut samples from Busia andHomabay districtsThe levels of aflatoxin ranged from 0 to 2687.6 µg/kg and from 0 to7525.0 µg/kg in samples from Busia and Homabay districts, respectively. Overall, 63.7% of all samples had undetectable levels of aflatoxinwhile 7.54% were contaminated based on KEBS standards; 2.1% ofthe samples were unsuitable even for animal feed (i.e. exceeded100 µg/kg) based on FDA action levels. Kolmogorov–Smirnoff (K–S)and the Mann–Whitney U two samples tests (Sprent and Smeeton,2001) showed that the frequency distributions of aflatoxin levels insamples from the two districts were significantly different (K–SP 0.325; Mann–Whitney U-test: P 0.798 for equal distribution). Forboth districts, however, the resulting distributions were highlyskewed to the left indicating that most of the samples were safebased on the KEBS and EU regulatory limits (Fig. 2). The distributionswere generally well fitted by gamma, negative binomial andlognormal distributions with the gamma distribution providing thebest fit for samples from the two districts (e.g. deviance values for thethree models were 17.94, 22.72 and 36.13, respectively, for samplesfrom Busia district).3.2. Factors associated with levels of aflatoxinFig. 3A shows percentage of samples in each of the three categoriesof aflatoxin levels plotted against the district of origin, i.e. Busia orFig. 2. Frequency distribution of levels of aflatoxin in peanuts from Busia (A) and Homabay (B) based on mid-points of aflatoxin categories with biological and/or economicimportance. Fitted values are frequencies obtained from fitting the gamma probability distribution function to the observed values.
Author's personal copyC.K. Mutegi et al. / International Journal of Food Microbiology 130 (2009) 27–3431Fig. 3. Percentage of samples in the three categories of levels of aflatoxin plotted against district of origin of the sample (A), agro ecological zones (B), cultivar type (C), and farmerresponse to whether or not the crop was damaged by moles (D).Homabay. A highly significant association (χ2 14.172; P 0.0002) wasfound between district of sample origin and aflatoxin levels. Thepercentage of safe samples according to KEBS standards was lower inBusia district (82.62%) compared to Homabay district (91.81%). While10.70% of samples from Busia district had aflatoxin levels N20 µg/kg,only 4.09% of samples from Homabay were in this category.There was a highly significant (χ2 11.983; P 0.0005) associationbetween AEZ and aflatoxin levels. A pattern was also noted whereby,the percentage of contaminated samples declined with decreasingprecipitation across the region (i.e. from the wet LM1 AEZ to the drierLM3 AEZ; Fig. 3B). The frequency of samples containing b4 µg/kg ofaflatoxin was 81.78% in LM1, 86.06% in LM2 and 93.49% in LM3.Conversely, samples with aflatoxin levels of 20 µg/kg were 10.28% inLM1, 8.71% in LM2 and 3.26% in LM3. Samples that would haveotherwise been accepted under the KEBS regulations but rejectedunder the EU regulations were 7.94%, 5.23% and 3.26% for LM1, LM2and LM3, respectively.A strong association was noted between levels of aflatoxin andcultivar improvement status (improved versus local landrace)whereby improved cultivars had significantly lower percentages ofcontaminated samples (χ2 9.748; P 0.0018 as shown in Fig. 3C).Indeed, for cultivars with a sufficient sample size (n N 45) a significantassociation (χ2 4.27; P 0.0388) between individual cultivars andlevels of aflatoxin was also noted, with more samples from the im-proved cultivars having lower levels of aflatoxin compared to the localcultivars (Table 3). For example, while improved cultivars ICGV 12988and ICGV 12991 had 92.75% and 95.56% of their samples respectivelybelow 4 µg/kg, Homabay Local and Local Red had 87.16 and 77.78% inthe same category. On the other hand, ICGV 12988 and ICGV 12991had 5.80% and 4.44% of the respective samples with aflatoxin levels 20 µg/kg, while Homabay Local and Local Red had 4.59% and 15.97%of the samples in this category.Table 3Association between levels of aflatoxin and cultivars commonly grown in Busia andHomabay districts of western Kenya, August 2006CultivarStatus ofcultivaranCG7Homabay localICGV88ICGV 12991Local redUganda redValencia redILIILII741096913514410047Percent of samples with different levelsof aflatoxinb 4 µg/kg 4–b20 µg/kg 20 0.006.259.002.132.704.595.804.4415.9710.006.38χ2 4.27; P 0.0388.aLocal landrace L; improved variety I.
Author's personal copy32C.K. Mutegi et al. / International Journal of Food Microbiology 130 (2009) 27–34Table 4Parameter estimates from a logistic regression relating levels of aflatoxin with district ofsample origin and cultivar improvement statusParameterDFEstimateSEWald χ2P N χ2InterceptDistrictCultivar improvement111 2.3060.488 0387A significantly higher proportion of samples obtained from farmerswho reported damage from moles as a problem had higher levels ofaflatoxin compared with those from farmers who had not experiencedrodent damage. While 83% of peanut samples from farmers reportingmoles as a problem had less that 4 µg/kg per sample, over 88% of thesamples from farmers who had no problem with this pest were in thiscategory of less than 4 µg/kg (χ2 4.449; P 0.0349; Fig. 3D).Although the proportion of samples with b20 µg/kg of aflatoxinwas numerically higher for farmers belonging to PMGs (which, amongother activities train farmers on methods to mitigate aflatoxincontamination) than non PMG members, the association was notstatistically significant (χ2 3.61; P 0.0573). No significant association was detected between levels of aflatoxin and use of fertilisers;number of times the crop was weeded; application of crop rotation;disease and pest control or drought during the cropping season.3.3. Relationship between factors associated with high levels of aflatoxinand the likelihood of finding a contaminated sampleLogistic regression analysis indicated that aflatoxin level (AL) wasonly significantly affected by district of sample origin (DT), andcultivar improvement status (CIP). There was no significant interaction between district of sample origin and cultivar improvementstatus (Table 4). The negative value of the estimate CIP indicates thatsamples obtained from improved cultivars were less likely to exceedthe regulatory limit. The fitted model describing this relationship was:logit (AL) 2.306 0.051 DT 0.594 CIP. The test for goodness-of-fit(D 0.968; P 0.325) indicated that the model fitted the data well.Including AEZ as an explanatory variable did not significantly improvethe fit of the model. Based on this model, the odds of a sample fromBusia exceeding Kenya's regulatory limit (20 µg/kg) were 2.65 timeshigher (Wald χ2 9.183; P 0.0024) those for a sample from Homabaydistrict. The odds for a sample from an improved cultivar exceedingthis threshold were a half (odds ratio 0.552) of those for a sampleobtained from a local landrace.4. DiscussionIn this study, the prevalence and levels of aflatoxin in peanuts fromwestern Kenya were investigated. The factors associated with highlevels of aflatoxin were identified, and the risk of a peanut samplefrom the region exceeding the national regulatory threshold of 20 µg/kg was determined. The results indicate that the levels of aflatoxinranged from 0 to N7525 µg/kg and were highly variable; that mostpeanuts from western Kenya are generally safe for human consumption but a small proportion of the samples contained very high levelsof aflatoxin. The data also show that peanuts from local landraces andthose harvested in the more humid agro-ecological zones within theregion were more likely to be contaminated with aflatoxin than thosefrom improved cultivars and/or from less humid agro-ecologicalzones.The data for describing the incidence of aflatoxin levels were wellfitted by gamma, negative binomial and lognormal probability distributions. This observation has two key implications. First, in comparing levels of aflatoxin for any grouping variable (e.g. AEZs, cultivars,agronomic practices, etc.), the median will be a more appropriatestatistic than the arithmetic mean, because of the highly skeweddistribution of the levels as shown by frequency plots. The secondimplication is that in designing sampling protocols for regulatorypurposes, the skewed nature of the distributions in incidence ofaflatoxin levels will need to be taken into account. By identifying thegamma distribution as the most suitable function for analyzing dataon the incidence of aflatoxin, the results also accord well with those ofBerry and Day (1973) who recommended the gamma distribution formodelling levels of aflatoxin when most samples contain undetectablelevels. This was based on their study with data on dietary aflatoxinsamples from Murang'a district in central Kenya.Over 92% of the samples were within Kenya's regulatory limit(20 µg/kg), while over 87% of the samples were also within the morestrict EU regulatory limit of 4 µg/kg indicating that at household level,most peanuts have acceptable levels of aflatoxin. These results areconsistent with studies conducted elsewhere in Africa. For example, asurvey carried out in Egypt reported low levels of aflatoxin inunshelled and shelled raw peanuts (El-Khadem, 1990) while in postharvest surveys on rain fed and irrigated peanuts in Sudan, none of thesamples obtained from the households visited contained aflatoxinlevels of more than 15 µg/kg (Singh et al., 1989).This study also showed lower levels of aflatoxin contamination ofpeanuts at household level compared to maize as has been reported inthe survey of 350 maize products conducted in Kenya including in theBusia district in 2004, whereby N55% of the samples exceeded the20 µg/kg limit while 35% had aflatoxin levels N100 µg/kg (Lewis et al.,2005). This observation implies that the risk of human exposure toaflatoxin from consumption of peanuts is much lower than thatassociated with contaminated maize. The significance of this observation is clearer when one considers that in Kenya peanut is eaten as aside dish, sauce or snack and consumed in relatively small amountscompared to maize, which is consumed in larger amounts of 0.4 kg/person/day (Shepherd, 2003).Nevertheless, a market survey of peanut aflatoxin contaminationwould be insightful in understanding the contribution of marketoutlets to the risk of aflatoxin exposure since additional contamination and aflatoxin accumulation can occur at various stages in theinformal peanut marketing cycle. The likelihood of higher contamination in market outlets increases when one looks at previous studies,that have documented high fungal and aflatoxin prevalence andincidence in marketed peanut kernels and their by products (Vermaand Agarwal, 2000; Ila et al., 2001; Le Anh, 2002). This infers thatgreater contamination than present at harvest may occur during thepeanut marketing chain.Of all the factors studied, only the source of sample origin (districtor agro ecological zone), damage by moles, cultivar improvementstatus and cultivar type were significantly associated with the levels ofaflatoxin in peanut samples. Previously, it was documented thatsignificant correlations between AEZ and aflatoxin levels existed,whereby a wet and humid climate tends to aggravate aflatoxin levels.In neighboring Uganda for example, aflatoxin levels in maize sampleswere higher in more humid areas compared to the drier areas (Kaayaet al., 2006) and similar results were obtained in a recent survey ofmaize samples from Nigeria (Atehnkeng et al., 2008). The significantlyhigher odds of peanuts from the Busia district being contaminatedcompared with those from the Homabay district could be partlyattributed to the distribution of AEZ within the districts; the wetterand humid LM1 is mainly found in Busia district while the drier LM3 ismainly found in Homabay district. It is difficult to pinpoint the specificcauses of higher levels of aflatoxin in the wet humid zone, but it isprobable that high moisture does not allow for sufficient drying ofnuts, that are in most cases dried on bare ground or polythene mats inhomesteads or in fewer instances dried in the field, in the studyregions. This is feasible due to frequent rainfall during the peanutharvesting months of July and December. However, it is not possible toconclusively resolve the issue in the present study because the peanutsamples analyzed were taken from on-farm storages, probably well
Author's personal copyC.K. Mutegi et al. / International Journal of Food Microbiology 130 (2009) 27–34after aflatoxin production had occurred. Regardless of the actualcauses, strategies aimed at mitigating the aflatoxin contamination andhuman exposure will
(2 14.17; Pb0.0002) association between district of origin and sample a atoxin levels. This observation was supported by a signi cant (2 11.98; P 0.0005) association between levels of a atoxin and agro ecological zones. Only 3.26% of the samples from the dryer LM3 zone hadN20 µg/kg compared with 10.28% of the samples from the wetter and humid .
