Transcription
CAGNY 2022Structurally gearing our portfoliofor mid single-digit growthFrançois-Xavier RogerEVP, Chief Financial Officer
DisclaimerThis presentation contains forward looking statements which reflect Management’s current viewsand estimates. The forward looking statements involve certain risks and uncertainties that couldcause actual results to differ materially from those contained in the forward looking statements.Potential risks and uncertainties include such factors as general economic conditions, foreignexchange fluctuations, competitive product and pricing pressures and regulatory developments.2February 25, 2022CAGNY
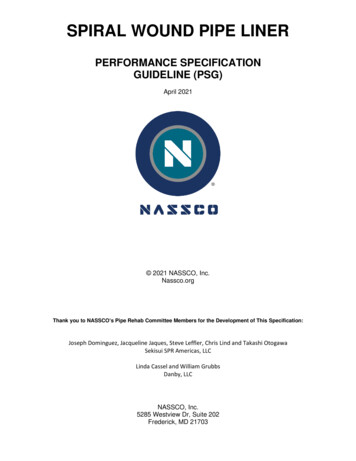
Our business is global, balanced and diversified2021 sales: CHF 87.1 bnWhere we sellWhat we sellEMENA30%25%45%ResourcesFebruary 25, 2022PetCareNutrition &Health SciencePrepared dishes& cooking aids27%18%15%14%Milk products& ice l. coffee)CAGNYNumber of employeesR&D spendFactories276 000CHF 1.7 bn354
Resilient financial results in 2021Organic sales growthUnderlying TOP marginUnderlying EPS (in CHF) 5.8% in constant 3.6%2020Return oninvested capitalFree cash flowCash returned to shareholders(CHF bn)(CHF bn)14.7%10.214.2%*20202021* Excluding Wyeth impairment4February 25, 2022CAGNY20208.714.513.9202120202021
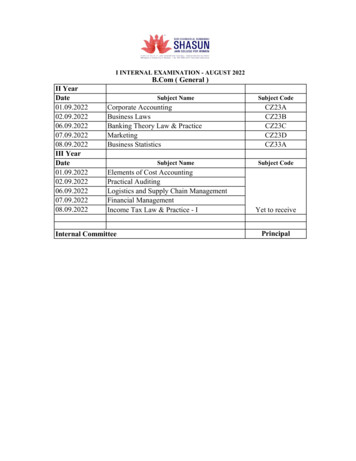
Portfolio geared for mid single-digit organic sales growthOrganic sales growth7.5%*Sustainablemid single-digit(4-6%)3.5%3.6% Investments in fast-growing categoriesand geographies Fast-paced innovation Increased digitalization Market share gains Portfolio rotation3.0%2.4%2017201820192020* Reflects elevated demand related to COVID-195February 25, 2022CAGNY20212022 and beyond
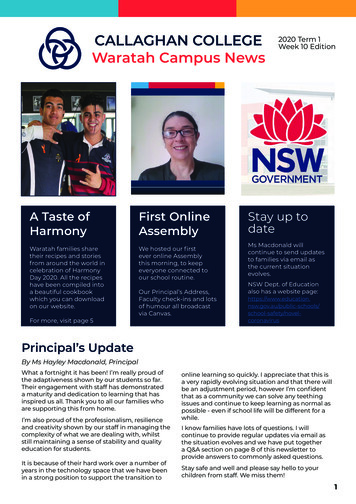
Playing in the fastest growing categories in food and beverageNestlépresence CAGR 2017-21#1 or #2 playerMeat SubstitutesTop 10 player-Limited presence19.1%Meal Kits18.6%Fresh Coffee BeansEdible Oils9.0%Condensed Milk8.8%Fresh Ground Coffee Pods8.0%Energy Drinks8.0%Cat Food7.8%Other Savoury Snacks7.8%Stock Cubes and Powders7.6%Source: Euromonitor(categories above CHF 4 bn value RSP)6February 25, 20229.8%CAGNYOperating in 7out of top 10
Portfolio increasingly focused, premiumized and digitalSalesCategoryProduct ased Health Science6%1%7February 25, 2022CAGNYE-commerce14%Premium35%
Outperforming in our largest categories and future growth platformsBuilding platforms for the futureWinning share in our largest reMarket size(retail value)CHF 144 bnCoffeeVitamins, minerals &supplementsCHF 86 bnOrganic growth 2017-2021*CHF 112 bnMarketNestléSource: Euromonitor*Vitamins, minerals & supplements is 2018-2021 and meat alternatives is 2019-2021 to reflect the timing of Nestlé’s entrance to the category8February 25, 2022CAGNYMeat alternativesCHF 5 bn
Increasing differentiation across categories, with market share gainsBroad-based market share gainsFocusing on value-added products65%% cellsgaining/holdingshare 60%45%2017Increasing focus on differentiationparticularly on premium, affordable andfunctional offerings9February 25, 2022CAGNY2018201920202021 80% of sales where we are the marketleader or close follower
Rapid innovation to better capture consumer trendsMore than 60 fast-track projects leading to launches within 6-12 months in 2021AffordabilityPremiumization 35% of sales 19% of emergingmarket sales 12.0% organic growth10February 25, 2022 7.7% organic growthCAGNYPlant-based food CHF 800 m sales 16.8% organic growthSustainabilityDigitalization 4 brands achieved carbonneutrality in 2021 14.3% of sales in ecommerce Converted all straws fromplastic to paper (4.5 bnannual quantity) 51% of marketinginvestment spent online
Stepping up investments behind growth platformsShort-term increase in capex to meethigher demandCapex as % of sales5.8%4.4%2017112018February 25, 20222019CAGNY2020202120222023
Combined with continuous prudent M&A yNorth AmericaWatersU.S Ice CreamCHF6.8 bn 80 bps 30%ofTransactions closed or announcedSales from acquiredOrganic sales growthUnderlying TOP marginsince 2017, equivalent tobusinesses in 2021*contribution in 2021*expansion since 2017 85 20% of Group sales* From acquisitions between 2017-2021122021February 25, 2022CAGNY
Creating significant value for shareholders27 years of dividendincreases in CHFShare buybacksCHF 102bn since200515-yearTSR:CHF 80 bnsince 20052.8 bnCHF0.0019952021Share price130Number of sharesoutstandingCHF14% CAGRvs. 10% forSTOXX F&B3.9 bn2.803.00Total shareholder return*20052021302005CHF 182 bn returned to shareholders since 2005* Total Shareholder Returns (TSR): Share price appreciation plus dividend reinvestment. Both Nestlé and peer median STOXX 1800 Global Food and Beverage are calculated in EUR. All data is gross except STOXX 15-year wherenet data is used as gross values are unavailable. Source Bloomberg Data as of 31.12.202113February 25, 2022CAGNY2021
Our mid-term value creation modelSustainedmid single-digit organicsales growthContinued moderateunderlying trading operating profitmargin improvementsContinued prudent capital allocationand capitalefficiency improvementsValue creation for both society and our shareholders14February 25, 2022CAGNY
Thank you!15February 25, 2022CAGNY
Fresh Ground Coffee Pods Condensed Milk Edible Oils Fresh Coffee Beans Meal Kits . All data is gross except STOXX 15-year where net data is used as gross values are unavailable. Source Bloomberg Data as of 31.12.2021 15-year TSR: Our mid-term value creation model 14 February 25, 2022 CAGNY Sustained mid single-digit organic sales growth .