Transcription
6 APPROACHES TO MONITORINGCOMPLEX TIBCO-CENTRIC APPLICATIONS
6 Approaches to Monitoring ComplexTIBCO-Centric ApplicationsTable of ContentsIntroduction . . . . . . . . . . . . . . . . . . . . . . . . . . . . . . . . . . . . . . . . . . . . . . . . . . . . . . . . . . 36 Common Monitoring Approaches for TIBCO Environments . . . . . . . . . . . . . . . . . . 4TIBCO Admin Tools, TIBCO Hawk, TIBCO RTView, APM Tools, Custom Monitors,RTView Enterprise EditionBecoming Proactive with End-to-end Monitoring . . . . . . . . . . . . . . . . . . . . . . . . . . . 10RTView Enterprise: End-to-end Monitoring for TIBCO-centric Applications . . . . . 12understanding large systems with logical groupings . . . . . . . . . . . . . . . . . 16understanding how components can impact a business service . . . . . . . 17support across multiple environments including the cloud . . . . . . . . . . . 18centralized real-time alerting and notifications . . . . . . . . . . . . . . . . . . . . 19custom displays & flow diagrams . . . . . . . . . . . . . . . . . . . . . . . . . . . . . . . . 20integration with other monitors and systems . . . . . . . . . . . . . . . . . . . . . . 21About SL . . . . . . . . . . . . . . . . . . . . . . . . . . . . . . . . . . . . . . . . . . . . . . . . . . . . . . . . . . . 22RTView and RTView Enterprise Monitor are trademarks of SL Corporation.TIBCO, BusinessWorks, TIBCO Enterprise Message Service, TIBCO Hawk, TIBCO BusinessEvents, and the TIBCO logo are registered trademarks of TIBCO Software Inc.2 2017 SL Corporation. All Rights Reserved.Last updated: Oct 24, 2017
16 Approaches to Monitoring ComplexTIBCO-Centric ApplicationsAs Many Companies Adopt Hybrid and Cloud StrategiesThey must continue to support their legacy applications which are running on older infrastructure. This cansqueeze IT Operations and Support teams which are tasked with doing more with fewer and fewer resources.In the TIBCO world, integration middleware is rapidly evolvingfrom running in traditional on-premise systems to hybridapplications or even running entirely in the cloud. Ascompanies architect for these environments, they are usingnew TIBCO products and services such as TIBCOBusinessWorks Container Edition, TIBCO FTL , and TIBCOCloud Integration (TCI). The challenge is how best tomonitor and manage both the older and newer platformsefficiently.This document will review the most common methods for monitoring TIBCO environments and show why adopting an endto-end monitoring platform to monitor on-premise, hybrid, or cloud applications and the supporting infrastructure is thebest solution.3 2017 SL Corporation. All Rights Reserved.SECTION 01SECTION 02SECTION 03SECTION 04
1Common Monitoring Approaches forTIBCO EnvironmentsTIBCO Administration ToolsTIBCO Hawk Several approaches are used formonitoring TIBCOenvironments. Each has itsadvantages and ideal use cases.The most common methods are:TIBCO RTView Standalone MonitorsApplication Performance Management (APM) ToolsCustom Built and Maintained MonitorsRTView Enterprise End-to-End Monitor4 2017 SL Corporation. All Rights Reserved.SECTION 01SECTION 02SECTION 03SECTION 04
2TIBCO Administration ToolsRuntime monitoring is only one of many tasks that middleware admin consoles aredesigned to perform, so the monitoring capability in these tools is limited.TIBCO users will always require admin tools to managetheir environments. However, users often strugglewith a multiple admin tool approach for monitoringcomplex environments.Admin tools are typically technology-specific and require users tomanually work through each environment to look at individualinstances to understand overall system health. It is challenging tounderstand the interplay between the different technologiesduring application run-time, therefore, understanding thebusiness impact of one technology on another in real-time isalmost impossible. Many administrators report that, uponreceipt of an application alert, it can take upwards of 4 hours justto identify which component is failing and have no way ofdetecting if the failure is part of a larger pattern.5Administration tools do not provide access tohistorical information which can complicatetroubleshooting since errors and issues can betransient and difficult to troubleshoot after the fact.The different tools also generate separate event andstatus information for each component.For high-performance business-critical applications,the vast amount of TIBCO runtime health and statusdata that are generated is challenging to comprehendusing an administration tool. 2017 SL Corporation. All Rights Reserved.SECTION 01SECTION 02SECTION 03SECTION 04
2TIBCO HAWK However, TIBCO Hawk does havesome limitationsUsers cannot save historical data, making it difficult totroubleshoot issues after they have occurred.Hawk interface does not lend itself to comparativeanalysis between engines, servers, and agents. Usersmust drill down to one engine or process individuallywhich can be cumbersome.TIBCO Hawk is TIBCO’s legacy monitoring solution and is broadlyused within TIBCO’s core integration customer base.It has been TIBCO’s primary monitoring solution for monitoringon-premise, distributed applications, and systems for years.It has proven to be very reliable and highly scalable with someimplementations consisting of tens of thousands of rule-based agents.6Hawk does not aggregate metrics across domains orenvironments which can be limiting to users wishing togain a better high level understanding of how theirenvironments are performing. 2017 SL Corporation. All Rights Reserved.SECTION 01SECTION 02SECTION 03SECTION 04
2TIBCO RTVIEW STAND ALONEMONITORSTIBCO RTView Standalone Monitors featurepre-built displays and pre-configured alertsSince no programming is required, the monitors can bedownloaded, configured and quickly deployed. Theseapplications have been broadly used within the TIBCOcustomer base for several years and are licensed throughTIBCO.RTView Standalone Monitors complements Hawkin several ways. Users can: Develop custom displays driven by Hawk metrics and alertsusing TIBCO RTView Standard Monitor (SL RTView Core) Archive Hawk metrics and alerts to relational and NoSQLdatabasesTIBCO resells these separateRTView monitors for: TIBCO RTView Monitor for EMS TIBCO RTView Monitor for BusinessWorks TIBCO RTView Monitor for BusinessEvents Create displays that blend data from Hawk and other datasources such as SQL7 2017 SL Corporation. All Rights Reserved.SECTION 01SECTION 02SECTION 03SECTION 04
2Application Performance Mgmt. ToolsAPM tools are sometimes used for monitoringTIBCO middleware environments from the primaryperspective of monitoring a transaction.APM tools can be beneficial for the right use cases, such as findingand debugging issues in transaction flows, creating transactionprofiles and providing application-centric performance views.Moreover, APM tools can be very good at identifying code-basedbottlenecks. However, APM tools have limitations when used tomonitor TIBCO environments:8APM tools are not designed forservice-level monitoring.They provide an external look at the JVMand not deep visibility into the TIBCOmiddleware running inside the JVM. This isa material limitation because most TIBCOBusinessWorks problems occur at theactivity level and not at the JVM level.APM tools often have limitationsaround monitoring C-based applicationssuch as TIBCO EMS and TIBCOActiveSpaces . Moreover, APM tools areunable to monitor EMS queues.APM tools require the installation andmaintenance of proprietary agents onevery machine.Maintenance costs will be higher sinceevery product update and upgrade requiresusers to update every agent.An APM tool can tell you where atransaction failed but not why since theyhave no transactional visibility into theentire TIBCO domain. 2017 SL Corporation. All Rights Reserved.SECTION 01SECTION 02SECTION 03SECTION 04
2Custom-Built & Maintained MonitorsUsers always have the option of creatingcustom monitoring tools, and this is a usefulapproach for many organizations.Custom-built tools can be very effective butrequire time to build and resources to maintainThe build vs. buy decisions is complicated and outside the scopeof this document.That said, the time to build a custom monitor and ongoingexpense of maintaining it, which includes modification andtesting to every update of the middleware, often outweigh thebenefits of creating an in-house solution.And internally developed monitoring solutions are oftendependent on one or two employees.It can be difficult to maintain a custom-built system when theseemployees are reassigned or leave.9 2017 SL Corporation. All Rights Reserved.SECTION 01SECTION 02SECTION 03SECTION 04
3Becoming Proactive withEnd-to-End MonitoringAs middleware layers become more complex, small problems can quickly turn into big ones.It is essential for support teams to be proactive with real-time monitoring and effective alerting to evolve beyond reactive incidentmanagement. One global retail bank we work with cited war room meetings often involving more than 30 attendees and onemeeting in the previous year lasting more than 24 hours! They felt acute pain which they blamed on being stuck in a reactive mode.Application and middleware support teams cannot work effectively without gettingthe right information, at the right time and in the proper format. Also, resources inone technology area need to be associated with the dependent resources in theother technology areas for Impact analysis to take place. General enterprisemonitoring solutions do not meet these requirements and can result in significanttime delays and communication problems.TIBCO middleware andsupport teams canproactively reduce Sev 1 & 2incidents and lower MTTRwith the proper middlewarefocused monitoring toolsProactivity requires centralized monitoring and alerting to minimize the lag timeassociated with navigating through different monitoring applications, alertingsystems, and log files.Business owners often require information about the health and availability of theirapplications and services. Unfortunately, they usually rely on Operations and Supportteams for this when they would prefer self-service access to the information.Business owners are often tasked with contacting several Technology owners andacting as the communications hub when solving Sev 1 and 2 issues and the result isunnecessarily long resolution times and a great deal of frustration and confusion.10 2017 SL Corporation. All Rights Reserved.SECTION 01SECTION 02SECTION 03SECTION 04
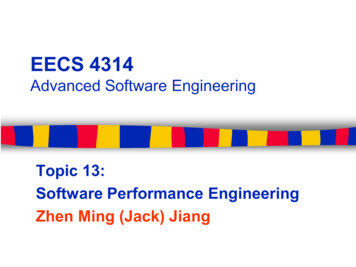
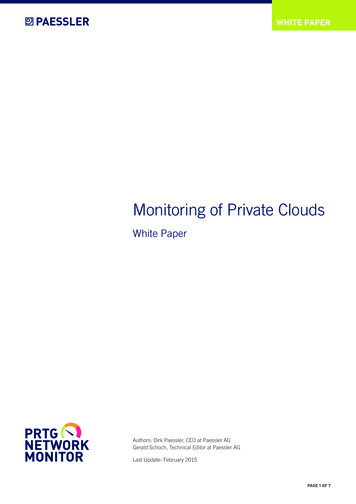
3Benefits from Proactive Monitoringare Well DocumentedReduction in Severity 1 and 2 incidents as reported by a major U.S. bank at the TIBCO NOWconference in 2016.11 2017 SL Corporation. All Rights Reserved.SECTION 01SECTION 02SECTION 03SECTION 04
4RTView Enterprise: End to end Monitoringfor TIBCO-centric ApplicationsRTView Enterprise Edition is used by manycompanies to monitor their custom and complexmiddleware environments more efficiently.It is designed from the ground up to focus on middleware tiers andis often the monitoring application of choice for TIBCO middlewareand support teams.Figure: View the health of the entire TIBCO environment in a single displayRTView Enterprise enables users to not only monitor the healthand performance of a wide range of technologies but also tocorrelate the technologies that support a business service orapplication and quickly identify the actual cause of problems.RTView Enterprise is designed for TIBCO middleware and support teams that require:ConsolidatedMonitoring12More PowerfulDiagnostic ToolsHistoricalPerformanceInformation 2017 SL Corporation. All Rights Reserved.Cross-TechnologyCorrelationsSECTION 01SECTION 02CentralizedAlerting Across theTIBCOEnvironmentSECTION 03SECTION 04
4Solution PackagesRTView Enterprise uses SolutionPackages for gathering metrics anddata from specific technologies.These pre-packaged plug-in solutions include dataadapters, internal memory caches, a rules engine, and adata historian and can access data via real-timeasynchronous or query-based polling. Data is stored locallyin internal memory caches to improve performance andpersisted to a local data historian at configurable intervals.Each Solution Package includes pre-built displays and preconfigured alerts, so no programming is required. Duringthe configuration step, a simple configuration UI is used toconnect each solution package to the each environment.Figure: Solution Package summary views present the most crucial performanceKPIs in addition to an abundant amount of historical performance information.13 2017 SL Corporation. All Rights Reserved.SL extends functionality for TIBCORTView monitors with: Additional non-TIBCO solution packages Business service and dependency views Custom flow diagramsSECTION 01SECTION 02SECTION 03SECTION 04
4Solution PackagesA wide variety of Solution Packages is availablefor TIBCO technologies including:SL supports a number of open source andcommercial software from a number of vendors:Fully-supported GA:Field-supported:Many companies that have licensed TIBCO RTView from TIBCO have also worked directly with SL to provide additional capabilityto extend the breadth of their TIBCO and non-TIBCO middleware monitoring. SL licenses RTView Enterprise Edition direct in thesesituations and also provides display and alert customization capability and supporting services.14 2017 SL Corporation. All Rights Reserved.SECTION 01SECTION 02SECTION 03SECTION 04
4Historical ContextRTView intelligently caches data in-memory for instant access and can be storedpersistently for long-term capacity analysis.Time-series trend charts easily differentiate between transient spikes and slow-growth trends so users canrespond appropriately. Users can even troubleshoot problems after the incident is resolved.Effective troubleshooting requires richhistorical information to identify transientissues and understand if a high metric valueis a trend or a spike.15 2017 SL Corporation. All Rights Reserved.SECTION 01SECTION 02SECTION 03SECTION 04
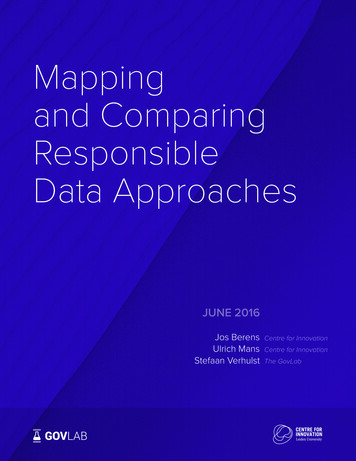
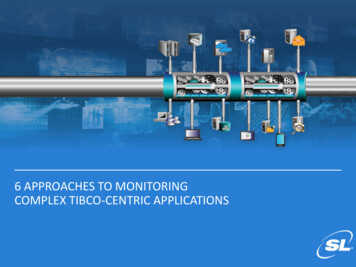
4Understanding Large, Complex Systemsby Creating Logical GroupingsGroupings may be configured around businessunits, data centers, geography or any otherlogical entity.When support teams have this knowledge, they are able toprioritize incident response more effectively.Figure: This heatmap provides a real-time health view of asystem consisting of thousands of middleware components inlogical business-oriented groupings16Using the service model, uses are ableto better understand large, complexsystems by creating logical business oroperational groupings of middlewareand the infrastructure. 2017 SL Corporation. All Rights Reserved.SECTION 01SECTION 02SECTION 03SECTION 04
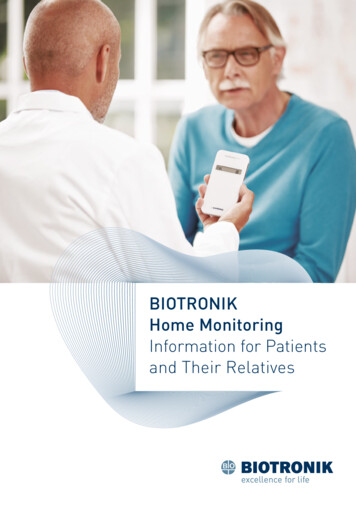
4Understanding How ComponentsCan Impact a Business ServiceRTView Enterprise uses the service model tocorrelate the different components that makeup a business service or application.Figure: This history heatmap shows the health of the components making up abusiness service over a two day period. It shows a correlation between a problemBW Engine and high CPU usage for a VMware host.Using history heatmap views, users cancorrelate the key performance metrics of differentcomponents across an entire service to understandthe root of a problem.For example, a business service may be impacted by a slow performingcomponent that is caused by an adjacent component in the service.History Heatmaps also show the stress levels, over time, for each of theresources required to support an application. This allows administratorsto intelligently allocate resources (such as memory or CPU) to thosedevices that are under stress.17 2017 SL Corporation. All Rights Reserved.How can a user effectivelytroubleshoot a BusinessWorks issuewithout understanding the health ofits upstream service dependencies?SECTION 01SECTION 02SECTION 03SECTION 04
4Support across Multiple Environmentsincluding the CloudJust as TIBCO can be deployed on-premise, in public and private clouds and containers, so canRTView Enterprise. RTView supports on-premise, hybrid, and cloud-only deployments.RTView uses a distributed architecture where the data server layer is architectedto collect and locally process monitoring data from any number of middleware andinfrastructure sources. Source data is accessed agentlessly via API, stored in cachesfor fast access, aggregated, normalized and then made available to the metadatalayer. Subsequently, relevant information is passed up to the RTView server layerwhere service-model integration and display logic is applied so that data can beviewed in a number of advanced visualizations, tailored by role or domain.Figure: Distributed architecture. RTView data serverscollect and process monitoring data locally and passrelevant information to the central RTView server layeronly when needed.RTView’s distributed data caches can be accessed from RTView Enterprise forconsolidated visibility while customer data remains securely behind their firewallsproviding an extra level of data security.RTView Enterprise can enable organizations to monitor heterogeneous cloudplatforms in addition to their on-premise environments. In this way, RTView canreduce the business risk of lifting and shifting workloads to the cloud.18 2017 SL Corporation. All Rights Reserved.SECTION 01SECTION 02SECTION 03SECTION 04
4Centralized Real-TimeAlerting and NotificationsWith RTView Enterprise EditionUsers can centralize and aggregate monitoring information gatheredfrom TIBCO EMS, BusinessWorks, and BusinessEvents SolutionPackages and other technologies or tools such as TIBCO Hawk in asingle alert view.Centralized alert management can provide tangible benefits to thebusiness because it allows users to detect patterns in anomalies andto correlate issues across the environment.Support Teams and individual userscan filter and view only the alertsthey care about to minimizeinformation overload.Filters can isolate all alerts of a certaincondition (for example pendingmessages or for a particular resource,BE server and for a specific Businessservice or application.Centralized alert managementcan provide tangible benefits tothe business because it allowsusers to detect patterns inanomalies and to correlateissues across the environment.No TIBCO support team wants to receive alerts from multiple tools and platforms— in different formats, with varied content — atonce. Centralized alerting will often provide an improved MTTR for issue resolution because there are fewer redundant alerts.19 2017 SL Corporation. All Rights Reserved.SECTION 01SECTION 02SECTION 03SECTION 04
4Custom Displays and Flow DiagramsRTView supports the automated and manual creation of custom diagrams and displays.These are frequently used to make complex concepts and processes easier to understand. Visual diagrams can enable lower levelsupport teams to be more efficient and less reliant on the level 3 experts.Custom Flow Diagrams enable users to visualize end to end business processes withvery granular performance and health data for all touch points and end points inthat flow. This makes it easier to understand the flow of a business service and allthe components supporting that service. Errors are highlighted enabling the user totake corrective actions before the incident become more severe.Figure: TIBCO Transaction Flow Diagrams provide a visualize TIBCO transaction message flows anddrill down to more detailed information.TIBCO Transaction Message Flow Diagrams allowusers to visually highlight metrics including:Message Throughput per minutewith high and low alerting20Highlight failed transactionswith appropriate drill downsto responsible component 2017 SL Corporation. All Rights Reserved.Transaction message flow diagramsalso embed links to tabular chartsthat provide an understanding oftransaction behavior.SECTION 01SECTION 02SECTION 03SECTION 04
4Integration with OtherMonitors and SystemsOrganizations often standardizeon different monitoring andincident managementplatforms.RTView plays well with these systems andcan import data, such as host informationto provide a better end-to-endunderstanding of the larger environment.Figure: TIBCO BW performance data can be exported fromRTView to other monitoring tools such as Splunk.21Users can also export RTView metrics andalerts to other third-party monitoring systemssuch as HP OpenView, IBM Tivoli, Nagios andSplunk via a REST interface or SNMP trap. 2017 SL Corporation. All Rights Reserved.SECTION 01SECTION 02SECTION 03SECTION 04
4About SLSL is a San Francisco Area-based softwarecompany that develops real-time monitoring,visualization and diagnostic software forGlobal 1,000 and mid-market companieswhose businesses depend on complex,high-performance applications.The company has deep expertise in monitoring andmanagement of custom, distributed applications running inheterogenous middleware environments on-premise, inhybrid, or cloud environments.The team at SL has a reputationfor being one of the mostresponsive and knowledgeablecompanies in the industry.Our customers and partners regularlycomment on our great communications, thequick response of our technical team andthe commitment of the executives and alllead technologists to ensure the success ofall SL projects.SL’s customer support engineers have an average tenure of more than 15 years at the company.They combine deep technical experience with a keen understanding of their customer’s requirements to ensure avery high level of customer satisfaction.22 2017 SL Corporation. All Rights Reserved.SECTION 01SECTION 02SECTION 03SECTION 04
Ask an ExpertTake a Test uation-request/Watch a Video23 2017 SL Corporation. All Rights Reserved.
TIBCO Hawk is TIBCO's legacy monitoring solution and is broadly used within TIBCO's core integration customer base. It has been TIBCO's primary monitoring solution for monitoring on-premise, distributed applications, and systems for years. It has proven to be very reliable and highly scalable with some