Transcription
16 FEDERAL PROBATIONVolume 74 Number 1The Creation and Validation ofthe Ohio Risk Assessment System(ORAS)*Edward J. iMtessa, University of CincinnatiRichard Lemke, University of West GeorgiaMatthew Makarios, University of Wisconsin-ParksidePaula Smith, University of CincinnatiChristopher T. Lowenkamp, Administrative Office of the U.S. CourtsTHE O H I O RISK ASSESSMENT SYSTEM(ORAS) was developed as a statewide systemto assess the risk and needs of Ohio offendersin order to improve consistency and facilitatecommunication across criminal justice agencies. The goal was to develop assessmenttooLs that were predictive of recidivism atmultiple points in the criminal jusfice system.Specifically, assessment instruments were tobe developed at the following stages: 1 ) pretrial,' 2) community supervision, 4) institutional intake, and 4) community reentry.A major goal of the ORAS was to conform to the principles of effective classification. In doing so, the Ohio Department of Rehabilitation and Correction (ODRC) hoped toefficiently allocate supervision resources andstructure decision-making in a manner thatreduces the likelihood of recidivism. As a result, ORAS was developed to classify the risklevel of offenders in the system while alsoidentifying both criminogenic needs and barriers to programming.' For more details on the Pretrial instrument see:Lowenkamp, CT. Lemke. R. and Latessa E. (2008).Federal Probation 72(3)2-9.The Principles of EffectiveClassificationThe principles of effective classificafion havebeen developed to guide criminal justice agencies in the use of risk assessment systems. Inshort, the principles of effective classificationsuggest that agencies should use actuarial assessment tools to identify dynamic risk factors, especially in high risk offenders, whilealso identifying potential barriers to treatment. The risk principle suggests that correctional interventions and programs are mosteffective when their intensity is matched tothe risk level of the clientele (Andrews, Bonta, & Hoge, 1990; Van Voorhis. 2007; Lowenkamp, Latessa, & Holsinger 2006). That is,the most intensive programming should beallocated to moderate- and high-risk cases,while low-risk cases should be allocated littleif any programming.Another consistent finding in correctionalprogramming is that the most effective programs target dynamic risk factors (Andrewset al., 1990; Lowenkamp, Latessa, & Smith,2005; Lowenkamp & Latessa, 2004). Dynamic risk factors (also called criminogenicneeds) are factors that, when changed, havebeen shown to result in a reduction in recidivism. The needs principle suggests thateffective classification systems should identify dynamic risk factors directly related torecidivism so that they can be used to targetprogrammatic needs.The responsivity principle- focuses onidentifying barriers to treatment (Van Voorhis,2007). Although dynamic risk factors are directly related to recidivism, there are other issues that are likely to keep individuals fromengaging in treatment, such as intelligence,reading ability, and language barriers. If leftunaddressed, it is likely that these influencescan interfere with the completion of treatmentand, as a result, indirectly prevent a reductionin recidivism.Finally, the principle of professional discretion recognizes that case managers andcounselors are responsible for processing therisk, need, and responsivity infortnation andmaking decisions based on the informationprovided (Andrews, Bonta, & Hoge, 1990).Further, actuarial tools are designed to treatoffenders in the aggregate and cannot bestructured to anticipate every possible case orscenario. As a result, it is important to allow' The responsivity principle touches on two relatedaspects of responsivity-specific and general. This article, and assessment in general, usually fcKuses onassessing specific responsivity.*This research wa.s made pos.úhle with a grant from the Ohio Department of Rehabilitation and Correction (grant numbers 2005-JG-EOR-6269 and 2005-JG-COIT8S07). Views expressed are those of the authors and do not necessarily reflect the views ofORDC.
June 2010criminal justice personnel the ability to override the assessment instruments in specificcircumstances.The Advantages of Constructing a Statewide RiskAssessment SystemAlthough many criminal justice agencies havebeen implementing standardized risk classification instruments to efficiently manage theirtarget populations, they often use empiricallyderived tools developed on samples from adifferent population (Jones, 1996).This is because resource constraints often limit the developtnent of risk assessment instruments forspecific jurisdictions and populations (Jones,1996). Although using preexisting risk assessments is less costly, it assumes that the instrument is a valid predictor of recidivism foreach agency's specific population (Wright,Clear. & Dickerson, 1984; Jones. 1996; Gotttredson & Moriarty, 2(X)6). Since it is unlikely for a single instrument to have universalapplicability across various offending populations, validating risk assessment instrumentson specific target populations is important(Wright, Clear, & Dickerson, 1984). Further,different populations of offenders are likelywithin jurisdictions. For example, the population of defendants on pretrial supervisionis likely different from the population of individuals who are relea.sed from prison. As aresult the Ohio Risk Assessment System wasdesigned to predict recidivism at differentpoints in the Ohio criminal justice system.The use of a .standardized as.sessment toolin Ohio allows consistency in the assessmentof risk across jurisdictions. Prior to the creation of the ORAS. counties in Ohio u.sed different methods of assessment, creating a greatdeal of variation in the practices for assessingthe risk and needs of offenders. Therefore,one of the purposes of ORAS was to promoteconsistent and objective assessment of therisk of recidivism for offenders in Ohio.Another advantage of using a risk assessment system that follows offenders throughthe criminal justice system is that it improvescommunication and avoids duplication of information. In fact, many of the items in theindividual as.sesstnents carry over into assessments at later dates. The total number of riskitems collected from all assessment instruments is 63. Of these, 24 items are used on atCREATION A N D VALIDATION OF ORASleast two if not more assessment instruments.Further, since ORAS will be automated, itemsthat are assessed at earlier stages have the potential to auto-populate into assessments atfuture dates.Table 1.1- i 'Number of Cases in Each SampleSampleNPretrial452The Current StudyCommunity Supervision678The current study outlines the constructionand validation of four assessment tools'; thePretrial Assessment Tool (PAT), the Community Supervision Tool (CST)**, the Pri.sonIntake Tool (PIT), and the Reentry Tool (RT).A prospective design was utilized in the creation and validation of ORAS. To accomplishthis, offenders across the Ohio criminal justice system were extensively interviewed forpotential risk factors and were subsequentlyfollowed for one year to gather official measures of recidivism. Data collection instruments gathered information using a self-reportquestionnaire and .semi-structured interviewsthat together provided over 200 potentialrisk factors that were used to construct eachinstrument.' The structured interview andself-report process took approximately 45-90minutes to complete per offender. Four independent samples of offenders were gatheredat different stages in the criminal justice system; at pretrial, on community supervision,at prison intake, and just prior to communityreentry. Table 1 presents the number of casesin each sample. There were a total of 1,839cases in all four samples; 452 in the pretrialsample, 681 in the community supervisionsample, 427 in the prison intake sample, and279 in the community reentry sample.Prison Intake423Community Reentry277The pilot sites for the project were selectedwith the considerations of geographic representation across the state, recommendations fromDRC staff, and whether the site was available' Space constraints limit a full presentation of themethodology involved in the validation and construction of ORAS; for a full review see Lates.sa etal.(20()9). * Due to the high volume of offenders on communitysupervision, an abbreviated version of the CST wa.sdeveloped as a screening tool to identify moderate andhigh risk cases for the full assessment. Lates.sa et al.(2(X)9) provides a detailed description of the Community Supervision Screening Tool.' Due to differences in access, interview availability,due process issues, and ethical considerations, pretrialdefendants were assessed during different interviewprotocols and data collection tools. See Latessa et al.2009 for a further explanation of the differences indata collection between the pretrial instrument andother assessment instruments.17Toldl1,830and willing to participate during the data collection process. Potential sites were asked toboth facilitate access to the cases and providea physical location to conduct the interviews.Although some logistical and scheduling issues arose at .several sites, no site declined toparticipate in the project. Seven Ohio countiesprovided data for the PAT. fourteen countiesparticipated in data collection for the CST, andeight correctional facilities participated in dat collection for the PIT and the RT.ParticipantsIn order to be included in the pretrial sample,each individual had to be an adult chargedwith a criminal offense and referred to pretrial services during the period of data collection. To be included in the communitysupervision sample, each individual had tobe an adult charged with a criminal offensethat was recently referred to probation services during the period of data collection. Individuals were selected for the prison intakesample if they; a) were admitted to an intakecorrectional facility within the last six monthsand b)were within six months of release. Thelimited sentence length was necessary in order to provide an adequate follow-up time forrecidivism in the community. The communityreentry sample consisted of individuals who;a) were within six months of their release/discharge date and b) had not been admitted tc)prison within the past six months.RecidivismCollection of the follow-up data for all samples was completed approximately otie yearfollowing the conclusion ot the structured interviews. The primary measure of recidivismfor this study was arrest for a new crime.Although data were gathered on a variety ofother potential outcome measures (e.g. conviction, probation violation, institutional ruleinfraction), arrest was used for two major rea-
Volume 74 Number 118 FEDERAL PROBATIONsons. First, measures that gather informationlater in the criminal jusfice process, such asconvictions, require a longer follow-up period than the 12 months used in this study.Second, using arrests in the community asan outcome allows the assessment tools toidentify criminogenic needs that are likely toresult in danger to the community. Althoughfactors that are predictive of rule violations(e.g., probation violations or institutional violations) are of concern to criminal justice personnel, of most concern are factors that arerelated to criminal behavior.'Data on recidivism came from a varietyof sources. For the pretrial sample, information was gathered by the counties from publicrecords searches and searches of the casesfile. For the community supervision sample,county agencies gathered the arrest data on offenders under their supervision through publicrecords searches and file reviews. This information was verified through the Ohio LawEnforcement Gateway (OHLEG). OHLEG isespecially useful because the information itprovides is not specific to the county of supervision. Because not all inmates who were released from correctional facilities were placedon community supervision, OHLEG was theonly source of information for regarding newarrests for these samples.Assessment ConstructionFor each assessment, items gathered from thestructured interviews and self-report surveysthat were associated with recidivism wereused to create each tool. Cases were excludedif they had missing information on four ormore items.' After the items associated withrecidivism were identified, these items werescored to create scales that indicated increasesin the likelihood of recidivism. A modifiedBurgess method was used to assign point values to each item. The Burgess method assigns' Unlike the other assessment tools, the outcome usedin the construction of the Pretrial Assessment Toolwas either a new arrest or failure to appear. Failureto-appear was inckided as an outcome because one ofthe major goals of the pretrial tool was to assist courtactors in the decision to release or hold the defendantprior to trial. A major concern of court actors in making this decision involves both the potential for newcriminal activity and the likelihood that the defendantwill appear at court date.' The number of cases excluded for each tcxil becausethey have more than four items missing were: pretrialsample 0. community supervision sample 3. prison intake sample 10, reentry sample 2.a point (a score of 1 ) to the presence of the riskfactor, and assigns a score of zero when it isfalse or not present. Some items have multipleincreasing risk scores, and as a result werescored with increasing values (i.e., 0, 1, 2).The items were then combined to create riskscales for each assessment tool. Once the riskscales were calculated, cutoffs were created todivide cases into different risk categories.Priorities in Case ManagementAnother goal in developing ORAS was to assist Ohio criminal justice agencies with casemanagement by providing the agencies withtools to identify and prioritize specific treatment domains. Each assessment instrumentis broken down by domain (e.g., criminal associates, criminal attitudes, substance abuse,etc.) and specific categories divide offendersinto groups based on their likelihood to reoffend. Stated differently, the assessment process not only provides an overall risk level,but also provides risk levels by case management domains. Presenting risk levels by domain gives practitioners specific informationregarding the likelihood of recidivism basedon individual criminogenic domains in orderto encourage a more efficient allocation oftreatment resources.*Responsivity AssessmentsIn keeping with principles of effective classification, a goal in developing the ORAS wasto gather information about potential barriers to treatment. As a result, additional caseplanning items are incorporated into the finalassessment. Table 2 provides a list of areasthat are gathered for responsivity. As indicated in the table, responsivity items rangefrom factors such as intelligence and literacyto child care and transportation. These itemsare not directly related to recidivism, but instead have the potential to restrict the efficacyof treatment. Responsivity items are not usedin the final calculation of risk, but instead areused as case planning factors that should beaddressed to improve likelihood that programming will reduce recidivism.* Latessa et al. (2009) provides a thorough descriptionof the priorities in cases management, included analyses for each instrument that provide the likelihood ofrecidivism for each domain.Table 2.Areas Assessed for ResponsivityTreatment BarriersTreatment BarriersLow intelligencePhysical handicapReading andwriting limitationsMental health issuesHistory of d careLanguageEthnicity and culturalbarriersThe Pretrial Assessment Tool(PAT) Validation ResultsThe original pretrial data collection instruments provided over 100 potential predictorsof recidivism. Of these, seven items from fourdomains were found to be related to recidivism: three items measuring criminal history,one item measuring employment, one itemmeasuring residential stability, and two itemsmeasuring substance abuse.'' Overall, the PATscores ranged from 0 to 9 and had a correlation of .23 (p .00) with recidivism.Table 3.Descriptive Statistics for the PretrialAssessment Sample (n 452)VariableNPercentMale34579Female10723Low (0-2)20746Moderate (3-5)22550204Yes37984No7316SexRisk LevelHigh (6 )Arrest or FTATable 3 presents descriptive statistics foroffenders in the pretrial sample. Eighty percent of the sample is male. 46 percent is African American, and 16 percent were eitherarrested or committed a new offense. Table 3also presents the distribution of cases by riskscore. Scores of zero to two were categorizedas low risk, three to five moderate risk, andsix to nine as high risk. Of the total sample,'' Latessa et al. (2(X)9) provides the scoring sheets thatlist all items for each assessment instrument.
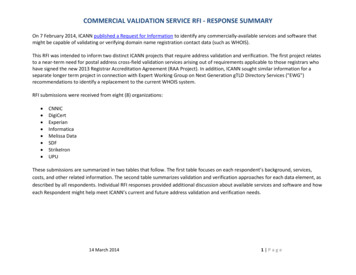
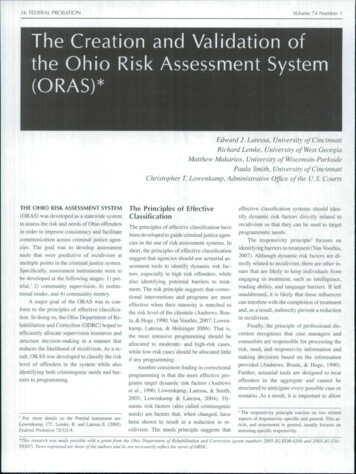
lune 2010CREATION AND VALIDATION OF ORAS 1929 percent of cases were categorized as lowrisk, 54 were categorized as moderate risk,and 17 percent as high risk.Figure I presents information regardingthe predictive validity of the PAT. The chartillustrates that each risk level is associatedwith progressively higher rates of recidivism.Specifically, *. percent of low risk cases werearrested, 18 percent of moderate risk caseswere arrested, and 30 percent of high risk cases were arrested. The r value of .22 providesfurther indication that the assigtied levels ofrisk can significantly distinguish betweengroups that have progressively higher rates ofrecidivism.'"Figure 1.Predictive Validity of the PretrialAssessment Tool (n 452)*29.5.oJitf4I'5.4 r .22; p .OnL Low Kisk Mixlcrate Risk Hi;;h RiskThe Community SupervisionTool (CST) Validation Resultsinitial data for the community supervisionsample was gathered through site visits tolocal county probation offices and community-based corrections facilities and providedinformation from 678 individuals. The selfreport survey and structured interview guideof recidivism. In all, the CST consisted of atotal of 35 items within 7 dotnains: criminalhi.story; education, employment, and finances; family and social support, neighborhoodproblems, substance abuse, antisocial associates; and antisocial attitudes and behavioralproblems. Risk scores on the CST rangedfrom 0 to 43 and had a correlation of .37(p .00) with recidivism.Table 4.Table 4 presents descriptive statisticsfor the community supervision sample. Ofparticular interest are the final risk levels,cutoffs, and number of cases falling at eachlevel. To provide optitrtal risk levels and cutoff scores, preliminary analyses revealed thatmales and females should be given differentcutoff scores to categorize risk groups. Thisis primarily because females tended to havelower scores on the assessment in.strutnents.For males, cutoffs for risk levels are as follows: low risk zero - 14; moderate risk, 15- 23; high risk 24 - 33; and very high risk :34 and higher. For females the cutoffs are asfollows: low risk zero - 14; moderate risk 1 5 - 2 1 ; high risk 22 - 28; and very high risk 29 and higher.Any New ArrestFigure 2 presents the failure rates foreach risk level of the CST for male and fetnale offenders in the community supervisionsatnple. The table cleariy illustrates incretrtental increases in the rates of recidivism foreach group. For males, failure rates are ninepercent for low risk, 34 percent for moderaterisk, 59 percent for high risk, and 70 percentFigure 962Low (0-14)7715Moderate (15-23)20740High (24-33)19037Very High (34-49)398SexMalesFemaiesLow (0-14)4325Moderate (15-21)6540High (22-28)4729Very High (29-49)106for very high risk offenders. The r value of.37 reveals that the relationship between risklevel and recidivism is moderate and performsslightly higher than r-values generated in other research on dynatnic risk assessment instruments (Gendreau, et al., 1996). Sitnilarly, Figure 2 indicates that for females, risk levels are9 percent for low risk, 22 percent for moderaterisk, 40 percent for high risk, and 50 percentfor very high risk. The r value of .30 reveals amoderate relationship with recidivism.,Predictive Validity of the Community Supervision Tool80(9 2 7060provided a total of 200 potential predictors'" r values are reported to indicate the predictive validity of each assessment instrument because they arewidely understood and easy to interpret. ReceiverOperating Characteristics (ROC) analyse.s were alsopertbrmed to gauge the predictive validity. The AreaUnder the Curve (AUC) values that resulted fromthese analysis are as follows:Pretrial Assessment Tool AÜC .65, p .00; Community Supervision Tool male AUC .71. p .00; Community Supervision Tool female AUC .69. p .00;Prison Intake Tool male AtJC .67. p .(X): Prison Intake Tool female AUC .69, p .00; Reentry Tool maleAUC .6.S. p .(X). Reentry T(K)1 female AUC .77.p .00.Descriptive Statistics for theCommunity Supervision Sample1tSO20109.1ii IHI 1Males: r .37; p .00Low Risk 11 Moderate Risk 04 HHÜB:9.3Females: r .3O: [X.OOHigh Risk Very High Risk
20 EEDERAL PROBATIONVolume 74 Number 1The Prison Intake Tool (PIT)Validation ResultsThe PIT is designed to provide case managers with an assessment instrument that canbe used to prioritize prison treatment basedon the likelihood of recidivism. A total of30 items from 5 domains were found to besignificantly related to new arrests followingtheir release from prison. The five domainsof the PIT are: criminal history, educationemployment and finances, family and socialsupport, substance abuse, and criminal lifestyle. Scores on the PIT range from 0 to 40and have an r value of .36 when predictingnew arrests after release.Table 5 presents descriptive statisticsfor the prison intake sample. Preliminaryanalyses indicated that the PIT produced fourdistinct risk levels for male offenders whileonly three risk levels were appropriate for females. For males, nine percent of the casesare low risk, 41 percent are moderate risk, 43percent are high risk, and 6 percent are veryhigh risk. For females, low risk cases accountfor 42 percent of the sample, moderate riskcases account for 39 percent of the sample,and high risk cases account for 19 percent ofthe sample.Figure 3 presents the percentage of casesthat were arrested for each risk level on thePIT by gender. The chart illustrates that forboth males and females, increases in recidivism are associated with increases in risklevel. Further, there are acceptable r val-The Reentry Tool (RT)Validation ResultsTable 5.Descriptive Statistics for thePrison Intake Sample (n w (0-8)249Moderate (9-16)11141High (17-24)11543Very High (25 )176FemalesLow (0-12)6542Moderate (13-18)6139High (19 )3019Yes16940No25460Any New Arrestues for both genders (r .32 for males andr .35 for females). For males, 17 percentof low-risk cases recidivated, 32 percent ofmoderate-risk cases recidivated, 58 percentof high-risk cases recidivated, and 71 percentof very high-risk cases recidivated. Althoughonly having three risk levels, risk levels forfemales were also associated with increasesin recidivism: low-risk cases had a recidivismrate of 17 percent, 33 percent of moderaterisk cases recidivated, and 63 percent of highrisk cases recidivated.Figure 3.Predictive Validity of the Prison Intake Tool (n 423),\Uiks. r .32; p .00Ü Low Risk Moderate Risk Females: r .35; p .00High Risk Very High RiskThe RT was designed to be administeredwithin 6 months of release from prison. Theaverage length of incarceration for the prisonrelease sample ranged from 2 to 452 months,with an average of 35 months. In all, the RTconsisted of a total of 20 items from 4 domains and had potential scores that rangedfrom 0 to 28. Domains for the RT are: age,criminal history, social bonds, and criminalattitudes. The correlation between risk scoreand recidivism is .36. Table 6 pre.sents descriptive statistics for the reentry sample.Preliminary analy.ses revealed that separatecut-off scores should be made for males andfemales. For males, the majority of cases aremoderate risk, with similar percentages ofcases falling at low- and high-risk levels. Onthe other hand, low risk is the modal valuefor females. These findings are similar tothe PIT and indicate that females tend toscore at lower risk levels than males on theassessment instruments.Figure 4 presents the percentages of offenders that recidivated for each risk level ofthe RT by gender. The results indicate thatboth male and female groups experiencedincreasing rates of recidivism for each risklevel. For males, 21 percent of low-risk caseswere rearrested, 50 percent of moderate-riskcases were rearrested, and 64 percent of highrisk cases were rearrested. The r value of.29 indicates that the RT does a good job ofdistinguishing between low-, moderate-, andhigh-risk cases. For females, only six percentof low-risk females were arrested, while 44percent of moderate-risk cases were arrested,and 56 percent of high-risk cases were arrested. The large r value for females (r .44)is likely a result of the substantial differencebetween low- and moderate-risk females.Still, the findings for females should be takenwith caution because of the small number offemale offenders in the reentry sample (n 65).
CREATION AND VALIDATION OF ORAS 21June 2010Table 6.Reentry Sample (n sLow (0-9)4722.2Moderate (10-15)10951.4High (16 )5626.4Low (0-10)3147.7Moderate (11-14)2538.5913.8Yes11842.6No15957.4FemalesHigh (15 )Any New ArrestiStudy should be taken into account. The firstlimitation revolves around the generalizability of the sample to all offenders in theOhio criminal justice system. Although thedata collection period gathered infortnationon over 1,800 offenders in Ohio, it wouldbe imprudent to assume that the findings arerepresentative of all offenders in Ohio. First,resource constraints limited the inclusion ofcases from all counties and correctional institutions. Second, although the samples weregathered from specific populations, certaintypes of cases may be underrepresented inthe population (e.g., sex offenders, Hispanicoffenders, female offenders). The underrepresentation in the population leads to smallnumbers of these types of offenders in thesample. For example, the findings from theRT were based on a sample size of 65 females. Although the results provide evidencethat females have a distribution on the riskFigure 4.Predictive Validity of the Reentry Tool8070h4. ihO?5049.5 H HIHIÍ2010Females: r .44; p .00Males: r .3O; p .05Low Risk Moderate Risk ConclusionHigh Risk¡The ORAS consists of a series of assessmenttools that measure the likelihood of recidivism at different points in the criminal justicesystem. The validation results are promisingand reveal that all assessment instruments areable to significantly distinguish between risklevels. Further, r values are relatively large,and depending upon the assessment instrument, range from .22 to .44.Although the findings presented here areencouraging, two major limitations of thislevels that is different from men, the findingsshould be considered preliminary until datacan be collected on a larger sample of wotrtenwho are released from prison.Measurement error creates a second limitation for this study. The major source of datacollection for this study was the structuredinterview, which was undertaken by trainedresearch staff, not criminal justice personnelthat will administer the assessment once it isimplemented. Further, the informed consentprocess identified a sample of offenders whoagreed to participate in the interview process.In short, the structured interview process usedto gather the data will likely be somewhatdifferent from the process u.sed by criminaljustice officials to interview cases and assignrisk once the ORAS is implemented.The limitations of this study suggest thatODRC follow several important recomtnendations. The first major recommendation isthat ODRC conduct revalidation studies ofORAS. Revalidation studies will provide further evidence that the instruments in ORAScan predict recidivism across multiple samples from the same population. Further, theautomation and storage of ORAS data will allow researchers to gather stratified probabilitysamples in order to 1 ) provide a sample that isrepresentative of all counties in Ohio and 2)oversample underrepre.sented groups (such aswomen and sex offenders). Also, revalidationstudies should seek to extend the follow-uptime. Although an average follow-up of 12months is adequate, research suggests that18 to 24 month follow-up times are optimal(Joties. 1996).Revalidation studies can also address thethreat that measurement error poses to thisstudy. That is, revalidations studies will involve gathering data from assessments thatare given by personnel within the criminal justice system, examining the predictive validityof ORAS in a "real world" setting. Anotherimportant step to help ensure the validity ofORAS is proper training. To ensure this, aspecific training protocol has been developedfor training persontiel on the assessment instruments. Proper training cannot be stressedenough, because the efficacy of every assessment is heavily dependent upon the personwho conducts the interview and scores therisk instrument. This is especially importantbecause, although the interview questions arestructured to maximize reliability, scoring forsome of the itetns relies upon the professionaljudgment of the interviewer. Training willalso help to minimize the potential measurement error from differences between havingcriminal justice personnel conducting the interviews instead of university research staff.Not only is initial training important, but itis recommended that a system be developedthat specifies the training process, providesreliability
result the Ohio Risk Assessment System was designed to predict recidivism at different points in the Ohio criminal justice system. The use of a .standardized as.sessment tool in Ohio allows consistency in the assessment of risk across jurisdictions. Prior to the cre-ation of the ORAS. counties in Ohio u.sed dif-