Transcription
AIAA Guidance, Navigation, and Control (GNC) ConferenceAugust 19-22, 2013, Boston, MAAIAA 2013-5130Automating Trajectory Prediction Performance Analysesfor the FAA Traffic Management AdvisorGabriele Enea,1 Robert A. Vivona,2 and Vincent Kuo3Engility Corporation, Billerica, MA, 01821Downloaded by NASA AMES RESEARCH CENTER on August 23, 2013 http://arc.aiaa.org DOI: 10.2514/6.2013-5130Karen T. Cate4 and Michelle M. Eshow5NASA Ames Research Center, Moffett Field, CA, 94035This paper presents a new approach for analyzing the trajectory prediction performanceof the FAA’s Traffic Management Advisor (TMA). TMA is a deployed system that generatesscheduled time-of-arrival constraints for en-route air traffic controllers in the US. The newautomated analysis provides a repeatable evaluation of the current trajectory performancemetrics, for new releases of TMA, in different traffic and airspace environments, and forcurrent traffic situations. Using a wider set of data, it provides also a higher level ofunderstanding on the causes of possible degradation of the trajectory predictionperformance of TMA. The bulk of the work consisted of the development of the ability tofilter flights not impacted by controller intervention. Identifying interrupted flights fromrecorded data is challenging but necessary for a fair and accurate performance test.Currently, no method for identification of flights exists other than a manual review of voicecommunications. The automated approach was tested with two data sets, from 2006 and2013. The 2013 data consisted of 24 hours of traffic arriving into Dallas Forth WorthAirport. The results of the testing on this data set showed that the approach selected astatistically significant number of flights to validate the TMA trajectory predictor’sperformance against the system requirements. New metrics for the evaluation of the TMAtrajectory predictor’s performance are introduced and compared with the current set ofmetrics used by the FAA.TI. IntroductionRAJECTORY-BASED Operations (TBO) is a cornerstone concept of modernization efforts for airtransportation systems worldwide.1,2, 3 To implement TBO in the short term,4,5 accurate estimates of times atthe meter fix are necessary.6,7 This function in the US National Airspace System (NAS) is provided by the TrafficManagement Advisor (TMA). TMA is now deployed in all 20 en-route Air Route Traffic Control Centers(ARTCCs) and many major Terminal Radar Approach Control (TRACON) facilities in the US. It providescontrollers with the time-based metering function and arrival flow visualization.TMA relies on an internal trajectory predictor, the Trajectory Synthesizer (TS),8,9,10 to predict the futuretrajectory of flights. The accuracy of TMA trajectory predictions governs the efficacy of time-based meteringoperations. Existing procedures to verify and validate TMA trajectory predictions are not applicable to currenttraffic data and not easily repeatable. This paper describes a new method used to automate the testing techniques inorder to improve the testing of new versions of the software and to create a repeatable test that can be performed in alab environment before any new releases get deployed in the field. The new test is quicker, more flexible, applicableto current traffic data, and gives a higher level of insight into the possible causes of degradation of the trajectoryprediction performance of TMA. The most challenging part of this research work was the automation of a filteringalgorithm to select the flight set to test the trajectory prediction performance requirement of TMA.1Principal Research Engineer, 300 Concord Road, Suite 400, AIAA Senior Member.Chief Research Engineer, 300 Concord Road, Suite 400, AIAA Associate Fellow.3Senior Research Engineer, 300 Concord Road, Suite 400, AIAA Senior Member.4Computer Engineer, Mail Stop 210-8, AIAA Senior Member.5Computer Engineer, Mail Stop 210-8.1American Institute of Aeronautics and Astronautics2Copyright 2013 by the American Institute of Aeronautics and Astronautics, Inc. The U.S. Government has a royalty-free license to exercise all rights under the copyright claimed herein for Governmental purposes.
This paper describes first the problem that the FAA and NASA are facing with the trajectory predictionperformance requirements of TMA. The two current approaches to test these requirements are presented next with adiscussion of the limitations of the approaches. The central part of the paper is dedicated to the description of thetechniques and algorithms used to automate the current test approaches. Proposed additional metrics for theevaluation of the performance of TMA are briefly introduced as possible future work. The paper concludes withdiscussions of lessons learned from the current work.Downloaded by NASA AMES RESEARCH CENTER on August 23, 2013 http://arc.aiaa.org DOI: 10.2514/6.2013-5130II. BackgroundIn the continuing effort to improve TMA’s performance, the FAA, working with NASA, has implemented aperformance test that analyzes the evolution of the accuracy of the ETAs calculated by TMA. Since the accuracy ofTMA’s schedule is tightly related to the performance of its Trajectory Predictor (TP), a meaningful analysis of theTMA system as a whole has to look at both aspects. The objective of the work described in this paper is to userecorded data to identify problems with the TP performance of TMA.The FAA uses two approaches to test a new release of the TMA system, one in a laboratory environment beforethe deployment, and one in the field, after a new release of TMA has been deployed. Both approaches havelimitations, mainly in time-efficiency.One of the basic capabilities of TMA is the computation of the un-delayed ETA to the meter fix and runway foreach arrival aircraft in the airspace analyzed. Based on these ETAs, TMA computes the sequences and scheduledtimes of arrival (STAs) to the meter fix and runway for each aircraft to meet the sequencing and schedulingconstraints entered by the user.11,12 The ETAs are calculated based on the four-dimensional (4D) trajectoriespredicted for each aircraft. The 4D trajectories consist of three spatial dimensions plus time. The accuracy of thepredicted 4D trajectories directly impacts the accuracy of the ETAs. Therefore a thorough analysis of the causes ofETA inaccuracies has to look also at the performance of TMA’s TP.To calculate the future trajectory of an aircraft, the TP needs to know the current position, the wind field and theintent of an aircraft. Upon each RADAR sweep, TMA predicts a new trajectory and a new ETA. Similarly, upon anychange in the aircraft intent, e.g. if ATC issues an advisory or the pilot applies some control to maneuver or changethe speed of the aircraft, TMA predicts a new trajectory with a new ETA.The current TMA performance requirement evaluated by the FAA focuses on the accuracy of the predictedETAs for a sample of flights not impacted (interrupted) by any ATC intervention. Any ATC intervention that is notincluded in a flight plan amendment or that is exchanged via voice communications between ATC and cockpit, isnot known by the automation system. Leaving the flights with these unknown interventions in the test sample wouldnot be appropriate to assess the performance of TMA. For this reason these flights have to be identified andremoved. Identifying interrupted flights from recorded data is challenging but necessary for a fair and accurateperformance test. An automated approach to identify and remove these flights is therefore necessary to apply theperformance test to any set of flights.An uninterrupted flight can be defined as a flight that has not received any clearance from ATC, either lateral,vertical or speed-related, that will change its objectives once it is beyond the freeze horizon. The freeze horizon isthe point after which TMA no longer automatically adjusts the STAs for the flights in the schedule. Lateralinterruptions can be caused by a “direct-to” clearance, route changes in flight plan amendments, vectoring, or similarmaneuvers issued by ATC. A vertical interruption is caused by any interim altitude level-off during a climb ordescent or a change in the aircraft’s current cruise altitude. A speed interruption is caused by a climb, cruise ordescent speed clearance during any of these phases of flight. Any of these interventions may be applied to maintainseparation with other traffic to the meter fix where traffic is handed off from the Center controller to the TRACONcontroller.A significant part of the work presented in this paper reports on the effort of automating the filtering approach toidentify uninterrupted flights from recorded data. Currently, no method for identification of flights exists other thana manual review of voice communications. As a result of this, the FAA uses a static set of flights, recorded in 2006and manually filtered, to test TMA’s accuracy in predicting the ETAs. The use of this data is presented in the nextsection.III. Current Analysis ApproachThis section presents the two approaches currently used by the FAA to test the TP performance requirements ofTMA.2American Institute of Aeronautics and AstronauticsCopyright 2013 by the American Institute of Aeronautics and Astronautics, Inc. The U.S. Government has a royalty-free license to exercise all rights under the copyright claimed herein for Governmental purposes.
A. Data-driven Approach (“Cone” Test)The performance requirement test, referred to as the “cone” test, uses a data set recorded in 2006 in which a setof flights have been hand-picked to exclude those that were impacted by ATC clearances. The test is run on thisfixed set of flights every time a new release of TMA is completed. The performance tested with this approach is thecumulative accuracy of TMA in predicting the ETAs of a set of flights after the freeze horizon at 19 minutes fromcrossing the meter fix. The requirement states that the ETA error should be linearly decreasing from the freezehorizon to the meter fix crossing.The specific FAA requirements description is as follows: TMA SHALL [0580] compute the track-based ETAfor all aircraft type trajectories to within Root Mean Square (RMS) accuracy of /- 60 seconds when the aircrafttime to the CTAS meter fix or meter fix arc is 19 minutes. The error rate SHALL [0581] decrease linearly as:Downloaded by NASA AMES RESEARCH CENTER on August 23, 2013 http://arc.aiaa.org DOI: 10.2514/6.2013-5130!""#" !"# 60 !"# 19 !"# (time to CTAS meter fix or meter fix arc)where the upper bound for time to CTAS meter fix or meter fix arc is 19 minutes. The RMS Error is defined asfollows:!"# !!!!(!"#!"! !"#!"# )!!(1)!Where:! !"# %& !" !"# #!%& !"# ! !" !"#" !"#!"#!"! !"# %& !"# !ℎ!" !"# #!%& ! !"# % !ℎ! !"#" !"#!"#!"# !"# %&#'( !"# !ℎ!" !"# #!%& ! !"## !"# !ℎ! !"#" !"# !ℎ!" 19 !"# %&' !"#This formula is applied to each flight’s ETA calculated by TMA after the flight is within 19 minutes (actualtime) from its meter fix. The flights included in the performance test were manually selected to remove any impactby ATC interventions or under any metering operations in place.B. Operations-based ApproachThe second approach used by the FAA to test the performance of a new release of TMA is performed directly bythe air traffic controllers in the deployed facilities. Running TMA on real traffic flights, controllers look at flightsarriving into a specific terminal area. While listening to the radio communications between ATC and the cockpit, thecontrollers take note of the meter fix ETA calculated by TMA at the predicted freeze horizon for all the flightsarriving at a specific meter fix for a set time interval. If they do not hear any clearance that will change (interrupt)the aircraft procedure inside the freeze horizon, the controllers take note of the actual meter fix crossing time of thespecific flight and compare it to the TMA predicted time at the freeze horizon. This gives them a direct measure ofthe performance. If the ETA calculated by TMA at the freeze horizon is less than 60 seconds different from theactual crossing time for the manual sample of flights, then the new release is considered to be operating acceptably.C. Limitations of the Current ApproachesThe current approaches for the evaluation of TMA trajectory prediction performance requirements have somelimitations. For example, the “cone” test presented in section III.A, as currently implemented, cannot be performedon other recorded data than the 2006 data, which contains arrivals in the Houston ARTCC. The static nature of thedata set carries the risk that 2006 data may not represent current operations in terms of aircraft mix or procedures.Moreover different Centers with different procedures can present specific, and sometimes unique problems. Thosecannot be captured with only one data set. Another limitation of this approach is that, since the data analyzed is from2006, it is necessary to run TMA with 2006 adaptation data. This is because approach procedures are modified overtime by the FAA. Running TMA with current adaptation could cause errors in the conversion of the routes of theflights in the schedule. This problem will be extensively discussed in Section V. The only solution to this issuewould be for the FAA to maintain legacy adaptation data. Since many changes to TMA are in the adaptation data,the impacts of these changes would not be evaluated if the old adaptation were used.The “cone” test evaluates the performance of TMA only for uninterrupted flights. Tying the performance only tothese flights may not reflect some changes in the behavior of the TMA TP for the interrupted flights. In a previousstudy13 change reports performed by the first TMA deployment contractor were analyzed. The changes reported3American Institute of Aeronautics and AstronauticsCopyright 2013 by the American Institute of Aeronautics and Astronautics, Inc. The U.S. Government has a royalty-free license to exercise all rights under the copyright claimed herein for Governmental purposes.
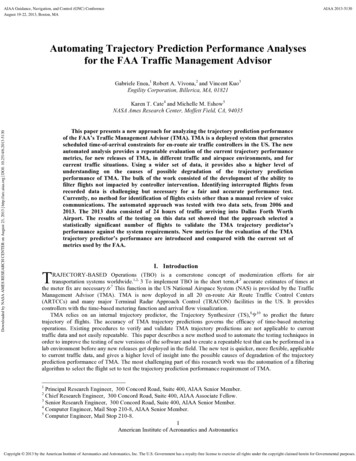
Downloaded by NASA AMES RESEARCH CENTER on August 23, 2013 http://arc.aiaa.org DOI: 10.2514/6.2013-5130were implemented to directly respond to some inappropriate behavior that TMA was presenting in building thearrival schedule. Some of these behaviors are very hard to tie to the “cone” test performance metric, and the workpresented in section VI is geared directly toward these issues. From the same study another problem with TMAtrajectory prediction was the number of trajectory failures. Failures are those instances when, given the radar trackand the objective of the aircraft, the TS cannot calculate a predicted trajectory. Similarly, the “cone” test does notdefine an acceptable level of trajectory failures.One limitation with the approach presented in section III.B is that, in the way it is currently performed, it is noteasily replicated for to a large number of flights, nor easily automated. Moreover since it is a post deployment test, itlooks at the performance of TMA already in the field. The approach presented in this paper aims at identifying anyissues that would be observable by the controllers before TMA leaves the lab. With the new approach, anyundesirable behavior with new releases of TMA would be identified before the change is deployed. To address someof these issues an automated approach has been developed; this approach is presented in the following section.IV. New Automated Analysis ApproachTo mitigate some of the issues presented in the section III.C., an automated, repeatable approach to analyze theperformance of TMA trajectory predictor that would be applicable to any flight data set and to any airspace in theNAS was developed. To achieve this goal, the first and most challenging task was to automate the down-selection(filtering) of a set of flights that was not impacted by any intervention by ATC after the freeze horizon and beforecrossing their intended meter fix. A set of un-impacted flights is necessary to test the performance of TMA since theperformance requirement, by definition, only applies to uninterrupted flights.The automated filtering algorithms classify a flight as being either interrupted or uninterrupted using only theinter-process message data recorded by the deployed or candidate TMA release. The goal was to use recorded ETAand Track data to perform the analysis, with other data such as flight plan as necessary. The critical messages for thefiltering algorithm were:- AIRCRAFT ETA AVERAGED – This is the record of a TMA generated ETA value for the aircraft. Thespeed data for the analysis also come from this message that is recorded by TMA roughly every 12 seconds.- IC TRACK DATA – This is the record of a single received track update. For each track position, Lat/Lon,altitude and time are recorded in this message.- AC CROSSING TIME – This is the record that denotes the aircraft’s actual metering fix crossing time.- IC FLIGHT PLAN ADD – This is the record of a new flight plan. Both the flight plan and the parsedroutes* are recorded in this message.- AMEND FLIGHT PLAN RA – This is the record of an amended flight plan. Both the flight plan and theparsed routes are recorded in this message.The adaptation files necessary for the algorithm:- National waypoints and ZFW waypoints - These files are used to determine the location of the waypointsin the flight plan and parsed routes.Using these recorded data, the algorithm identifies three types of interruptions: altitude, lateral, and speed. To bedefined as interrupted, an aircraft has to change its objective after it has entered the freeze horizon. Therefore, foreach aircraft only the data recorded inside the freeze horizon were analyzed by the algorithm.A. Altitude InterruptionsThe algorithm to identify altitude interruptions evaluates the vertical profile of the aircraft with respect to predefined “acceptable” profiles. There are four possible “altitude profiles” (see Figure 1) representing uninterruptedflights with respect to altitude clearances, although other derivatives of these four are allowed. In Figure 1A, theaircraft’s initial condition at the freeze horizon is in a climb to its cruise altitude. In this case, the aircraft should beuninterrupted in its climb to the cruise altitude and then should stay at this altitude until starting an uninterrupteddescent to the metering fix. In Figure 1B, the aircraft’s initial condition at the freeze horizon is established at itscruise altitude and should continue at this altitude until it starts an uninterrupted descent to the metering fix. InFigure 1C, the aircraft’s initial condition at the freeze horizon is already in a descent. The aircraft should continuethis descent uninterrupted to the metering fix. In Figure 1D, the aircraft’s initial condition at the freeze horizon is ina climb, but the aircraft will only climb to the metering fix crossing altitude. This climb should be uninterrupted. Inall four cases, it is possible that there will be a level-off at the metering fix altitude prior to crossing the metering fixlocation, as shown in the figures.*The parsed routes are commonly called AK routes.4American Institute of Aeronautics and AstronauticsCopyright 2013 by the American Institute of Aeronautics and Astronautics, Inc. The U.S. Government has a royalty-free license to exercise all rights under the copyright claimed herein for Governmental purposes.
ICICMFMFDownloaded by NASA AMES RESEARCH CENTER on August 23, 2013 http://arc.aiaa.org DOI: 10.2514/6.2013-5130(A)Climb- ‐Cruise- ‐Descent(B)Cruise- ‐DescentICMFMFIC(C)Descent(D)ClimbFigure 1 Uninterrupted altitude profiles.By examining the four figures, it can be seen that, given the state of the aircraft (climbing, level, descending) atthe freeze horizon, there are a limited number of allowable state changes that can occur prior to the meter fix if theflight is uninterrupted. For example, if the aircraft is initially climbing, to be uninterrupted the aircraft can only (1)arrive at the metering fix (CLIMB), (2) level-off and arrive at the metering fix (CLIMB), (3) level-off and thendescend to the metering fix (CLIMB-CRUISE-DESCENT), or (4) descend to the metering fix (CLIMB-CRUISEDESCENT). The final case is equivalent to a very short level-off segment between the climb and descent. Similarly,if the aircraft is level or descending at the freeze horizon, to be uninterrupted the aircraft can only descend to themetering fix.To compare the vertical profile of the aircraft to the “acceptable” profiles, the algorithm defines whether acontiguous portion of aircraft tracks (a segment) is climbing, level or descending. The algorithm looks at themaximum altitude difference across a set of tracks for a period of at minimum 60 seconds length. Consistent withthis minimum value, climbing, level or descending segments are created to cover the length of the tracks inside thefreeze horizon. For the N tracks in a segment:- ‐Max altitude, hmax largest altitude value- ‐Time at max altitude, tmax time of the track with the maximum altitude- ‐Min altitude, hmin smallest altitude value- ‐Time at min altitude, tmin time of the track with the minimum altitudeThe segment (i.e., all tracks within it) is considered LEVEL if- ‐hmax – hmin 350 ftThe segment is considered CLIMBING if- ‐- ‐hmax – hmin 350 fttmax tminThe segment is considered DESCENDING if- ‐- ‐hmax – hmin 350 fttmax tmin5American Institute of Aeronautics and AstronauticsCopyright 2013 by the American Institute of Aeronautics and Astronautics, Inc. The U.S. Government has a royalty-free license to exercise all rights under the copyright claimed herein for Governmental purposes.
Downloaded by NASA AMES RESEARCH CENTER on August 23, 2013 http://arc.aiaa.org DOI: 10.2514/6.2013-5130The choice of 350 feet as a threshold value was purely empirical. It was based on observation of the data, and itwas calibrated testing different values and observing the results of the filter. Once the algorithm has identified all ofthe altitude segments, the changes in state (level, climbing, descending) between the segments are compared to theallowable changes in state based on the profiles in Figure 1. Unallowable state changes are an indication that theaircraft was interrupted by an altitude clearance.B. Lateral InterruptionsSimilar to the altitude interrupt algorithm, the approach for identifying unallowable lateral state changes whenanalyzing track data inside the freeze horizon was defined. Lateral state changes are used as an indication of: (1)whether the flight is following the Flight Plan route used by TMA, and (2) whether the aircraft track is in a turn. Therelationship to the flight plan route is identified by comparing the track data with the Flight Plan route used by TMAto predict the ETAs at the meter fix. The Flight Plan route is received as a series of waypoints. Depending on therelationship between the Flight Plan route and the track data, the algorithm defines whether the aircraft wasinterrupted by a lateral clearance such as a vector. When the relationship cannot be unambiguously identified, theflight is dismissed from the ETA accuracy analysis. The approach to identifying a lateral interrupt is summarized inthe following sections.1. Preliminary CalculationsTo identify if a flight is laterallyinterrupted, a few preliminarydefinitions and calculations arenecessary:- ‐ Abeam point is defined as theprojection, in an XY earth plane, of atrack data point, onto the Flight Planroute, as represented in Figure 2.- ‐ For each track data point theabeam point distance d between theflight plan route and the track iscalculated. If the distance d is greaterFigure 2 Definition of abeam pointthan 5 nautical miles, the track pointis considered out of conformance withthe route and therefore not following its flight plan route. The choice of 5 nautical miles for the d thresholdvalue here was empirical and based on the observation of the data. The objective of the filter was not tostrictly identify flights on their route, but to interpret the objective of the aircraft. This value may be tunedwhen applied to different datasets.- ‐To identify Turns, the x/y track values of a series of track data are analyzed to fit a linear polynomial line tothe data. The abeam distance between each track data and the line is calculated. If the distance between theline and a track point is greater than 1 nautical mile, the segment is considered to be a turn segment,otherwise it is a straight segment. Similar to the altitude interrupt algorithm, this algorithm uses thisdefinition of straight and turn segments to divide the lateral tracks inside the freeze horizon into a series ofstraight or turn segments.2. LateralInterruptions AlgorithmThelateralinterruptalgorithm is based on aseriesofcasesrepresentingdifferentrelationships between theaircraft tracks and theflight plan route. Eachcase is described next.Figure 3 Flight initially following the Flight Plan route6American Institute of Aeronautics and AstronauticsCopyright 2013 by the American Institute of Aeronautics and Astronautics, Inc. The U.S. Government has a royalty-free license to exercise all rights under the copyright claimed herein for Governmental purposes.
Downloaded by NASA AMES RESEARCH CENTER on August 23, 2013 http://arc.aiaa.org DOI: 10.2514/6.2013-5130Figure 4 Special cases: Flight initially following the Flight Plan route. Excluded fromanalysis.If the aircraft isinitially following theflight plan route (Case1.A, Figure 3) thefollowing situations canoccur:- ‐ If the tracksfollow the route all theway to the meter fix andno route changes thatchange the lateral pathreceived after the freezehorizon, then the flight isnot interrupted;- ‐ If a new flightplan amendment and newroute† are received afterthe freeze horizon, thenthe flight is consideredinterrupted;- ‐ If the flight leavesthe flight plan route(abeam point d) but noflight plan amendmentand no new route arereceived after the freezehorizon, then there are two possibilities:o If there are no turns after crossing the freeze horizon (Case 1.B), the behavior is ambiguous(interrupt would depend on when the clearance to leave the route was received prior to or after thefreeze horizon) so it is excluded from the analysis;o If thereare turns anywhere afterthe freeze horizon (Case1.C), then the flight isconsidered interrupted.Figure 5 Flight initially off the Flight Plan route†For Case 1.B (Figure4 top) the ambiguitycomes from the fact thatit’simpossibletodetermine only from thecomparison of the flightplan route and the actualtrack points if the flightwas proceeding direct tothe meter fix due to aclearancereceivedbefore the freeze horizonor if it was originally onits flight plan route andTo be considered a “new” route it has to be laterally different from the Flight Plan route.7American Institute of Aeronautics and AstronauticsCopyright 2013 by the American Institute of Aeronautics and Astronautics, Inc. The U.S. Government has a royalty-free license to exercise all rights under the copyright claimed herein for Governmental purposes.
Downloaded by NASA AMES RESEARCH CENTER on August 23, 2013 http://arc.aiaa.org DOI: 10.2514/6.2013-5130was cleared direct to the meter fix after the freeze horizon. If the clearance was prior to the freeze horizon, the flightis uninterrupted. If after the freeze horizon, then it was interrupted. Since the difference cannot be determined onlyfrom the flight plan route and the actual track points, these flights are flagged and excluded from the analysis. ForCase 1.C (Figure 4 bottom), since there is a turn after the freeze horizon that takes the flight off the flight plan route,it is safe to assume that a lateral clearance was issued by the controller after the freeze horizon and therefore theflight is considered interrupted.If the aircraft is initially off the flight plan route (Case 2.A in Figure 5), then the following cases can occur:- ‐If no turns after the freeze horizon, the flight is not interrupted- ‐If any turns after the freeze horizon and the aircraft is NOT on the route when the turn occurs, then theflight is considered interrupted- ‐If there are turns onto route or to connect to route then flag for ambiguous behavior and exclude from theanalysis.In Case 2.B and Case 2.C (Figure 6), the clearance to connect to the route could have either occurred before thefreeze horizon (uninterrupted) or after (interrupted). Since these two cases cannot be separated from just the flightplan and track data, they are excluded from the analysis.C. Speed InterruptionsSimilar to the previousalgorithms, the speed filterhas the objective toidentify speed controlsapplied by ATC thatwould invalidate the flightfor use in the analysis.Since these impacts haveto be identified fromrecorded speed data thatare calculated by TMAfromthepositionsobtained from RADARtracks, this part of theanalysis was the mostchallenging. To partiallyovercome this problem,the speed data were preprocessedtoremoveobvious outlier data pointsidentified as creating unrealistic speed jumps.The variations in speedthat can be observedinsideTMA’sfreezehorizon are affected by theFigure 6 Special cases: Flight initially off the Flight Plan route. Excluded from analysis.phase of flight the aircraftis currently flying. “Typical” variations in climb, cruise and descent speed are very different. For this reason thespeed observations were segregated by phase of flight. For flights that included a climb phase of flight, speedinterruptions during the climb phase were ignored. The speed interrupt algorithm was therefore based on theobservation of:- ‐Speed variations during the cruise phase in terms of Calibrated Air Speed (CAS), and- ‐Speed variations during the descent phase to identify “typical” CAS evolutions.These two pieces of information showed clea
The objective of the work described in this paper is to use recorded data to identify problems with the TP performance of TMA. The FAA uses two approaches to test a new release of the TMA system, one in a laboratory environment before the deployment, and one in the field, after a new release of TMA has been deployed.