Transcription
Real Estate Price Prediction Using MachineLearningMSc Research ProjectData AnalyticsAswin Sivam Ravikumarx16134621School of ComputingNational College of IrelandSupervisor:Thibaut Lust
National College of IrelandProject Submission Sheet – 2017/2018School of ComputingStudent Name:Student e:Project Title:Word Count:Aswin Sivam Ravikumarx16134621Data Analytics2016MSc Research ProjectThibaut Lust11/12/2017Real Estate Price Prediction Using Machine Learning6000I hereby certify that the information contained in this (my submission) is informationpertaining to research I conducted for this project. All information other than my owncontribution will be fully referenced and listed in the relevant bibliography section at therear of the project.ALL internet material must be referenced in the bibliography section. Studentsare encouraged to use the Harvard Referencing Standard supplied by the Library. Touse other author’s written or electronic work is illegal (plagiarism) and may result indisciplinary action. Students may be required to undergo a viva (oral examination) ifthere is suspicion about the validity of their submitted work.Signature:Date:11th December 2017PLEASE READ THE FOLLOWING INSTRUCTIONS:1. Please attach a completed copy of this sheet to each project (including multiple copies).2. You must ensure that you retain a HARD COPY of ALL projects, both foryour own reference and in case a project is lost or mislaid. It is not sufficient to keepa copy on computer. Please do not bind projects or place in covers unless specificallyrequested.3. Assignments that are submitted to the Programme Coordinator office must be placedinto the assignment box located outside the office.Office Use OnlySignature:Date:Penalty Applied (ifapplicable):
Real Estate Price Prediction Using Machine LearningAswin Sivam Ravikumarx16134621MSc Research Project in Data Analytics11th December 2017Is it possible to predict the real estate house predictions effectively using Machinelearning algorithms and advanced data mining tools.AbstractThe below document presents the implementation of price prediction projectfor the real estate markets and housing. Many algorithms are used here to effectively increase the accuracy percentage, various researchers have done this projectand implemented the algorithms like hedonic regression, artificial neural networks,AdaBoost, J48 tree which is considered as the best models in the price prediction.These are considered as the base models and by the help of advanced data miningtools algorithms like a random forest, gradient boosted trees, multi layer perceptronand ensemble learning models are used and prediction accuracy is attained in ahigher rate. The results and evaluation of these models using the machine learningand advanced data mining tools like Weka, Rapid Miner will have the more influence in the price prediction.Keywords:Random Forest,Multiple Regression,Support Vector Machine,Gradientboosted trees,Multi layer perceptron,bagging,price prediction,R,Weka,Rapid miner,Machinelearning,Advanced data mining.Contents1 Introduction22 Related Work2.1 A Review Of Price predictions . . . . . . . . . . . . . . . . . . . . . . . .2.2 Summary of Literature Review . . . . . . . . . . . . . . . . . . . . . . .3373 Methodology3.1 Description of Data-sets . . . .3.2 Data Cleaning And integration3.3 Detection Of Outliers . . . . . .3.4 Tools . . . . . . . . . . . . . . .3.4.1 R Studio . . . . . . . . .3.4.2 Rapid Miner . . . . . . .3.4.3 Weka . . . . . . . . . . .78889999.1.
3.53.4.4 Regression . . . . . . . . . . . . . . . .Machine Learning Algorithms . . . . . . . . .3.5.1 Random Forset . . . . . . . . . . . . .3.5.2 Multiple Regression . . . . . . . . . . .3.5.3 Support Vector Machine . . . . . . . .3.5.4 Gradient Boosting . . . . . . . . . . .3.5.5 Neural Networks . . . . . . . . . . . .3.5.6 Ensemble learning Bagging . . . . . . .3.5.7 Accuracy Calculation And visualisation.4 Implementation4.0.1 Need of a Technical Environment . . . . . . . . . . . . . .4.0.2 Data Source . . . . . . . . . . . . . . . . . . . . . . . . . .4.0.3 Data cleaning . . . . . . . . . . . . . . . . . . . . . . . . .4.0.4 Tool 1 R studio . . . . . . . . . . . . . . . . . . . . . . . .4.0.5 Implementation of Random Forset and Multiple Regression4.0.6 Tool 2 Rapid Miner . . . . . . . . . . . . . . . . . . . . . .4.0.7 Implementation Of SVM and Gradient Boosted . . . . . .4.0.8 WEKA implementation of Neural networks and Bagging .5 Evaluation5.1 Coefficient of determination5.2 Root Mean Square Error . .5.3 Evaluation of Result . . . .5.4 Over all Case Study . . . .5.5 Tableau Visualization . . . .5.6 Discussion . . . . . . . . . 6 Conclusion and Future Work197 Acknowledgements191IntroductionWe need a proper prediction on the real estate and the houses in housing market we cansee a mechanism that runs throughout the properties buying and selling buying a housewill be a life time goal for most of the individual but There are lot of people makinghuge mistakes in united states of America right now when buying the properties most ofthe people are buying properties unseen from the people they dont know by seeing theadvertisements and all over the grooves coming around the America one of the commonmistakes is buying the properties that are too expensive but its not worth it. In the housing market 2017, there is a survey that in the year 2016 the house sold in the Americawere about 5.42 million but the starter home inventory down up to 10.7% from 2015.There was an economic collapse in the year 2007 and 2008 so there were severaleconomic indicators that give the clue of impending disaster, this situation is currentlyhappening and the economic indicators suggest that the housing prices are getting highpeople uses the real estate to known the current economic situations, the US government
fails to produce the data about the house prices so it becomes difficult to buy the properties so the 87% of the people who needs to buy houses are using the Internets to searchso there is evidence there is a correlation between housing sales and housing prices.In general, real estate may have the valuation of land may be obliged to furnish.A quantitative measure of the profit is carried out by many different Players in thecommercial center, for example, land agents, Appraisers, assessors, mortarboard lenders,brokers, Developers, gurus Also reserve managers, lenders,etc. Business worth will beevaluated through that requisition. From claiming valuation systems Also methods thatreflect those nature Of property and the condition under which those provided for. Theproperty might well on the way exchange in open market under many conditions and circumstances, people are the unaware amount the current situations and they start losingtheir money, the change in prices of properties would affect both the common people andthe government, to avoid certain circumstances there is a need of price prediction.Many methods have been used in the price prediction like a hedonic regression inthis I am trying to predict the predict the real estate price for the future using the machine learning techniques with the help of the previous works. I have used the randomforest, multiple regression and more algorithms with different tools to predict the houseprice So, it would be helpful for the people, so they will aware of both current and futuresituations, so it may avoid them in making mistakes. The remaining paper is organizedas section 2 describes the previous works done by different researchers using differentalgorithms section 3 provides the methodology and the tools used and section 4 explainsthe way that the algorithms implemented, and comparisons and results are given in thelast section.2Related WorkBefore committing to the project several ground works should be done so there is a needfor literature review I have analyzed many papers regarding the price prediction relatedthe house markets and other different sectors. The papers I have taken will be in thedifferent years up to the present year and I have used the recent and latest technologies,our main goal is to get more accuracy than the previous works the below passages willdescribe the past prediction works done by the various researchers and it will be helpfulto implement the corresponding project.2.1A Review Of Price predictionsAt present each framework may be moved towards innovation for the simplicity fromclaiming operations. The training framework will be moving towards e-taking. Individuals tend to move from the manual to robotized methodology. That primary goal of thethis will be will anticipate that lodging cost with admiration to the plan of the clients.Those exhibit strategies may be An long procedure in which those customers necessitiesto contact the land operator. The land operators give acceptable A suggestive on thelodging costs prediction. This strategy includes high hazard a direct result the land operator might furnish the bad data of the clients. They employments those straight relapsecalculations should figure the cost. This analyses likewise utilized to foresee the bestarea for the clients to purchasing the houses. The information here utilized is from thoseMumbai lodging board since 2009. Eventually, Tom’s perusing utilizing this straight relapse he predicted the rate for every square foot. This prediction indicates the square
feet of the house will be raised Eventually Towards 2018.(Bhagat et al.; 2016)The mankind’s wealthiness is measured Eventually Purchasing a house includes a considerable measure from claiming consolidated choices. Concerning illustration, the sameapproach offering A house may be additionally troublesome. There needs aid where boththe customers and sellers should get them an equal amount of profit. A different modelwill be carried Eventually that is the Cox regression model for those exact prediction.This model may be propelled starting with survival Investigation. That information utilized for this prediction is from the website named Trulia. He Additionally suggested thatit is difficult to get the actual selling time with the website time this is because the observation time is far beyond the data. He also suggests that unsupervised learning methodshave more popularity when compared to the other methods. (Li and Chu; 2017) alsosays that survival regression method helps to predict the values with the help of usingthe each and very attributes related to the house and its surroundings.(Li and Chu; 2017)A late worth of effort carried out Toward to house value. The valueof the house may be influence Toward Different budgetary factors. As we all know thatChina is one of the most populated countries around the world. Here the author tries tomake a prediction to help the banks to provide the home loan for the customers. Thatprediction compares to Cathy house value list provided by the China. The information isgotten from Taipei lodging segment the over-proliferation after the data collection theyuse the machine learning algorithm neural network to predict the price the and accuracyof the prediction can find out using the RMSE (ROOT MEAN SQUARE ERROR) andthe MAE(MEAN ABSOLUTE PERCENTAGE ERROR).(Li and Chu; 2017)(Willmott;1981)(Park and Bae; 2015)During the year 2005 there seems to be a high rise in interests onthe American housing markets so the America was forced into bankruptcy so it reflectsUS housing markets they were declined up to 30 to 60 % in the major cities it wascontinued for many years, after the November 2012 it started to recover because theinvestment becomes low so there was a demand so the author tries to research anddeveloped a prediction model to get whether the closing price is higher or lower by usingthe machine learning to obtain the knowledge and to predict the future. Here he uses theKDD model knowledge discovery databases the data here used seems to be merged fromthe different data sets and uses the WEKA software to find them a multiple algorithmslike decision tree is used to finding the relationship in the database, here park and bayuses the RIPPER, C4.5 (J48), naive Bayesian and Ada-Boost every algorithm is usedunder different conditions RIPPER is used for selecting the majority class and minorityclass, naive Bayesian is used to divide the data set into different classes by calculatingthe probability distribution and AdaBoost is used to improve the classification and hereperforms the two methods one is three way split with 10 folds and 10 folds cross validationby his results achievements RIPPER have the more prediction compared to the other.(Piazzesi and Schneider; 2009)Those foreseeing those value of the product alternatelyan arrangement may be altogether intricate. The cost prediction is basically utilizedwithin impart business sector. Yet the prediction from claiming offer worth may beprecise perplexing due to it dynamic clinched alongside the way. Need to be carried out aneural system model to foreseeing the stock value. This gives an association between thosestocks Also benefit. In this model, the creator utilized the stock information need. Thefollowing venture will be to ascertain those relapse components based upon the shuttingesteem of the stock. Straight relapse will be performed on the first information situated.Right away the duplicate of the first information situated is made What’s more Fourier
analysis may be connected. Following that Fourier analysis, that standardization ofinformation will be finished. This makes an MLP with a portion neuron. Right away theneural system calculation may be actualized. This calculation gives preferred correctnessdone prediction Also offers great commotion tolerance. The principal hindrance is thatthe stake business sector information continues overhauling and the prediction turns intowas troublesome.The author(Gu et al.; 2011) says that housing price involves the various economicinterest it also includes both the government and the peoples so there is in need of accurateforecasting so the three researchers from key laboratory developed a new model using thegenetic algorithm and the support vector machine. They have clearly mentioned theregression theorem of the support vector machine and introduced a new function calledkernel with the help of Karush-Kuhn-Tuckers(KTT) conditions. here they have combinedthe genetic algorithm with the SVM and named it as G-SVM where the kernel functionswill be in chromosomes and each will divide into three segments the author is aware of thefitness model so they have calculated the fitness value of for each chromosome so therewill less percentage of over fitting model and three operations selection, crossover andmutation operation are performed and the results are obtained . there is a comparisonbetween the grey model and GSVM and GSVM executes the results faster and moreprecise as suggested by the founders.The authors(Limsombunchai; 2004) try to provide a more accurate prediction on thehouse prices to improve efficiency to the real estate present in New Zealand he suggeststhat most peoples in New Zealand have their own houses the sample data is obtainedfrom one of the trusted real estate agency so we can believe that there will not be anerror in the data here he compared the hedonic price and the artificial neural networktheory when conducting the hedonic price model there is hypothesis based on the previousworks it seems to have a positive relationship. In the neural;l network the author uses thetrained data in order to avoid the prediction errors the work strategy of neural networksis stated clearly and at last when comparing the results the author says that artificialneural network has more performance when compared to the other one.The author determines the housing prices in the turkey as by the method (Limsombunchai; 2004) the data is taken from the household survey during the year 2004 theysuggest that hedonic multiple regression models are mostly used for the price predictionbecause they tend to fit the data into the model by observing the results there is no multicollinearity between the variables but there is heteroscedasticity due to the white statestatistics suggesting that there will be potential problem in the model also some variables are dominating the significant variables in the house price predction while comingto the artificial neural networks they suggest that networks have the capacity of adaptingand it is also one the flexible models in this predection feed forward network is usedfor prediction by comparing their results ANN (ARTIFICIAL NEURAL NETWORK)tends to have more performance when it compared with the hedonic multiple regressionas suggested by the(Nghiep and Al; 2001)The authors(Selim; 2009) have compared the multiple regression analysis over theartificial neural networks by using the 60% data for the house pricing prediction severalcomparisons have been made in their predictive performance they have compared with thedifferent training size and selecting the data in their size ie) the sample data size variousfor the performance detection. For calculating the error two different equations are usedmean absolute percentage error and the absolute percentage error, here the absolutepercentage divides the properties into three different stages based on the FE(Forecasting
error) percentages Totally six different comparisons are made for more efficiency, here it’sclear that if there is enough or sufficient data size artificial neural network can performbetter or else the results will be different as said by(Willmott; 1981)The two authors (Wu and Brynjolfsson; 2009) from MIT have conducted about theprediction that how the Google searches the housing price and sales across the worldsuggesting that in the present world every prediction percentage point is correlated withthe next year house sales. The author reveals about the correlation between them housingprice and their related searches and the positive relationship between them. The data istaken from the Google search which means the search queries by using the Google trendsand with the help of a national association of real-tors the data is collected for all thestates present in the united states of America and found the highest number of housessold during the year 2005 and the recession starts over 2009 by using the auto regressive(AR) model, by using it the relationship between the search queries and housing marketindicators they have estimated the baseline for housing price prediction and they arewell shown in the figures and suggesting that if there demand to house and there will bedemand in house hold appliances.The author gives the brief detail about how the random forest algorithm is used forthe regression and classification, boosting and bagging are said to be the methods whichproduce a many classifiers the difference between the boosting and bagging Is as said by(Liaw et al.; 2002) is the successive tress, the point weights are calculated and majoritywill take for the prediction.during the year 2001 (Nghiep and Al; 2001) he proposed therandom forset which is related to bagging and it gives more randomness the completeprocess of random forset classification and regression are stated here for the regressionthey have used the Boston housing data and find out the forecasting error ie) RMSE rootmean squared value asFigure 1: MSEhere the author speaks about the variable importance and the ocean proximity, variable importance helps to give whether the prediction error increases or not and alsowhich variable will have more influence on the prediction and the proximity error helpsto find shape and structure of the data.(Breiman; 1996)Bagging predictors a method which helps to give various versions ofa predictor with the support of aggregated predictor the bagging algorithm is used inboth moderate and large data sets on par as for both regression and the classificationas same the Boston housing data is used for the here the data is divided in the ratio of10:90 10 % of the testing and the remaining 90% for the training and by using the 10 foldcross-validation regression tree is built and the process takes places for this data testingand the training process is continuously takes place over 100 times for each time a newcases will be generated and the RMSE estimated standard errors seems to be decreasedwhich the prediction accuracy is high when it compared with the other.For classification problems, there is a way to find out the accuracy percentage with thehelp of the confusion matrices we can find out the accuracy percentage but the regressionthere is only one possibility to calculate the RMSE root mean squared error here the
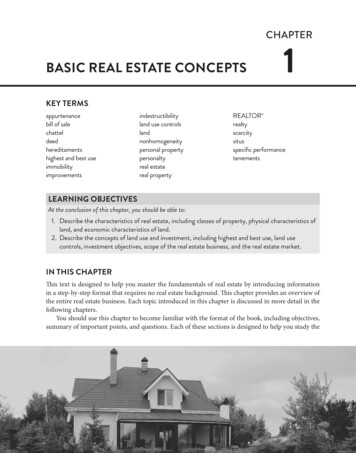
author says about the error indices an average error of a model calculated using themean squared error (MSE) or the root mean squared error (RMSE) . there is a problemin using the correlation coefficient as the significance test, not an appropriate one so thatwe prefer the RMSE.2.2Summary of Literature ReviewFor every project the literature review will give clear idea and it will serve as the base linehere most of the authors have concluded that artificial neural networks have the moreinfluence in predicting but in the real world the other algorithms should be also takeninto consideration. by conducting this study it helps to know about both the pros andcorns and it had helped me to successfully implement the project.3MethodologyThe below passages describe about the methodology used in the real estate house pricepredictions and the architecture flow diagram is given.Figure 2: Architecture of price prediction
3.1Description of Data-setsThe real estate housing data is used in this and it is taken from the UCI machine learningrepository and the ageron the data is spread across 20000 rows and has the ten attributesthe description of the data set is given belowvariable tableS.noVariablesInteger type1LatitudeReal2LongitudeReal3Housing median ageInteger4Total RoomsInteger5Total r8Median IncomeReal9Median House house(Price) Integer10Ocean ProximityPoly-nominal11Special Attribute Yvalue to be predictedHere there are totally 10 predictor variables and the Y variable will be median houseprice which is going to be predicted.3.2Data Cleaning And integrationThe data obtained from the repository is in the form text file I have connected thetext with the excel and the data is being extracted from the text file and moved intothe excel file and it has been saved as the comma-separated file. Data cleaning is aniterative process, the first iterate is on detecting and correcting bad records the datataken from the repository have many inconsistencies and null values before loading intothe machine learning models the data should be corrected in order to get the high accuracyof prediction as I am using the different tools for prediction, the cleaning process differsfrom one other but the ultimate goal is to gain more accuracy. The real estate data havesome missing information they dont have the states name only latitude and longitudewere given by using the R program I have identified the states they all seem to be thestates present in the united states of America and the null values are removed to reducethe inconsistency.3.3Detection Of OutliersAn outlier is an extremely high or extremely low-value value in the data it can be identifiedif whether the value is greater than interquartile range Q3 1.5 or Q1 - 1.5 detecting theinterquartile range is arrange the data in an order from the lower value to the higher value,now the mean is taken for the first set of values and second set values now by subtractingboth mean we can get the interquartile range the formula is Q3 (1.5)(quartile range)and for Q1-(1.5)(quartile range) and I have calculated using the R program.
ctionproject.Tools and AlgorithmsName of the toolAlgorithms usedR studioRandom forset,Multiple RegressionRapid Neural networks,BaggingS.no1233.4.1areR StudioIts one of the open source and free development tool used for the statistical, machinelearning and graphics tool.3.4.2Rapid MinerRapid miner is a data science platform and its one of the open source innovation integratedwith many analytical methods and the predefined machine learning algorithms the reasonfor using them is to find whether the tools have any significant influence in giving moreaccuracy when compared to the written programs.3.4.3WekaWeka is graphical interface learning which computes the machine learning and data mining techniques the working process differs from every different platform here the algorithmcan be directly applied to the model with the several conditions.3.4.4RegressionIt is a data mining task of predicting the value of target(numerical variable) by buildinga model based on the one or more predictors the predictors can either be numerical orthe categorical variables.3.53.5.1Machine Learning AlgorithmsRandom Forset(Patel et al.; 2015)Random forest algorithm can be used to predict both the classificationand the regression it is also be called as the regression forests. The main process is itdevelops lots of decision tree based on the random selection of data and the randomselection of variables and it provides the class of dependent variable based on many trees.The main advantage of using this algorithm to my dataset is it handle the missing valuesand it can maintain the accuracy of the missing data and the chance of overfitting themodel is low and we can except high dimensionality when we apply to the large leveldataset. In regression trees, the outcome will be continuous.
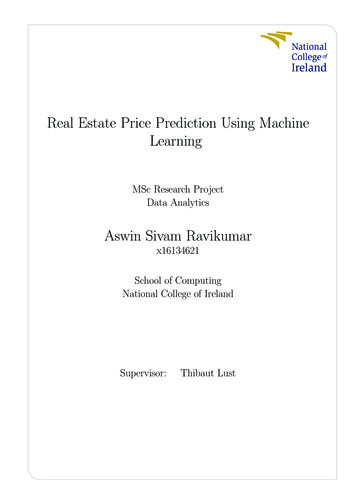
3.5.2Multiple RegressionIts a new version of the linear regression which is considered to be more powerful whichworks with the multiple variables or the multiple features it helps to predict the unknownvalue of the attribute from the known value of the two or more attributes which will bealso known as the predictors (Chang and Liu; 2008)3.5.3Support Vector MachineSupport vector machine regression is derived from the classification algorithm known asthe support vector machine SVM produces a hyperplane that separates the points withthe different labels here I am using the similar method instead of separating the datait produces a hyperplane that is close to the most of the points. So the price can bepredicted by (Trafalis and Ince; 2000)3.5.4Gradient BoostingAs said by(Ganjisaffar et al.; 2011)Gradient boosting can be used for both the regressionand classification gradient boosting is a technique for producing regression models consisting of collections of regressors it is an instantiation of this idea for regression the maintheme is to repeatedly follow the procedure here we are learning the simple regressionpredictor of the data then we are computing the error residual. The amount of the errorper data point and we a learn a new model to predict the error residual. The mainconcept is we are making a set of predictions then finding the errors and we are reducingit.3.5.5Neural NetworksMLP is the multilayer perceptron it is a part of artificial neural networks it has the samestructure of a single layer percepron with one or more hidden layers, in this the hiddenlayer will be directly connected to the input layer here the input values are presented inthe perceptrons, the perceptrons will classify any linear separable set of inputs if the inputvalues presented to the perceptron, and if the predicted output is as same as the desiredoutput, then the performance is considered satisfactory and we know that no changes tothe weights are made, if it does not match then the weights need to be changed to reducethe error.(Koskela et al.; 1996)Figure 3: Multi layer perceptron Model
3.5.6Ensemble learning Bagging(Mirmirani and Cheng Li; 2004)It is part of machine learning known as the ensemblelearning mete algorithm which is designed to improve the stability and to reduce thevariance and accuracy. Its nothing but the application of group learning so essentiallyhere multiple models are built they come together and bring a forth model that is moreaccurate. In bagging various models are built in parallel on various samples and then thevarious models vote to give the final model and hence prediction.3.5.7Accuracy Calculation And visualisationThe indicators I am used to evaluating the performance accuracy is the mean absoluteerror which is the difference between the predicted value and the actual value. Afterprediction the results data will be loaded into the tableau so it can be clearly visualizedand it can also be used for the future works.4ImplementationThe main aim of this project to be implemented is to find out the accurate prediction ofthe real-estate properties present in the united states of America for the next upcomingyears, the below segment blankets will help you to know the implementation process indepth. Here step by step process involved is represented below.1. Scientific Environment.2. Source of a Data.3. Excel 2016: the first process to store the data.4. Loading data into R, Rapid Miner, Weka.5. Normalizing the data.6. Detecting Outliers.7. Analysis and visualization using the R, Rapid Miner, Weka.8. Machine learning models are build using the Cat Tools, and the various a
and ensemble learning models are used and prediction accuracy is attained in a higher rate. The results and evaluation of these models using the machine learning and advanced data mining tools like Weka, Rapid Miner will have the more in u-ence in the price prediction. Keywords:Random Forest,Multiple Regression,Support Vector Machine,Gradient