Transcription
Stock Liquidity and Corporate Tax Avoidance: The Tale of TwoTailsYangyang ChenDepartment of Banking and FinanceMonash UniversityLeon Zolotoy*Melbourne Business SchoolUniversity of MelbourneFirst draft: May 2013Current version: January 2014ABSTRACTWe examine the relation between stock liquidity and corporate tax avoidance.Utilizing a quantile regression framework for the comprehensive sample of US firms,we document the following key results: (i) stock liquidity is positively (negatively)associated with the lower (upper) tail of the tax avoidance distribution; (ii) the effectof stock liquidity on both tails of tax avoidance distribution is stronger for firms withhigh levels of business uncertainty; and (iii) the effect of stock liquidity on the lower(upper) tail of tax avoidance distribution is mitigated (magnified) for the financiallyconstrained firms. Our findings are consistent with the positive feedback channelwhere, by making share prices more informative to managers, greater stock liquidityaffects firm’s tax planning.JEL Classification: G10, G30, M40.Keywords: Stock liquidity; Tax avoidance; Information asymmetry; Financialconstraints; Positive feedback.* Corresponding author. Address: 200 Leicester Street, Carlton VIC 3053. Email:L.Zolotoy@mbs.edu. Tel: 61 3 9349 8424.1
I. INTRODUCTIONCorporate tax avoidance has become a substantial issue in both finance andaccounting research in recent years. The statutory corporate tax rate in the UnitedStates is one of the highest in the world. At the same time, there is striking variationin corporate tax payments among U.S. firms. At one extreme, a substantial share ofprofitable U.S. corporations pay very little or even no corporate taxes, which makessome observers view corporate tax avoidance as the most important compliance issuein the U.S. tax system today (Desai and Dharmapala, 2006). At the other extreme,approximately one-fourth of U.S. firms pay corporate taxes in excess of the statutorytax rate (Dyreng, Hanlon, and Maydew, 2008), suggesting that these firms engage inlittle or no tax avoidance. Why do some firms pay little corporate tax while others payexcessive levels? The determinants of corporate tax avoidance are still far from beingwell understood, and are a fertile ground for further research in this important area(Shackelford and Shevlin, 2001; Hanlon and Heitzman, 2010).We examine the effect of stock liquidity on corporate tax avoidance. Two strandsof the previous literature motivate our research question. The first strand examines thedeterminants of tax avoidance and its implications for shareholder wealth. Studies inthis stream of research view tax avoidance as an investment decision along thecontinuum of tax planning strategies available to managers, where in equilibrium avalue-maximizing firm should invest in tax avoidance as long as marginal benefits oftax avoidance exceed its marginal costs (Hanlon and Heitzman, 2010; Edwards,Schwab and Shevlin, 2013). However, similar to other investment decisions,2
managers may deviate from the optimal level of investment in tax avoidance (fromthe shareholders’ perspective) by investing either “too little” or “too much” in taxplanning (Armstrong et al., 2013). On the one hand, overly-conservative taxavoidance (that is, being in the lower end of the continuum of tax planning strategies)results in loss of potential cash-savings (Graham and Tucker, 2006; Cheng et al.,2012). On the other hand, overly-aggressive tax avoidance (that is, being in the upperend of the tax planning continuum) facilitates managerial rent extraction (Desai andDharmapala, 2006; Kim, Li and Zhang, 2011), and may also result in additionalauditor fees, legal fines and reputational costs (Mills, 1998; Wilson, 2009; Graham etal., 2013), and thus will erode shareholder wealth1.A second strand of related literature examines the effect of stock liquidity onfirm’s investment decisions. Prior studies suggest that firm managers makeinvestment decisions that are contingent on the information revealed by the firm’sstock price (e.g., Subrahmanyam and Titman, 2001; and Khana and Sonti, 2004), andthat the sensitivity of firm’s investments to stock price is increasing in stock priceinformativeness (Chen, Goldstein and Weng, 2007). Greater stock liquidity facilitatestrading by informed traders (Easley and O’Hara, 2004), thereby making share prices1Prior studies provide empirical evidence consistent with investors perceiving both overly-conservative and overly-aggressive tax avoidance as the value-destroying activities. For the overlyconservative tax avoidance, Cheng et al. (2012) find that, relative to matched firms, businesses targetedby hedge fund activists exhibit lower tax avoidance levels prior to hedge fund intervention, butexperience increases in tax avoidance after the intervention. For the overly-aggressive tax avoidance,Hanlon (2005) document that investors perceive large book-tax differences (book income greater thantaxable income) as a “red flag” and reduce their expectations of future earnings persistence for thesefirms. In a similar context, Hanlon and Slemrod (2007) find that, on average, a company’s stock pricedeclines when there is news about its involvement in tax sheltering.3
more informative to managers and allowing firm management to make betterinvestment decisions, a so-called “positive feedback” effect (Fang, Noe, and Tice,2009).2High stock liquidity may also improve firm’s investment decisions through thecorporate governance channel. For instance, Maug (1998) shows that stock liquidityfacilitates the formation of larger blockholdings and more liquid trading by theseblocks, thereby enhancing blockholders’ voice and their ability to intervene.Alternatively, stock liquidity may discipline managers by enhancing the threat ofblockholder exit, when managerial compensation is closely tied to firm’s stock price(Edmans, 2009; Edmans and Manso, 2011; and Bharath, Jayaraman, and Nagar,2013).Collectively, prior research suggests that (i) tax avoidance is a part of firm’soverall investment strategy, (ii) there are beneficial effects of stock liquidity on firm’sinvestment decisions, and (iii) there are adverse implications of both overlyaggressive and overly-conservative tax avoidance strategies for shareholder wealth.Integrating these three sets of results, we posit that firms with high stock liquidity willengage less in both overly-conservative and overly-aggressive tax avoidance, ceterisparibus.2A positive feedback perspective rests on the premise that the extent of share price informativeness isdetermined by stock liquidity, and not the other way around, consistent with what prior studies suggest(e.g., Grossman and Stiglitz, 1980; Kyle, 1985; Easley and O’Hara, 2004; Chordia et al., 2008; andJayaraman and Milbourne, 2012). In particular, Chordia et al. (2008) document that liquidity Grangercauses stock price informativeness, but find no statistical evidence of reverse causality.4
Consistent with our predictions, we document a positive association betweenfirm’s stock liquidity and the lower tail of the conditional tax avoidance distribution,which is symptomatic of firm’s underinvestment in tax avoidance. We also documenta negative association between a firm’s stock liquidity and the upper tail of tomaticoffirm’soverinvestment in tax avoidance. The effect is economically significant and is robustacross different measures of tax avoidance and stock liquidity. We use stock splits asa positive shock to stock liquidity and the instrumental variable method to addresspotential endogeneity concerns, and obtain consistent results.Next, we examine possible mechanisms for how stock liquidity may affect taxavoidance. We find that the effect of stock liquidity on both tails of the tax avoidancedistribution is stronger for firms with high levels of business uncertainty. Further, theeffect of stock liquidity on the lower (upper) tail of tax avoidance distribution ismitigated (magnified) for the financially constrained firms. These results providesupport for the existence of a positive feedback channel. On the other hand, we findthe effect of stock liquidity to be similar across firms with high versus lowshareholder rights, and across firms with high versus low managerial pay-forperformance-sensitivities. These findings are inconsistent with either blockholderintervention or blockholder exit channels.Our paper contributes to the existing literature in several ways. First, at a broaderlevel, our paper can be viewed as a contribution to the tax avoidance research. Priorstudies on the determinants of tax avoidance mainly focus on firm fundamentals or5
executive incentives (e.g., Desai and Dharmapala, 2006; Lisowsky, 2010; Armstrong,Blouin and Larcker, 2012; and Rego and Wilson, 2012). Little is known, however,about how stock market conditions, and in particular the liquidity of the firm's stock,affect firm’s tax planning. To the best of our knowledge, our paper is the first todocument the effect of stock liquidity on tax avoidance, thereby establishing animportant link between corporate tax avoidance and firm’s stock market conditions.Second, our paper also contributes to the corporate finance literaturedocumenting beneficial effects of stock liquidity on the value of the firm (e.g., Fang etal., 2009; and Bharath et al., 2013). Our results suggest that greater stock liquiditymitigates both overly-aggressive and overly-conservative tax planning, and thushighlight a potential channel through which greater stock liquidity increases firmvalue.Finally, at a methodological level, our study contributes to the tax avoidanceliterature by further emphasizing the importance of examining the whole distributionof tax avoidance, instead of focusing on the mean effect; an essential point raised byArmstrong et al. (2013).The rest of the paper is organized as follows. In Section II we discuss the relevantliterature and develop our hypotheses. Section III describes the data. Section IVoutlines the methodology. In Sections V to VII, we report and discuss our empiricalfindings. Concluding remarks are presented in Section VIII.6
II. RELATED LITERATURE AND HYPOTHESES DEVELOPMENTCorporate Tax Avoidance and Stock LiquidityWe posit that high liquidity firms engage less in both overly-aggressive andoverly-conservative tax avoidance. Our empirical predictions rest on the premise thattax avoidance is viewed by managers as one of the many investment decisions(Hanlon and Heitzman, 2010; Armstrong et al., 2013), and thus is considered as a partof the overall investment strategy of the firm (McGuire, Omer, and Wilde, 2013).Accordingly, factors that affect firm’s overall investment strategy should also affectfirm’s tax avoidance as shown by McGuire et al. (2013).The above discussion suggests several causative mechanisms through whichstock liquidity may influence corporate tax avoidance. First, greater stock liquiditymay affect tax avoidance through the feedback channel from stock prices to firm’s taxplanning. Prior studies show that greater stock liquidity stimulates the entry ofinformed traders (Grossman and Stiglitz, 1980; Kyle, 1985; and Easley and O’Hara,2004). Informed investors factor the effect of their trades on firm’s investmentdecisions, trade more aggressively, and consequently make stock prices moreinformative to firm’s management (Subrahmanyam and Titman, 2001; Khana andSonti, 2004; Foucault and Gehrig, 2008; Fang et al., 2009). Information uncertaintymay cause managers to misestimate firm’s potential tax savings over the course of taxavoidance investment, thereby resulting in over-or underinvestment in tax avoidance.Thus, by increasing share price informativeness to managers, greater stock liquidity is7
predicted to facilitate better informed tax planning decisions, and therefore willinfluence firm’s tax avoidance.In particular, our empirical predictions are most closely related to the studies byKhana and Sonti (2004), Chen et al. (2007), and Edwards et al. (2013). In Khana andSonti’s (2004) model higher share prices signal improved prospects to firm managersand relax firm’s financial constraint. Informed traders factor this effect of share priceson firm investment decisions and manipulate share prices to get firm to take certaininvestments. Chen et al. (2007) show that the sensitivity of investment to share priceincreases in the amount of private information in stock price, suggesting thatmanagers learn from the private information in stock price about their own firm’sfundamentals (consistent with Khana and Sonti, 2004). Edwards et al. (2013) showthat financially constrained firms resort to a more aggressive tax planning.Integrating these three sets of results, we posit that greater stock liquidity willfacilitate more informed trading to relax the level of financial constraints for the firmswhose tax avoidance strategies are considered by investors as overly-aggressive.Similarly, greater stock liquidity will facilitate more informed trading to tightenfinancial constraints for the firms whose investment in tax planning is perceived byinvestors as overly-conservative. Accordingly, a positive feedback perspectivepredicts that high liquidity firms will engage less in both overly-aggressive andoverly-conservative tax avoidance.Second, a link between stock liquidity and tax avoidance can also be motivatedbased on the corporate governance theories. Separation of ownership and control may8
lead to corporate tax planning that reflects the private interests of the manager. Theresulting agency problems cause managers to engage in overly-aggressive or overlyconservative tax avoidance (e.g., Chen and Chu, 2005; Desai and Dharmapala, 2006;and Kim, Li and Zhang, 2011).Prior research highlights two mechanisms for the beneficial role of stock liquidityin corporate governance. One strand of literature in this vein suggests that stockliquidity enhances blockholders’ incentives to intervene by allowing blockholders toincrease their stakes in the firm at lower cost (Maug, 1998). Another agency-basedcausative mechanism suggests that liquidity improves corporate governance byfacilitating the threat of blockholder exit (Edmans 2009; and Edmans and Manso2011). In these models, strategic dumping of firm shares by blockholders exerts adownward pressure on share price, and thus penalizes management for actions that areconsidered not to be in the best interests of blockholders.Prior studies provide empirical evidence consistent with greater stock liquidityimproving corporate governance (e.g., Bharath et al., 2013; and Edmans et al., 2013).More directly related to our hypothesis is the study by Armstrong et al. (2013) whodocument that corporate governance increases extremely low levels of tax avoidance,and decreases extremely high levels of tax avoidance. Thus, a corporate governanceperspective suggests that high stock liquidity will deter firm management fromengaging in both overly-aggressive and overly-conservative tax avoidance by eitherenhancing blockholder intervention or amplifying the threat of blockholder exit.9
To summarize, both the positive feedback and corporate governance perspectivespredict that high liquidity firms will engage less in both overly-aggressive and overlyconservative tax avoidance. The above discussion leads to our main hypothesis.H1. Ceterisparibus,is positively(negatively)lower(upper)stocktail ofliquiditytax avoidancedistribution.associated with the lower (upper) tail of tax avoidancedistribution.Is There a Positive Feedback Effect?Having established a link between stock liquidity and corporate tax avoidance,our next step is to examine the causative mechanism of this relation. Positivefeedback perspective predicts that the effect of stock liquidity on firm’s investmentdecisions will be stronger for the firms with high levels of business uncertainty(Subrahmanyam and Titman, 2001; Fang et al., 2009). Further, since positivefeedback effect is predicted to relax financial constraints for the firms that engage inoverly-aggressive tax avoidance, the effect of liquidity on the upper tail of taxavoidance is expected to be stronger for the financially constrained firms. On theother hand, since positive feedback effect is predicted to tighten financial constraintsfor the firms that engage in overly-conservative tax avoidance, the effect of liquidityon the lower tail of tax avoidance distribution is predicted to be weaker for the firmsthat already face financial constraints. This discussion leads to the followinghypotheses.H1a: Ceteris paribus, the association between stock liquidity andboth tails of corporate tax avoidance distribution is stronger for thefirms with high levels of business uncertainty.10H1b: Ceteris paribus, the association between stock liquidity andthe upper (lower) tail of tax avoidance distribution is stronger(weaker) for the financially constrained firms.
Is There Blockholder Intervention Effect?The effect of blockholder intervention depends on the balance of power betweenshareholders and managers. Therefore, if the association between stock liquidity andtax avoidance occurs through blockholder intervention channel, the effect of liquidityshould be amplified for the firms with high shareholder rights (Fang et al., 2009; andBharath et al., 2013). This insight leads to the following hypothesis.H1c: Ceteris paribus, the association between stock liquidity andboth tails of corporate tax avoidance distribution is stronger forthe firms with high shareholder rights.Is There Blockholder Exit Effect?The disciplining effect of the threat of exit comes through managers' wealthinvested in firm’s stock. Accordingly, the implications of blockholder exit will bemore severe for managers, whose compensation is highly sensitive to changes in shareprice (Bharath et al., 2013; and Edmans et al. 2013).Thus, blockholder exitperspective predicts that the effect of stock liquidity will be magnified for the firmswith high pay-for-performance sensitivity. This discussion leads to the followinghypothesis.H1d: Ceteris paribus, the association between stock liquidity andboth tails of corporate tax avoidance distribution is stronger for thefirms with high managerial pay-for-performance sensitivity.11
III. SAMPLE SELECTION AND VARIABLESSample SelectionOur main measure of stock liquidity is the relative effective spread, calculatedusing intra-day data from the Trade and Quote database (TAQ). This measure comesfrom Vanderbilt University's Financial Markets Research Centre (hereafter FMRC).3Because TAQ only provides data since 1993, we restrict our sample period to 19932010. We obtain firm financial information from Compustat fundamental annual files.Our initial sample consists of all the firms in Compustat over the sample period of1993-2010. We drop observations without sufficient information for construction ofthe tax avoidance and /or stock liquidity measures, and those with negative pre-taxincome. We winsorize all the variables at both the 1st and 99th percentiles to mitigatethe effect of outliers.VariablesTax AvoidanceIn our analysis we adopt Hanlon and Heitzman’s (2010) broad definition of taxavoidance as the reduction of explicit taxes that reflects all transactions that have anyeffect on firm’s tax liability. Our primary measure of tax avoidance is GAAPeffective tax rate (GETR) which is computed as follows:GETRit 3TXTitPI it(1)We are grateful to Hans Stoll and Christoph Schenzler from Vanderbilt University for providing theeffective spread data.12
where i denotes firm, t denotes year,is firm i’s total tax expenses andis firmi’s pre-tax income. This measure has been extensively adopted by prior research (e.g.,Dyreng, Hanlon and Maydew, 2010; Armstrong et al., 2012; and Cheng et al., 2012).In particular, our choice of GETR as the primary measure of tax avoidance ismotivated by the results of Graham at al.’s (2013) survey, who find that managementat public companies places a higher weight on the GAAP effective tax rates comparedto other tax metrics, such as cash taxes paid. Further, Armstrong et al. (2012)conclude that GETR is a more informative measure of tax director actions, comparedto other tax avoidance metrics. Lower values of GETR indicate more aggressive taxavoidance.Stock LiquidityOur primary measure of stock liquidity (LIQ) is relative effective spread,computed as the ratio of the difference between the trade price and the midpoint of thebid-ask quote over the trade price. The relative effective spread is regarded as one ofthe best measures of stock liquidity and has been extensively used by prior studies(e.g., Fang et al., 2009; and Fang, Tian and Tice, 2013). FMRC computes dailyrelative effective spread for the stock as the trade-weighted average of the relativeeffective spread of all the trades during the day. To obtain the annual relative effectivespread, we take the arithmetic mean of the daily relative effective spreads over thefirm's fiscal year. Since relative effective spread is highly skewed and higher valueindicates lower liquidity, we take the natural logarithm of the ratio to correct for the13
skewness following Fang et al. (2009) and then multiply it by minus one for ease ofinterpretation. Accordingly, higher values of LIQ indicate higher stock liquidity.Control VariablesThe selection of control variables follows prior literature (e.g., Rego, 2003; andDyreng et al., 2010) and captures different aspects of firm operations. We includereturn on assets (ROA) and ROA volatility (STDROA) to control for firm profitabilityand the uncertainty of the firm's operation. PPE assets (PPE) and intangible assets(INTANG) are included to control for the nature of the firm's business. We alsoinclude leverage ratio (LEV), loss carry forward dummy (NOL) and change in losscarry forward (DNOL AT) to capture the debt and non-debt tax shields. Firm size(SIZE) is included to control for “political costs” of tax avoidance (e.g., Rego, 2003).Change in goodwill (POSGDWL) is included to capture the merger and acquisitionactivities of the firm. Equity income in earnings (EQINC) and new investments(NEWINV) are included to control for firm's investment activities. We also includeforeign assets (FRGNAT) to control for the economies of scale in tax planning. Last,we include market-to-book (MB) to control for growth opportunities, cash holdings(CASH) to control for financial conditions, and abnormal accruals (ABACC) to controlfor earnings management. Detailed definitions of all the variables are presented inAppendix A.14
Descriptive StatisticsTable 1 presents the summary statistics of the data. The mean (median) GAAPeffective tax rate (GETR) of our sample firms is 0.296 (0.348) and the mean (median)stock liquidity (LIQ) is 5.763 (5.724). These numbers are well in line with thosereported in prior studies (e.g., Fang et al., 2009; and Dyreng et al., 2010). As far as thecontrol variables are concerned, the mean cash holdings, ROA, and ROA volatilityare 0.186, 0.099, and 0.117, respectively. On average, our sample firms have changein goodwill of 0.021, new investments of 0.085, leverage ratio of 0.172, foreign assetsof 0.44, equity income in earnings of 0.001, and change in loss carry forward of 0.005.These firms also have PPE assets of 33.1% and intangible assets of 13.3% of totalassets. 29% of the firms have loss carry forward and 34% of them have foreignincome. Last, the sample firms have mean firm size of 6.182, mean market-to-book of2.882, and mean abnormal accruals of 0.079.[Insert Table 1 about here]Table 2 presents the correlation matrix of the variables. The table shows thatGETR exhibits weak positive correlation with stock liquidity. GETR is also negativelycorrelated with cash holdings, ROA volatility, loss carry forward dummy, newinvestments, market-to-book, leverage, foreign assets, equity income in earnings,change in loss carry forward, and abnormal accruals; while positively correlated withreturn on assets, PPE assets, change in goodwill, firm size, intangible assets, andforeign income dummy.[Insert Table 2 about here]15
IV. RESEARCH DESIGNAs discussed in Section II, high liquidity firms are predicted to engage less inboth overly-aggressive and overly-conservative tax avoidance. Accordingly, the effectof stock liquidity on tax avoidance is expected to be stronger at the tails while havingpotentially little or no effect on the mean or the median of the tax avoidancedistribution. To test our predictions, we follow Armstrong et al. (2013) by utilizing aquantile regression approach (Koenker and Basset, 1978; Koenker and Hallock, 2001).Below we briefly outline the quantile regression method and discuss its advantagesover the standard regression methods in the context of our research question.Let y be the response variable (in our case, tax avoidance), x be the explanatoryvariable of interest (in our case, stock liquidity), and Z be the vector of controlvariables (including a constant term). Assume that a conditional -th quantile of given values of x and Z,, is given by for(2). The -th quantile coefficients,and, are estimated by solving thefollowing optimization problem̂ ̂where{ }is the so-called check function which weighspositive and negative values asymmetrically, andwhich takes value of 1 if(3)is a dummy variableis negative and 0 otherwise.The key advantage of the quantile regression method is that it allows the effect ofthe variable of interest,to vary across different parts of the distribution of the16
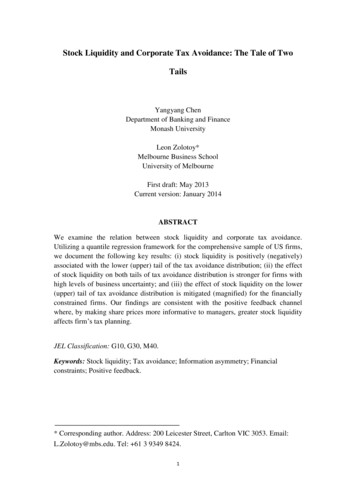
response variable, y. This feature is particularly important in the context of our study,where greater stock liquidity is predicted to have a positive (negative) effect on thelower (upper) tails of the tax avoidance distribution. This effect cannot be captured bythe standard ordinary least squares (OLS) regression method, which focuses solely onthe effect of the variable of interest on the mean of distribution of the responsevariable. In contrast to the standard regression methods, quantile regression isdesigned to characterize changes in both the location and shape of the distribution ofinterest (Armstrong et al., 2013), and thus provides an appealing analytical frameworkfor our analysis. 4V. STOCK LIQUIDITY AND CORPORATE TAX AVOIDANCEUnivariate EvidenceFigure 1 presents the univariate relation between stock liquidity and tax avoidance.The x-axis plots decile ranks of GETR and y-axis plots mean values of stock liquiditylagged one year that correspond to these deciles. The relation between the twovariables exhibits a distinct inverted U-shape, with firms in the centre (tails) of theGETR distribution having higher (lower) stock liquidity. Specifically, the averagerelative effective spreads for the firms in the highest and lowest deciles of GETR are60 and 40 basis points, respectively. In contrast, the relative effective spread for thefirms in the 5-th decile of GETR is only 25 basis points. The difference is also4This important point is emphasized by Mosteller and Tukey (1977, p.266), who note that“.regression often gives a rather incomplete picture. Just as the mean gives an incomplete picture of asingle distribution, so the regression curve gives a corresponding incomplete picture for a set ofdistributions”17
statistically significant. These results support H1, which predicts that high liquidityfirms will engage less in both overly-aggressive and overly-conservative taxavoidance.[Insert Figure 1 about here]Multivariate EvidenceTurning to our multivariate tests, we estimate a quantile regression with thebaseline model specification as followsGETRit 0 1 LIQit 1 2 CASH it 1 3 ROAit 1 4 STDROAit 1 5 PPE it 1 6 POSGDWLit 1 7 SIZEit 1 8 NOLit 1 9 NEWINVit 1 10 LEVit 1 11INTANGit 1 12 FRGNATit 1 13 EQINCit 1(4) 14 DNOLATit 1 15 DFI it 1 16 ABACC it 1 YRt INDi itwhere i denotes firm, t denotes year, and ε is the error term. GETR is GAAP effectivetax rate and LIQ is stock liquidity measured by negative log relative effective spread.IND is the industry fixed effects based on two-digit SIC codes and YR is the yearfixed effects. All the independent variables are lagged one year to mitigate potentialendogeneity concerns following Fang et al. (2009). We estimate our baseline modelseparately for the 10-th, 50-th (median) and 90-th GETR percentiles.We present the regression results in Columns (1) - (3) of Table 3. The coefficientfor stock liquidity is positive and statistically significant for the 10-th GETRpercentile (z-statistic 6.26, p-value 0.01, two-tail) and is negative and statisticallysignificant for the 90-th GETR percentile (z-statistic -7.94, p-value 0.01, two-tail).These results suggest that stock liquidity is negatively associated with both overlyaggressive and overly-conservative tax avoidance, thereby providing support for H1.18
The coefficient for stock liquidity for the median GETR is positive and statisticallysignificant (z-statistic 3.98, p-value 0.01, two tail)5.To facilitate economic interpretation of our results, we rank stock liquidity foreach year, and then partition the resulting ranks into deciles labelled from 1 (lowestdecile) to 10 (highest decile). Next, we estimate our baseline quantile regressions withthe decile ranking of stock liquidity and present the results in Columns (4) - (6) ofTable 3. The results further confirm the positive (negative) relation between the 10-th(90-th) percentile of GETR and stock liquidity. Further, the coefficient for stockliquidity in Column (4) suggests that moving from the lower to the upper decile ofstock liquidity increases 10-th percentile of GETR by 0.011*(10-1) 0.099, or 9.9%of pre-tax income. The coefficient for stock liquidity reported in Column (6) suggeststhat moving from the lower to the upper decile of stock liquidity decreases 90-
more informative to managers and allowing firm management to make better investment decisions, a so-called "positive feedback" effect (Fang, Noe, and Tice, 2009).2 High stock liquidity may also improve firm's investment decisions through the corporate governance channel. For instance, Maug (1998) shows that stock liquidity