Transcription
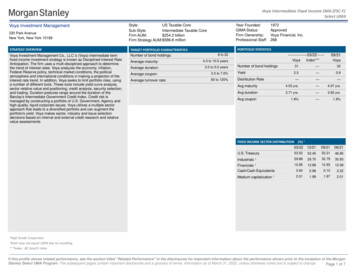
Voya Intermediate Fixed Income SMA (FSC-F)Select UMAVoya Investment Management230 Park AvenueNew York, New York 10169US Taxable CoreStyle:Sub-Style:Intermediate Taxable Core 254.2 billionFirm AUM:Firm Strategy AUM: 586.8 millionSTRATEGY OVERVIEWTARGET PORTFOLIO CHARACTERISTICSVoya Investment Management Co., LLC.'s (Voya) intermediate termfixed income investment strategy is known as Disciplined Interest RateAnticipation. The firm uses a multi-disciplined approach to determinethe trend of interest rates. Voya analyzes the economy, inflation,Federal Reserve policy, technical market conditions, the politicalatmosphere and international conditions in making a projection of theinterest rate trend. In addition, Voya seeks to limit portfolio risks, usinga number of different tools. These tools include yield curve analysis,sector relative value and positioning, credit analysis, security selection,and trading. Duration postures range around the duration of theBarclay's Intermediate Government Credit Index. Credit risk ismanaged by constructing a portfolio of U.S. Government, Agency andhigh quality, liquid corporate issues. Voya utilizes a multiple sectorapproach that leads to a diversified portfolio and can augment theportfolio's yield. Voya makes sector, industry and issue selectiondecisions based on internal and external credit research and relativevalue assessments.Number of bond holdings:Year Founded:GIMA Status:Firm Ownership:Professional-Staff:1972ApprovedVoya Financial, Inc.268PORTFOLIO STATISTICS8 to 22Average maturity:4.0 to 10.0 yearsAverage duration:2.0 to 5.0 *09/21VoyaNumber of bond holdings31—322.5—0.9———Avg maturity4.03 yrs.—4.07 yrs.Avg duration3.71 yrs.—3.83 yrs.1.8%—1.8%Average coupon:3.0 to 7.0%YieldAverage turnover rate:60 to 120%Distribution RateAvg couponFIXED INCOME SECTOR DISTRIBUTION(%) 03/2212/2109/2106/21U.S. Treasury53.5252.4552.2146.85Industrials ¹29.8829.7032.7935.83Financials ¹Cash/Cash ium capitalization ¹2.011.991.972.01¹High Grade Corporates Total may not equal 100% due to rounding.***Index : BC Gov/Cr IntmIf this profile shows related performance, see the section titled "Related Performance" in the disclosures for important information about the performance shown prior to the inception of the MorganStanley Select UMA Program. The subsequent pages contain important disclosures and a glossary of terms. Information as of March 31, 2022, unless otherwise noted and is subject to change.Page 1 of 7
Voya Intermediate Fixed Income SMA (FSC-F)Select UMAMANAGER'S INVESTMENT PROCESSRISK CONSIDERATIONS Intermediate-term maturities emphasized Analyze yield curve and sector relationships Fundamental credit analysis Focus on major interest rate trends Shift maturities in anticipation of interest rate trendsInvesting in securities entails risks, including: Fixed Incomesecurities may be sensitive to changes in prevailing interestrates. When rates rise the value generally declines. There isno assurance that the private guarantors or insurers will meettheir obligations. U.S. Treasuries are guaranteed by the U.S.government and, if held to maturity, offer a fixed rate of returnand fixed principal value. Growth investing does not guaranteea profit or eliminate risk. The stocks of these companies canhave relatively high valuations. Because of these highvaluations, an investment in a growth stock can be more riskythan an investment in a company with more modest growthexpectations. Value investing does not guarantee a profit oreliminate risk. Not all companies whose stocks are consideredto be value stocks are able to turn their business around orsuccessfully employ corrective strategies which would result instock prices that do not rise as initially expected. Bonds ratedbelow investment grade may have speculative characteristicsand present significant risks beyond those of other securities,including greater credit risk and price volatility in the secondarymarket. Investors should be careful to consider these risksalongside their individual circumstances, objectives and risktolerance before investing in high-yield bonds. If a strategyexpects to hold a concentrated portfolio of a limited number ofsecurities, it should be noted that a decline in the value ofthese investments would cause the portfolio’s overall value todecline to a greater degree than that of a less concentratedportfolio.PORTFOLIO'S MATURITY STRUCTURE (%) 03/2212/2109/2106/210 to 2 Years23.9222.7524.8125.092 to 4 Years27.8424.5821.7221.904 to 6 Years25.6730.6833.7834.826 to 8 Years17.6817.9416.9016.138 to 12 Years4.894.052.792.0612 to 17 Years0.000.000.000.00Over 17 Years0.000.000.000.00Cash/Cash Equivalents0.000.000.000.00PORTFOLIO'S CREDIT QUALITY STRUCTURE (%) *Investment 814.99AAAAABelow Investment GradeBB0.000.000.000.00B0.000.000.000.00Below B0.000.000.000.00Not Rated0.000.000.000.00Cash/Cash Equivalents3.642.980.102.32¹High Grade Corporates Total may not equal 100% due to rounding.***Index : BC Gov/Cr IntmIf this profile shows related performance, see the section titled "Related Performance" in the disclosures for important information about the performance shown prior to the inception of the MorganStanley Select UMA Program. The subsequent pages contain important disclosures and a glossary of terms. Information as of March 31, 2022, unless otherwise noted and is subject to change.Page 2 of 7
Voya Intermediate Fixed Income SMA (FSC-F)Select UMARISK/RETURN ANALYSIS - 5 YEARS ENDING 03/31/22AVERAGE ANNUAL TOTAL RETURN (%) - PERIODS ENDING 03/31/22RateRateofofReturnsReturnsStandard Deviation (%)Voya (Gross)Voya (Net)BC Gov/Cr Intm90-Day T-BillsSTDROR3.143.123.380.461.45-0.851.811.09RISK VOLATALITY (%)INVESTMENT RESULTSVoya (Gross)Voya (Net)BC Gov/Cr LIO'S QUARTERLY RETURNS 2ofReturnsQuarter1Quarter2Quarter3Gross Net Gross Net Gross NetQuarter4Gross 41-0.720.46-0.300.04-0.250.74-0.12-0.60Select 210 Year - Ending 03/31/222021 Annual Std. -4.04-0.602.666.806.44-1.441.852.83PORTFOLIO'S RISK STATISTICS - “ PERIODS ENDING03/31/22 ¹ ²3 Year5 YearStandard DeviationStandard Deviation of PrimaryBenchmarkSharpe RatioSharpe Ratio of PrimaryBenchmarkAlphaBetaDownside RiskR-SquaredTracking ErrorInformation *01/01/22-03/31/22Number OfVoya (Gross)Voya (Net)BC Gov/Cr IntmAnnual Rates of Return (%)20152016201720182012Up Qtrs.Down Qtrs.146915115PORTFOLIO DIVERSIFICATION - R²(INCEPTION THROUGH 12/14) Voya vs. BC Gov/Cr Intm Statistics are calculated using gross of fee performance only.R²0.921. Statistics are calculated using gross of feeperformance only.2. BC Gov/Cr Intm was used as the primarybenchmark and the 90-Day T-Bills Index as therisk-free benchmark.See important notes and disclosures pages for a discussion of the sources of the performance data used to calculate the performance results and related analyses shown above.If this profile shows related performance, see the section titled "Related Performance" in the disclosures for important information about the performance shown prior to the inception of the MorganStanley Select UMA Program. The subsequent pages contain important disclosures and a glossary of terms. Information as of March 31, 2022, unless otherwise noted and is subject to change.Page 3 of 7
Voya Intermediate Fixed Income SMA (FSC-F)Select UMACOMPOSITE DISCLOSURESThe disclosures provided below apply to performance information in this profile, if any. Pastperformance is not a guarantee of future results. Actual individual account results may differfrom the performance shown in this profile. There is no guarantee that this investment strategywill achieve its intended results under all market conditions. Do not rely upon this profile as thesole basis for your investment decisions.Performance results in this profile are calculated assuming reinvestment of dividends and income.Returns for more than one calendar year are annualized and based on quarterly data. Returns forperiods of less than a calendar year show the total return for the period and are not annualized. Norepresentation is being made that any portfolio will or is likely to achieve profits or losses similar tothose shown. Returns will fluctuate and an investment upon redemption may be worth more or lessthan its original value. Performance shown does not reflect the impact of fees and expenses of theunderlying mutual fund and ETFs, as applicable.Sources of Performance Results and Other Data: The performance data and certain otherinformation for this strategy (including the data on page 1 of this profile) may include one or more ofthe following: (i) the performance results of a composite of Morgan Stanley accounts managed by thethird party investment manager, (ii) the performance results for accounts and investment productsmanaged by the third party investment manager, in the same or a substantially similar investmentstrategy outside of the applicable Morgan Stanley program, and/or (iii) in the case of Model PortfolioStrategies, the Model Portfolio Provider’s results in managing accounts outside of the Morgan StanleySelect UMA program prior to Model Portfolio Strategy’s inception in the Morgan Stanley Select UMAprogram . For periods through June 2012, the Fiduciary Services program operated through twochannels – the Morgan Stanley channel and the Smith Barney channel and any performance andother data relating to Fiduciary Services accounts shown here for these periods is calculated usingaccounts in only one of these channels.) Please note that the Fiduciary Services program was closedon January 2, 2018. Although the Fiduciary Services and Select UMA programs are both MorganStanley managed account programs, the performance results and other features of similar investmentstrategies in the two programs may differ due to investment and operational differences. Performancein one program is not indicative of potential performance in the other. For example, the individualinvestment strategies in Select UMA program accounts may contain fewer securities, which would leadto a more concentrated portfolio. The automatic rebalancing, wash sale loss and tax harvestingfeatures of the Select UMA program, which are not available in Fiduciary Services, also could causedifferences in performance. In addition, any performance results included in this profile that are basedon a third party investment manager’s accounts that are not part of the Morgan Stanley programaccounts or institutional accounts that are part of the Model Portfolio strategy may differ due toinvestment and operational differences as well. As such, performance results of the third partyinvestment manager's composites and the third party Model Portfolio Strategies may differ from thoseof Select UMA accounts managed in the same or a substantially similar investment strategy. Forexample, in the case of Model Portfolio Strategies, Morgan Stanley, as the investment manager, maydeviate from the Third Party Model Portfolios.Voya Investment Management Co., LLC.'s (Voya) intermediate term fixed income performancerepresents a composite that is size-weighted and includes approximately 106 Morgan StanleyFiduciary Services Voya Intermediate Fixed Income SMA separately managed account client portfoliostotaling 17.9 million as of 03/31/22. Composite dispersion measures the consistency of the firm'scomposite performance results with respect to the individual portfolio returns within a composite. It isan asset-weighted standard deviation calculation. The dispersion for this composite for 03/31/22 is0.11.Morgan Stanley Performance:The composite consists of 106 account(s) with a market value of 17.9 million as of 03/31/2022. Inthis profile, the performance from January 1, 2011 through June 30, 2012 consists of accountsmanaged by the investment manager in this strategy in either the Morgan Stanley or the Smith Barneyform of the Fiduciary Services program. From July 1, 2012 through December 31, 2015, performanceconsists of all Fiduciary Services (FS) accounts managed by the investment manager in this strategy,subject to any other limitations stated in this profile. From January 1, 2016, performance consists ofthe performance of all FS accounts (as described in the previous sentence) as well as theperformance of all single style Select UMA accounts managed by the investment manager in thisstrategy, subject to any other limitations stated in this profile. Performance composites calculated byMorgan Stanley include all fee-paying portfolios with no investment restrictions. New accounts areincluded beginning with the second full calendar month of performance. Terminated accounts areremoved in the month in which they terminate (but prior performance of terminated accounts isretained). Performance is calculated on a total return basis and by asset weighting the individualportfolio returns using the beginning of period values.Fixed Income Account (Gross): Voya’s gross results do not reflect a deduction of the investmentadvisory fees charged by Voya, or program fees, if any, but are net of commissions charged onsecurities transactions.Net Performance for all Periods: Net performance results reflect a deduction of 0.5725% quarterly.This consists of three components: 0.5% maximum quarterly MS Advisory Fee and 0.0175% maximumquarterly Program Overlay Fee (which, together cover the services provided by Morgan Stanley), plus0.055% quarterly SMA Manager Fees (being the fee currently charged by Voya to new clients formanaging their assets in the Select UMA program). The SMA Manager Fees may differ from managerto manager, and managers may change their fee to new clients from time to time. If you select thismanager for your account, check the SMA Manager Fees specified in the written client agreement, incase these have changed since you received this profile. Historical net fees reflect the Advisory FeeSchedule as of October 1, 2018. Morgan Stanley program fees are calculated quarterly for theperformance illustrated in this profile, and have a compounding effect on performance. The MorganStanley program fee, which differs among programs and clients, is described in the applicable MorganStanley ADV brochure, which is available at www.morganstanley.com/ADV or on request from yourFinancial Advisor or Private Wealth Advisor. Document approval date February 2013.Focus List, Approved List, and Watch Status:Related Performance:If this profile shows related performance, see the section titled "Related Performance" in the disclosures for important information about the performance shown prior to the inception of the MorganStanley Select UMA Program. The subsequent pages contain important disclosures and a glossary of terms. Information as of March 31, 2022, unless otherwise noted and is subject to change.Page 4 of 7
Voya Intermediate Fixed Income SMA (FSC-F)Select UMAGlobal Investment Manager Analysis ("GIMA") uses two methods to evaluate investment products inapplicable advisory programs. In general, strategies that have passed a more thorough evaluation maybe placed on the "Focus List", while strategies that have passed through a different and lesscomprehensive evaluation process may be placed on the "Approved List". Sometimes an investmentproduct may be evaluated using the Focus List process but then placed on the Approved List insteadof the Focus List.Investment products may move from the Focus List to the Approved List, or vice versa. GIMA may alsodetermine that an investment product no longer meets the criteria under either evaluation process andwill no longer be recommended in investment advisory programs (in which case the investmentproduct is given a "Not Approved" status).GIMA has a "Watch" policy and may describe a Focus List or Approved List investment product asbeing on "Watch" if GIMA identifies specific areas that (a) merit further evaluation by GIMA and (b)may, but are not certain to, result in the investment product becoming "Not Approved". The Watchperiod depends on the length of time needed for GIMA to conduct its evaluation and for the investmentmanager to address any concerns. GIMA may, but is not obligated to, note the Watch status in thisreport with a "W" or "Watch" on the cover page.For more information on the Focus List, Approved List, and Watch processes, please see theapplicable Morgan Stanley ADV brochure (www.ms.com/adv). Your Financial Advisor or Private WealthAdvisor can provide on request a copy of a paper entitled "GIMA: At A Glance ".ADDITIONAL DISCLOSURESActual account holdings, performance and other data will vary depending on the size of an account,cash flows within an account, and restrictions on an account. Holdings are subject to change daily. Theinformation in this profile is not a recommendation to buy, hold or sell securities.Actual portfolio statistics may vary from target portfolio characteristics.The Top Five Portfolio Holdings listed herein are provided for informational purposes only and shouldnot be deemed to be a recommendation to purchase or sell the securities mentioned. Portfoliocharacteristics in this profile are based on an allocation weight in the strategy model. There are noguarantees that any of the securities mentioned will be held in a client’s account. It should not beassumed that the securities transactions or holdings discussed were or will prove to be profitable.The Model Portfolio Provider or Investment Manager may use the same or substantially similarinvestment strategies, and may hold similar portfolios of investments, in other portfolios or products itmanages (including mutual funds). These may be available at Morgan Stanley or elsewhere, and maycost an investor more or less than this strategy in Morgan Stanley's Select UMA program.Overlay Managers or Executing Sub-Managers in some of Morgan Stanley’s Separately ManagedAccount programs may affect transactions through broker-dealers other than Morgan Stanley or ouraffiliates. If your manager trades with another firm, you may be assessed costs by the other firm inaddition to Morgan Stanley’s fees. Those costs will be included in the net price of the security, notseparately reported on trade confirmations or account statements. Certain managers have historicallydirected most, if not all, of their trades to outside firms. Information provided by managers concerningtrade execution away from Morgan Stanley is summarized s/pdfs/adv/sotresponse.pdf. For more informationon trading and costs, please refer to the ADV Brochure for your program(s), available atwww.morganstanley.com/ADV, or contact your Financial Advisor/Private Wealth Advisor.The portfolio may, at times, invest in exchange-traded funds (ETFs), which are a form of equitysecurity in seeking to maintain continued full exposure to the broad equity market.Morgan Stanley investment advisory programs may require a minimum asset level and, depending onyour specific investment objectives and financial position, may not be suitable for you. Investmentadvisory program accounts are opened pursuant to a written client agreement.Consulting Group’s unified managed account program, Select UMA, allows Financial Advisors tocombine separately managed accounts (SMAs), mutual funds and exchange-traded funds (ETFs)within a single investment advisory account for clients.Certain strategies managed or sub-advised by us or our affiliates, including but not limited to MorganStanley Investment Management and Eaton Vance Management and its investment affiliates, may beincluded in your account. Morgan Stanley Global Investment Manager Analysis evaluates certaininvestment products for the purposes of some – but not all – of Morgan Stanley Smith Barney LLC’sinvestment advisory programs. Please contact your Morgan Stanley team and/or see the applicableForm ADV, which can be accessed at www.morganstanley.com/adv, for information about affiliatedinvestment products that are not reviewed or evaluated by GIMA, as well as additional disclosuresapplicable to affiliated products, that could be included in this strategy.Diversification does not guarantee a profit or protect against a loss.No obligation to notifyMorgan Stanley has no obligation to notify you when information in this profile changes.Sources of informationMaterial in this profile has been obtained from sources that we believe to be reliable, but we do notguarantee its accuracy, completeness or timeliness. Third party data providers make no warranties orrepresentations relating to the accuracy, completeness or timeliness of the data they provide and arenot liable for any damages relating to this data.No tax adviceMorgan Stanley and its affiliates do not render advice on legal, tax and/or tax accounting matters toclients. Each client should consult his/her personal tax and/or legal advisor to learn about any potentialtax or other implications that may result from acting on a particular recommendation.Not an ERISA fiduciaryMorgan Stanley is not acting as a fiduciary under either the Employee Retirement Income Security Actof 1974, as amended, or under section 4975 of the Internal Revenue Code of 1986, as amended, inproviding the information in this profile. 2019 Morgan Stanley Smith Barney LLC Member SIPC.INDEX DESCRIPTIONSIf this profile shows related performance, see the section titled "Related Performance" in the disclosures for important information about the performance shown prior to the inception of the MorganStanley Select UMA Program. The subsequent pages contain important disclosures and a glossary of terms. Information as of March 31, 2022, unless otherwise noted and is subject to change.Page 5 of 7
Voya Intermediate Fixed Income SMA (FSC-F)Select UMA90-Day T-BillsThe 90-Day Treasury Bill is a short-term obligation issued by the United States government. T-bills arepurchased at a discount to the full face value, and the investor receives the full value when theymature. The difference of discount is the interested earned. T-bills are issued in denominations of 10,000 auction and 1,000 increments thereafter.BC Gov/Cr IntmThe Barclays Government/Credit Bond Index contains bonds that are investment grade and that haveat least one year to maturity. The Barclays Intermediate Government/Credit Bond Index is composedprimarily of bonds covered by the Barclays Government/Credit Bond Index with maturities betweenone and 9.99 years.Dividend a portion of a company's profit paid to common and preferred shareholders.Dividend Yield annual dividend per share divided by price per share. Dividend Yield for the portfolio isa weighted average of the results for the individual stocks in the portfolio.Downside Risk is a measure of the risk associated with achieving a specific target return. Thisstatistic separates portfolio volatility into downside risk and upside uncertainty. The downsideconsiders all returns below the target return, while the upside considers all returns equal to or abovethe target return.Duration is a measure of price sensitivity expressed in years.S&P 500High Grade Corporate Bonds corporate bonds from issuers with credit ratings of AA or AAA.The S&P 500 Total Return has been widely regarded as the best single gauge of the large cap U.S.equities market since the index was first published in 1957. The index has over 5.58 trillionbenchmarked, with index assets comprising approximately 1.31 trillion of this total. The indexincludes 500 leading companies in leading industries of the U.S. economy, capturing 75% coverage ofU.S. equities. This index includes dividend reinvestment.Information Ratio is a measure of the investment manager's skill to add active value against a givenbenchmark relative to how stable that active return has been. Essentially, the information ratio explainshow significant a manager's alpha is. Therefore, the higher the information ratio, the more significantthe alpha.Indices are unmanaged and have no expenses. You cannot invest directly in an index.GLOSSARY OF TERMSAlpha is a mathematical estimate of risk-adjusted return expected from a portfolio above and beyondthe benchmark return at any point in time.American Depositary Receipts (ADRs) are receipts for shares of a foreign-based corporation held inthe vault of a U.S. bank.Average Portfolio Beta is a measure of the sensitivity of a benchmark or portfolio's rates of return tochanges against a market return. The market return is the S&P 500 Index. It is the coefficientmeasuring a stock or a portfolio's relative volatility.Beta is a measure of the sensitivity of a portfolio's rates of return to changes in the market return. It isthe coefficient measuring a stock or a portfolio's relative volatility.Bottom-Up Stock Selection Emphasis primarily on individual stock selection. Considerations ofeconomic and industry factors are of secondary importance in the investment decision-makingprocess.Capitalization is defined as the following: Mega (Above 100 billion), Large ( 12 to 100 billion),Medium ( 2.5 - 12 billion), Small ( .50 - 2.5 billion) and Micro (below .50 billion).Distribution Rate is defined as the most recent distribution paid, annualized, and then divided by thecurrent market price. Distribution rate may consist of investment income, short-term capital gains,long-term capital gains, and /or returns of capital.Investment Grade Bonds are those rated by Standard & Poor's AAA (highest rated), AA, A or BBB (orequivalent rating by other rating agencies or, in the case of securities not rated, by the investmentmanager).Price/Book Ratio (P/B) weighted average of the stocks' price divided by book value per share. Bookvalue per share is defined as common equity, including intangibles, divided by shares outstandingtimes the adjustment factor.Price/Cash Flow Ratio a ratio used to compare a company's market value to its cash flow. It iscalculated by dividing the company's market cap by the company' operating cash flow in the mostrecent fiscal year (or the most recent four fiscal quarters); or, equivalently, divide the per-share stockprice by the per-share operating cash flow.Price/Earnings Ratio (P/E Ratio) shows the multiple of earnings at which a stock sells. Determinedby dividing current stock price by current earnings per share (adjusted for stock splits). Earnings pershare for the P/E ratio are determined by dividing earnings for past 12 months by the number ofcommon shares outstanding. The P/E ratio shown here is calculated by the harmonic mean.Price/Sales Ratio determined by dividing current stock price by revenue per share (adjusted for stocksplits). Revenue per share for the P/S ratio is determined by dividing revenue for past 12 months bynumber of shares outstanding.R2 (R-Squared)/Portfolio Diversification indicates the proportion of a security's total variance that isbenchmark-related or is explained by variations in the benchmark.Sharpe Ratio measures the efficiency, or excess return per unit of volatility, of a manager's returns. Itevaluates managers' performance on a volatility-adjusted basis.If this profile shows related performance, see the section titled "Related Performance" in the disclosures for important information about the performance shown prior to the inception of the MorganStanley Select UMA Program. The subsequent pages contain important disclosures and a glossary of terms. Information as of March 31, 2022, unless otherwise noted and is subject to change.Page 6 of 7
Voya Intermediate Fixed Income SMA (FSC-F)Select UMAStandard Deviation is a statistical measure of historical variability or spread of returns around amathematical average return that was produced by the investment manager over a givenmeasurement period. The higher the standard deviation, the greater the variability in the investmentmanager's returns relative to its average return.Top-Down/Economic Analysis Emphasis primarily on macroeconomic trends as opposed tobottom-up stock selection.Tracking Error represents the standard deviation of the difference between the performance of theinvestment strategy and the benchmark. This provides a historical measure of the variability of theinvestment strategy's returns relative to its benchmark.U.S. Treasury Bonds a marketable, fixed interest U.S. government debt security with a maturity ofmore than 10 years. Treasury bonds make interest payments semi-annually and the income thatholders receive is only taxed at the federal level.Volatility a measure of risk based on the standard deviation of the asset return. Volatility is a variablethat appears in option pricing formulas, where it denotes the volatility of the underlying asset returnfrom now to the expiration of the option. There are volatility indexes. Such as a scale of 1-9; a higherrating means higher risk.If this profile shows related performance, see the section titled "Related Performance" in the disclosures for important information about the performance shown prior to the inception of the MorganStanley Select UMA Program. The subsequent pages contain important disclosures and a glossary of terms. Information as of March 31, 2022, unless otherwise noted and is subject to change.Page 7 of 7
Voya Investment Management PORTFOLIO STATISTICS Voya Index*** Voya -----12/21-----fixed income investment strategy is known as Disciplined Interest Rate 06/21 Number of bond holdings 30 — 32 Yield 1.2 — 0.8 . If this profile shows related performance, see the section titled "Related Performance" in the disclosures for important .