Transcription
Exploring Dependency based Probabilistic Supply Chain Risk Measures for PrioritisingInterdependent Risks and StrategiesAbroon Qazia*, John Quigleya, Alex Dicksonb, Sule Onsel Ekicicabroon.qazi@strath.ac.uk; j.quigley@strath.ac.uk; alex.dickson@strath.ac.uk; sonsel@dogus.edu.traManagement Science Department, Strathclyde Business School, 199 Cathedral Street, Glasgow,Scotland, G4 0QU, United KingdombEconomics Department, Strathclyde Business School, 130 Rottenrow, Glasgow, Scotland, G4 0GE,United KingdomcIndustrial Engineering Department, Dogus University, Acibadem Zeamet Sok, 34722 Istanbul, Turkey*Corresponding author. Tel: 44 7435682387; fax: 44 141 552 6686
AbstractIn this paper, we introduce an integrated supply chain risk management process that is grounded in thetheoretical framework of Bayesian Belief Networks capturing interdependency between risks and riskmitigation strategies, and integrating all stages of the risk management process. The proposed process isunique in four different ways: instead of mapping the supply network, it makes use of Failure Modesand Effects Analysis to model the risk network which is feasible for modelling global supply chains; it isdriven by new dependency based risk measures that can effectively capture the network wide impact ofrisks for prioritisation; it utilises the concept of Shapley value from the field of cooperative game theoryto determine a fair allocation of resources to the critical risks identified; and the process helps inprioritising potential risk mitigation strategies (both preventive and reactive) subject to budget andresource constraints. We demonstrate its application through a simulation study.KeywordsSupply chain risk management; Bayesian Belief Networks; Failure Modes and Effects Analysis; riskmeasures; risk mitigation strategies1.IntroductionSupply chains have become more complex due to the globalisation and outsourcing in manufacturingindustries. Global sourcing and lean operations are the main drivers of supply chain disruptions (Son &Orchard, 2013). In addition to the network configuration based complexity, non-linear interactionsbetween complex chains of risks categorised as ‘systemicity’ of risks (Ackermann, Howick, Quigley,Walls, & Houghton, 2014) make it a daunting task to understand and manage these dynamics. Supplychain risk management (SCRM) is an active area of research that deals with the overall management ofrisks ranging across the entire spectrum of the supply chain including external risk factors. Besides anincrease in the frequency of disruptions, supply chains are more susceptible because of the increasinginterdependency between supply chain actors and substantial impact of cascading events.Supply chain risks can be viewed with respect to three broad perspectives: a ‘butterfly’ concept thatsegregates the causes, risk events and the ultimate impact; the categorisation of risks with respect tothe resulting impact in terms of delays and disruptions; and the network based classification in terms oflocal-and-global causes and local-and-global effects (Sodhi & Tang, 2012). According to Manuj andMentzer (2008b, p. 205), “Global SCRM is the identification and evaluation of risks and consequentlosses in the global supply chain, and implementation of appropriate strategies through a coordinatedapproach among supply chain members with the objective of reducing one or more of the following –losses, probability, speed of event, speed of losses, the time for detection of the events, frequency, orexposure – for supply chain outcomes that in turn lead to close matching of actual cost savings andprofitability with those desired”.
Risk management comprises different stages including risk identification, risk analysis, risk evaluation,risk treatment and risk monitoring (SA, 2009). A number of risk management frameworks have beenproposed for managing supply chain risks (Chopra & Sodhi, 2004; Knemeyer, Zinn, & Eroglu, 2009;Manuj & Mentzer, 2008a; Sinha, Whitman, & Malzahn, 2004; Trkman & McCormack, 2009; Tummala &Schoenherr, 2011), however, there are two main limitations about these studies. The first and mostsignificant limitation of these frameworks is their consideration of risks as independent factors.Classification of risks has been explored comprehensively resulting in identification of independentcategories of risks for aiding the risk identification stage of SCRM process (Bogataj & Bogataj, 2007;Chopra & Sodhi, 2004; Jüttner, Peck, & Christopher, 2003; Kleindorfer & Saad, 2005; Manuj & Mentzer,2008a; Oke & Gopalakrishnan, 2009; Tang & Tomlin, 2008). However, risk identification must involvedifferent stakeholders and capture the interdependent interaction between risks across differentdomains of the stakeholders (Ackermann et al., 2014; Badurdeen et al., 2014). Studies focussing oninterdependency between risks generally follow the process flow of the supply chain (Garvey,Carnovale, & Yeniyurt, 2015; Leerojanaprapa, van der Meer, & Walls, 2013) which is not feasible whenconsidering substantial supply chain networks.The second limitation of the analysed frameworks relates to their main focus on the risk identificationand risk analysis stages whereas risk treatment has not been explored in detail (Colicchia & Strozzi,2012). Furthermore, limited studies have assessed risks within an interdependent setting and to thebest of the authors’ knowledge, only Garvey et al. (2015) have introduced probabilistic risk measures forinterdependent supply chain risks and there is no study that explores interdependency between risksand risk mitigation strategies within a probabilistic network setting. These gaps that are found in theliterature have led to the main research question that drives this research which is: How can we design aSCRM process capturing systemic interactions between risks and mitigation strategies across theintegrated stages of risk identification, risk analysis, risk evaluation and risk treatment; andsubsequently, how can the potential mitigation strategies be evaluated within the network ofinterdependent risks and strategies in relation to different resource and budget constraints? Thisresearch paper is a first step towards bridging this significant research gap. It attempts to propose riskmeasures and a process that can help researchers and practitioners appreciate the importance ofcapturing interdependency between risks and strategies across different stages of risk managementprocess and develop better models for managing supply chain risks.We achieve this by introducing a method of managing supply chain risks within a network setting ofinteracting risks, risk sources and mitigation strategies that is grounded in the theoretical framework ofBayesian Belief Networks (BBNs). For risk identification, we utilise the key feature of Failure Modes andEffects Analysis (FMEA) in identifying supply chain risks, associated sources and potential mitigationstrategies. For risk assessment, we introduce dependency based probabilistic risk measures for
identifying the relative importance of each risk within the network of interacting risks. For risktreatment, we consider two scenarios: if the strategies and associated cost are not explicitly evaluated,we make use of Shapley value (Shapley, 1953) from the field of cooperative game theory in order toaddress the problem of allocating a fair amount of the budget to the critical risks identified through themeasures; if the strategies with associated cost are already identified within the network, we focus onoptimising strategies in relation to resource and budget constraints. We demonstrate the use ofproposed process through a simulation study that is based on the case study of Tuncel and Alpan (2010).The remainder of the paper is organised as follows: An overview of FMEA and BBNs is presented insection 2. Section 3 provides a brief review of the relevant literature. The proposed risk measures,propositions and the Shapley value based method are described in section 4. The proposed process ispresented in section 5. The application of the proposed process is demonstrated through a simulationstudy in section 6. Finally, we conclude our paper with important findings and present future researchthemes in section 7.2.FMEA and BBNs2.1FMEAFMEA or Failure Modes, Effects and Criticality Analysis (FMECA) is a systematic approach of identifyingdifferent modes of failure and evaluating associated risks during the development stage of a product orservice. It is known to have been implemented in 1963 for projects at NASA and later, the Ford MotorCompany utilised the technique in 1977 (Gilchrist, 1993). The typical process involves: identification offailure modes, associated causes and resulting consequences; assigning the values of occurrence (O),severity (S) and detection (D) to each failure mode on an ordinal scale of 1-10 for each linguisticvariable; calculating the Risk Priority Number (RPN) of each failure mode which is the product of threenumbers identified previously; ranking the failure modes and planning actions on high ranking modes;and finally reviewing the effectiveness of implemented actions and revising the risk measures.There are some major shortcomings of using RPN as a measure of prioritising risks (Gilchrist, 1993;Nepal & Yadav, 2015). The elicited value relative to each ordinal scale is quite subjective andfurthermore, a risk having a high value of severity (O 6, S 10, D 6) might still score lower (RPN 360) incomparison with a risk (O 6, S 8, D 8) that might be less critical (RPN 384). Therefore, the calculationof RPN as a product of three numbers does not justify the rationale. In this study, we propose using thefeatures of FMEA in identifying important risks and associated risk sources but instead of using theordinal scales for occurrence and severity, we utilise the values of probability and losses resulting fromrealisation of risks. We also establish interdependency between identified risks and risk sources thathelps in overcoming the notion of independent risks inherent in the conventional scheme of FMEA.
2.2BBNsBBNs are a framework for modelling uncertainty. BBNs have their background in statistics and artificialintelligence and were first introduced in the 1980s for dealing with uncertainty in knowledge-basedsystems (Sigurdsson, Walls, & Quigley, 2001). They have been successfully used in addressing problemsrelated to a number of diverse specialties including reliability modelling, medical diagnosis, geographicalinformation systems, and aviation safety management. For understanding the mechanics and modellingof BBNs, interested readers may consult Jensen and Nielsen (2007), and Kjaerulff and Anders (2008). Weconsider BBNs as the best choice of modelling technique in our situation as it facilitates capturinginterdependency between risks and strategies.There are a number of benefits associated with BBNs: firstly, these provide a graphical representation ofthe problem that can help stakeholders visualise the interaction between a number of variables;probabilistic reasoning is easily captured and propagated through powerful software and prior beliefsabout the uncertain variables can be easily updated after providing evidence against separate sources inthe network; uncertainty in reasoning is taken into account and the (in)dependence between variablescan be recognised; and one can model BBNs even when there is limited empirical data. However, thereare some shortcomings of the method as well: elicitation of expert judgment in both developing andpopulating the network is challenging when data is not readily available; available software have limitedcapability in dealing with continuous variables as the variables have to be discretised which can lead to alimited ability to capture the original distribution of the variable; and the “acyclic graph” requirement,which is needed to carry out probability calculus, is another limitation that results in feedback effectsnot being included in the network (Jensen & Nielsen, 2007).3.Literature Review: Models for Managing Interdependent Supply Chain RisksAs the research question investigates development of a SCRM process considering interdependencybetween supply chain risks and mitigation strategies, the focus will be limited to the literature dealingwith interdependent risks. For a comprehensive overview of quantitative models in SCRM, interestedreaders may consult the literature review conducted by Fahimnia, Tang, Davarzani, and Sarkis (2015). Anumber of models have been proposed for identifying and assessing supply chain risks, however, limitedstudies have considered interdependency between risks. Cause-effect diagram (Lin & Zhou, 2011) andsocial network theory (Kim, Choi, Yan, & Dooley, 2011) have been used for mapping causal interactionbetween supply chain risks. Interpretive structural modelling has been used for modellinginterdependency between risks (Pfohl, Gallus, & Thomas, 2011) and identifying the interdependentenablers of risk mitigation (Faisal, Banwet, & Shankar, 2006) which helps in not only mapping therelationship between variables but also in developing a hierarchy of the network. The main problemwith these techniques is the inability of modelling the strength of relationship between interconnectedrisks.
FMEA has been used for identifying and assessing supply chain risks (Nepal & Yadav, 2015; Tuncel &Alpan, 2010). The major shortcoming of these studies is the use of RPN for ranking risks (Gilchrist, 1993)and failure to capture the network wide propagation of risks. Supplier selection/assessment hasremained one of the active areas of research and a number of methods including Analytical HierarchyProcess (AHP) (Chen & Wu, 2013) and BBNs (Dogan & Aydin, 2011) have been developed to assesssupplier related risks. The main limitation of these studies is their focus on addressing a specific problemwithout considering the holistic interaction of risks across the supply network (Garvey et al., 2015).The likelihood of the occurrence of an (undesirable) event, and the negative implications of the eventare two common measures of risk (Bogataj & Bogataj, 2007). Risk mitigation strategies are implementedin order to reduce the likelihood of occurrence and/or negative impact of risks (Tang & Tomlin, 2008).Robust strategies must be developed in order to help firms reduce cost and/or improve customersatisfaction under normal conditions and enable firms to sustain operations during and after thedisruption. A number of studies have proposed selecting strategies specific to the supply chainconfiguration and risks (Christopher & Lee, 2004; Christopher, Mena, Khan, & Yurt, 2011; Son &Orchard, 2013; Speier, Whipple, Closs, & Voss, 2011; Zsidisin, Ellram, Carter, & Cavinato, 2004). Fewstudies (Aqlan & Lam, 2015; Micheli, Mogre, & Perego, 2014) have considered the optimisation problemof selecting cost-effective risk mitigation strategies, however, no study has ever considered the problemof evaluating optimal combinations of risk mitigation strategies within a probabilistic network setting ofinteracting risks and strategies.BBNs have been extensively applied to the field of risk management (Ashrafi, Davoudpour, &Khodakarami, 2015; Norrington, Quigley, Russell, & Van der Meer, 2008; Wu, Yang, Chang, Château, &Chang, 2015) mainly because BBNs offer a unique feature of modelling risks combining both thestatistical data and subjective judgment in case of non-availability of data (Dogan & Aydin, 2011).However, their application to the field of SCRM in modelling holistic interaction between risks hasrecently gained the interest of researchers (Garvey et al., 2015; Leerojanaprapa et al., 2013). Badurdeenet al. (2014) introduced a supply chain risk taxonomy and a risk network map capturinginterdependency between risks. Their model presents an effective tool to capture the interaction of riskfactors and helps in identifying critical suppliers.In a recent study conducted by Garvey et al. (2015), supply chain process and risks corresponding tovarious segments of the supply network are combined together and modelled as a BBN. They alsointroduce new risk measures for identification of important elements within the supply network. Theirproposed modelling framework differs from the existing BBN based studies in SCRM (Badurdeen et al.,2014; Dogan & Aydin, 2011; Lockamy, 2014) in terms of exploring the propagation impact of risks acrossthe network of interconnected risks and supply network elements, but their proposed risk measuresonly consider the impact of risks on the descendant nodes and ignore capturing the diagnostic effect.
They also incorporate the loss values within their modelling framework thereby overcoming the majorlimitation of earlier studies in terms of focusing on only the probabilistic interdependency betweenrisks. However, the proposed framework does not focus on modelling and evaluating risk mitigationstrategies (risk treatment). Furthermore, it might not be feasible to adopt the method for mapping ahuge network as the method necessitates following the process flow of the supply chain.Heckmann, Comes, and Nickel (2015) conducted a critical review of quantitative approaches formanaging supply chain risks focussing on the definitions, measures and modelling of risk. According tothem: ‘Standard deviation, mean-variance approaches, value-at-risk, conditional-value-at-risk orpremiums are risk measures that aim at describing the interaction of uncertainty and the extent of itsrelated harm or benefit. Owing to the lack of quantitative measures that capture the more complexrealities of supply chains, these measures – developed in finance and insurance contexts – are applied forsupply chain risk, too’ (Heckmann et al., 2015, p. 127). However, a closer look at the cited references intheir study reveals that the measures are not developed for interdependent risks and that is why therisk measures introduced by Garvey et al. (2015) are deemed as state-of-the-art in terms of capturingthe interdependency between risks and ‘measuring monetary losses within supply chain management’(Heckmann et al., 2015, p. 128). However, Garvey et al. (2015) rightly identify the limitation of theirproposed measures as these only capture propagation of losses across the pure descendants of risks(causal effect) rather than evaluating the network wide propagation of losses (causal and diagnosticeffects).Although our study can be considered as an extension to the study conducted by Garvey et al. (2015) interms of exploring BBNs as a framework for managing supply chain risks, there are some majordifferences. Our contribution to the literature in SCRM is multi-faceted: we introduce a comprehensiveintegrated process of SCRM grounded in the theoretical framework of BBNs and to the best of theauthors’ knowledge, a probabilistic graph integrating all stages of the risk management process andcapturing interdependency between risks and strategies has never been explored; we proposedependency based probabilistic risk measures capturing network wide impact of risks that help inprioritising risks both in the risk assessment and risk monitoring stages; we utilise the concept ofShapley value to determine fair allocation of resources to the critical risks identified; and we establish amethod of prioritising risk mitigation strategies within a probabilistic network setting.4.Metrics to Support Resource Allocation and Their CharacteristicsIn this section we start in 4.1 with a simple illustrative example to motivate the measures we proposefor assessing risk on the network. In section 4.2 we explore characteristics of these measures and reflecton their applicability in defining appropriate risk mitigation strategies for a network. In section 4.3 weexplore characteristics of an optimal portfolio of risks subject to a budget constraint. Lastly in section 4.4
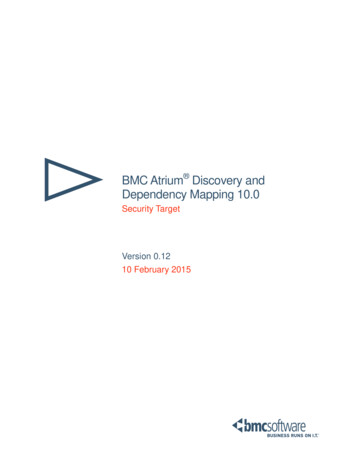
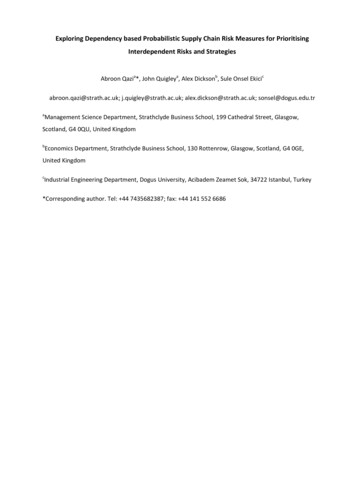
we consider the use of Shapley value on the network to identify fair budget allocations prior todeveloping risk mitigation strategies.4.1Motivating ExampleConsider a supply network with three identified risks and an associated BBN illustrated in Fig. 1. Risk 1(R1) and Risk 3 (R3) have no parent nodes with a probability of being realised of 0.5 and 0.2,respectively. Risk 2 (R2) is dependent on both R1 and R3 with Conditional Probability Table (CPT)provided in Table 1, and a marginal probability of being realised of 0.429. Associated with R1, R2 and R3are a Loss 1, 2 and 3 of 100, 1000 and 500 respectively if the risk is realised. This produces a correlationbetween Loss 1 and Loss 2 of 0.34 and Loss 2 and Loss 3 of 0.53.Fig. 1. A Bayesian Belief Network illustrating three risks each with an associated loss node and a totalloss node (GeNIe, 2015)Table 1. Conditional probability table of Risk 2State ofRisk 2RealisedNot RealisedState of Risk 1Not Realised (0.5)Realised (0.5)State of Risk 3State of Risk 3Not Realised (0.8)Realised (0.2)Not Realised (0.8)Realised (0.2)0.10.90.50.990.90.10.50.01The expected direct loss from R1, R2 and R3 is 50, 429 and 100 respectively with an Expected Total Lossof 579 and a standard deviation of 638. We shall refer to the Expected Total Loss as the Risk NetworkExpected Loss (𝑅𝑁𝐸𝐿) to reflect that the loss represents a total loss across the network of risks afteraccounting for the propagation of risks through the network. Illustrated in Fig. 2 is the probabilitydistribution for the realised Total Loss, so while the mean of this distribution is 579, the probability ofrealising a total loss in excess of this is 0.43, of realising a loss of at least twice the mean is 0.389 andthere is a probability of 0.099 that the total loss will be 1600, almost three times the mean.Decision makers may have resources available to wholly or partially mitigate a risk, in which caseassessing the impact a risk has on Network Loss becomes important. This is a challenging exercise in thepresence of dependency or correlation between the direct losses, as once realised a risk can propagateconsequences, increasing the likelihood of realising other risks. Fig. 3 illustrates three probabilityfunctions representing the distribution with R1, R2 or R3 entirely mitigated (i.e. the probability of it
being realised is set to zero). Key summary statistics of these distributions are provided in Table 2. Thedistributions are quite different which is not reflected in measures such as 𝑅𝑁𝐸𝐿. No distributionstochastically dominates, so choosing the most important risk to manage will depend on thepreferences of the decision maker: how mitigating each risk is valued by the decision maker depends ontheir assessment of the value of the change in the probability distribution that 100.050.0001005006001000110015001600Network LossFig. 2. Probability distribution of Network Loss0.8Probbaility0.70.6Without Risk 10.5Without Risk 30.4Without Risk 20.30.20.100100500600100011001500Network LossFig. 3. Probability distribution of Network Loss assuming Risk 1, Risk 2 or Risk 3 is removed showing avariety of shapesTable 2. Summary Statistics from the distribution of Network Loss assuming Risk 1, Risk 2 or Risk 3 isremovedRisk RemovedRNELStandard DeviationNoneRisk 1Risk 2Risk 3579360150350638600206482Best Case(probability)0 (0.36)0 (0.72)0 (0.45)0 (0.40)Worst Case(probability)1600 (0.099)1500 (0.18)600 (0.10)1100 (0.25)
Consider the conditional distributions of Network Loss given a risk has been realised (i.e. its probabilityis set to one). For the simple illustrative example in this section the three conditional distributions areprovided in Fig. 4. Note that, due to the direction of the causal relationship between R1 and R3, and R2,if R2 is realised the probability of R1 and R3 are not updated as there is no change in epistemicuncertainty. It is clear from this illustration that the influence of each risk on possible network losses isvery different: for example, the expected loss if R3 is realised is much higher than if R2 is realised.Whilst 𝑅𝑁𝐸𝐿 gives an ex ante measure of losses that are at stake on the network, it does not allow anyinference about the importance of individual risks. In order to do this we propose the Risk NetworkExpected Loss Propagation Measure for Risk 𝑖 (𝑅𝑁𝐸𝐿𝑃𝑀𝑖 ), which measures the probability-weighted𝑅𝑁𝐸𝐿 if risk 𝑖 is realised. Table 3 provides a summary of the distributions illustrated in Fig. 4 along withthe 𝑅𝑁𝐸𝐿𝑃𝑀 for each risk.0.5Probability0.40.3Risk 1 Realised0.2Risk 2 RealisedRisk 3 Realised0.100100500600 1000 1100 1500 1600Network Loss Given Risk RealisedFig. 4. Probability distribution of Network Loss given Risk 1, Risk 2 or Risk 3 is realisedTable 3. Summary Measures of Network Loss given risks realisedRisk RealisedRisk 1Risk 2Risk 3RNEL given riskrealised79811501498Probability ofrealising risk0.500.430.20RNELPM399495300Difference between RNEL givenrisk realised and RNEL219571919UTC110246184The idea of proposing the 𝑅𝑁𝐸𝐿𝑃𝑀 is to allow decision makers to prioritise the reduction of risk on thenetwork if resources are available to do so by identifying those risks that have the greatest effect on thenetwork expected loss given the propagation of risks through the network, also accounting for thelikelihood of them occurring. This takes the mean of the distribution for each risk in Fig. 4 and weights itby the probability of the risk occurring. If decision makers are risk-neutral their assessment of thedistribution is correctly summarised by the average. If a decision maker has non-neutral riskpreferences, it would not be appropriate to use the expected loss to summarise the distribution, but toconsider the expected utility of the loss: a probability-weighted average of the utility of the losses that
might be realised if a risk is realised, which should then itself be weighted by the probability of the lossoccurring. Eliciting a decision maker’s utility function is known to be challenging (Ruan, Yin, & Frangopol,2015) leading to difficulties in operationalising such a measure and so, whilst it may be interesting topursue this in future work, we turn our attention to a different line of inquiry.There is lots of evidence to suggest that human decision makers evaluate the outcomes from thechoices they make by comparing those outcomes relative to a reference outcome, and exhibiting ‘lossaversion’. This is the characteristic that if an outcome is a certain amount worse than the referenceoutcome then this gives a greater reduction in the attractiveness of the outcome than the increase inattractiveness if an outcome is the same amount better than the reference outcome. The idea of lossaversion was made famous by Kahneman and Tversky (1979) in their ‘Prospect theory’, which has beendeveloped in particular by Kőszegi and Rabin (2006), who carefully consider the use of expectations asreference points, and applied extensively to many interesting scenarios.In the context of a network of interdependent supply chain risks, it is far from inconceivable that asupply chain manager may have in mind an expected loss for the standard configuration of the network,and in evaluating the importance of particular risks may place more emphasis on those risks thatincrease the network expected loss above the expected loss for the standard configuration, which istaken as the ‘reference loss’. While managers may have differing degrees of loss aversion, astraightforward way to capture this is to evaluate the impact of a risk being realised by focussing only onwhere realisation of that risk leads to losses that exceed the reference loss, and ignore instances wherethe loss falls below the reference loss. In the case of our simple example, we can easily evaluate theExpected Loss in Excess of the Mean (𝐸𝐿𝐸𝑀), i.e. 𝐸[max(𝑁𝑒𝑡𝑤𝑜𝑟𝑘 𝐿𝑜𝑠𝑠 𝑅𝑁𝐸𝐿, 0)], using thedistribution in Fig. 2 to obtain 305. However, for more complex networks this measure becomescomputationally burdensome, and as an approximation we consider that the decision maker isconcerned with the maximum of the difference between the 𝑅𝑁𝐸𝐿 if the risk is realised and thereference loss, and zero, which we define as the ‘Upper Tail Contribution’ (𝑈𝑇𝐶) of a risk. By isolatingexpected losses in excess of the reference loss, this measure provides an alternative assessment of riskthat captures the importance of reference dependence and loss aversion in the evaluation of risks. Thecalculations for these measures are given in Table 3.While 𝑅𝑁𝐸𝐿𝑃𝑀 and 𝑈𝑇𝐶 are similar in emphasis of purpose, upon comparing the summary measuresin Table 3 we see that 𝑅𝑁𝐸𝐿𝑃𝑀 provides a different rank to the risks than 𝑈𝑇𝐶. Overall, R2 comes outas being high in importance, but using 𝑅𝑁𝐸𝐿 R1 and R3 are marginally different, 𝑅𝑁𝐸𝐿𝑃𝑀 has R1 beingmore important than R3, and the opposite is true with 𝑈𝑇𝐶. In the following section we will formallydefine these measures and explore their characteristics.
4.2The Risk Measures and Their PropertiesIn this section we will be concerned with elucidating the properties of the three measures introduced insection 4.1. These are the 𝑅𝑁𝐸𝐿 (1), which is the expected total loss on the network, the 𝑈𝑇𝐶𝑖 (2),which is the expected increase in 𝑅𝑁𝐸𝐿 from realising risk 𝑖 and 𝑅𝑁𝐸𝐿𝑃𝑀𝑖 (3), which is the expectednetwork loss from realising risk 𝑖. Our intention is to investigate the applicability of these measureswithin an optimisation algorithm to determine the cost optimal level to target the probability of eachrisk. All proofs are contained in the Supplementary Material (see Appendix A).𝑅𝑁𝐸𝐿 𝐸[𝑁𝐿](1)𝑈𝑇𝐶𝑖 𝐸𝑅𝑖 [𝑚𝑎𝑥(𝐸[𝑁𝐿 𝑅𝑖 1] 𝐸[𝑁𝐿], 0)](2)𝑅𝑁𝐸𝐿𝑃𝑀𝑖 𝐸[𝑁𝐿 𝑅𝑖 1]𝑃(𝑅𝑖 1)(3)We start with making observation 1, where using 𝑅𝑁𝐸𝐿 as a reference point, realising a risk will occurincreases the updated 𝑅𝑁𝐸𝐿 and realising a risk will not occur decreases the updated 𝑅𝑁𝐸𝐿 for all risks.Observation 1:𝐸[𝑁𝐿 𝑅𝑖 0] 𝑅𝑁𝐸𝐿 𝐸[𝑁𝐿 𝑅𝑖 1]Observation 2 establishes that 𝑈𝑇𝐶𝑖 will never e
Supply chain risk management; Bayesian Belief Networks; Failure Modes and Effects Analysis; risk measures; risk mitigation strategies 1. Introduction Supply chains have become more complex due to the globalisation and outsourcing in manufacturing industries. Global sourcing and lean operations are the main drivers of supply chain disruptions (Son &