Transcription
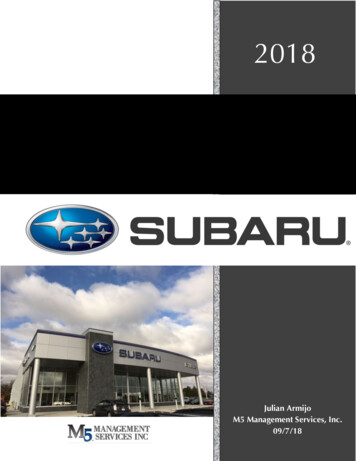
2018Julian ArmijoM5 Management Services, Inc.09/7/18
Farrish SubaruFamily owned and operated for over 50 yearsTable of ContentsEVALUATION SUMMARY:2FINANCIAL OVERVIEW:3SERVICE DEPARTMENT MONTHLY FINANCIAL TREND SUMMARY:3SERVICE DEPARTMENT REPAIR ORDER ANALISYS8TECHNICIAN PRODUCTION REVIEW:10TECHNICIAN SKILL SUMMARY:11TECHNICIAN RECRUITMENT:13ALTERNATIVE STAFF SCHEDULES:14COST OF SALE REVIEW:15CUSTOMER IMAGE:16SERVICE WRITE UP:17CSI REVIEW:18SERVICE CONSULTANT COMPENSATION REVIEW:19ADDITIONAL SERVICE REQUESTS21TIRE SALES23EXPRESS SERVICE24REPORTING AND SYSTEM MANAGEMENT25SERVICE DEPARTMENT CURRENT ORGANIZATIONAL CHART:26SERVICE DEPARTMENT PROPOSED ORGANIZATIONAL CHART:27EMPLOYEE THEMES:29RECOMMENDATIONS30PROFORMA:31PROCESS WEEKS:32INVESTMENT SUMMARY371
Farrish SubaruFamily owned and operated for over 50 yearsOPENING EXECUTIVE MEETING OLP Production Recruiting/Hiring Loyalty ExpressEVALUATION OVERVIEWThe following observations and recommendations are based on the evaluation at FarrishSubaru during the week of September 4th-7th, 2018The department currently lacks A clear sense of direction A common focus within the department to one single objective A clearly defined “victory” level of performance A consequence for lack of performance Proper training on available tools to increase performance and productivity Ability to execute on established processesThe proposed service process plan for the service department will: Increase technician production, and therefore OLP and customer retention Decrease idle time within the technical staff Increase through put in the service department A clear focus on specific metrics for each position Increase customer retention Increase new/used vehicle sales Increase the Employee Satisfaction Increase “net profit”2
Farrish SubaruFamily owned and operated for over 50 yearsFINANCIAL OVERVIEWService department customer dependency Currently the service departments’ 2018 customer dependency is 64.6%. Objective for dependency is a goal of 70% Customer dependency is an indicator of self-sustainment of the department Low customer dependency leaves the department vulnerable to new car sales Current Average miles per vehicle is at 53,674 Based on this mileage we are losing customers. This is also an indication of low closing ratios on ASRsSubaru financial DataAccount DescriptionSub 17%Sub 18%SALESCustomer LaborWarranty LaborInternal LaborService Contracts Total Subaru Service Labor 133,517Other-CustomerOther-WarrantyOther-Internal Total Other Service Labor 245,624 295,721Total Mechanical Labor 379,141 460,047Sublet Repairs-ServiceMisc. SalesAdjustment Cost of Labor Sales TOTAL 7-64.0% 20.7% 15.2% 106,08637,11221,12864.6%22.6%12.9%100.0% 164,326100.0% 159,85679,68956,17729,104- 489,151
Farrish SubaruFamily owned and operated for over 50 yearsGROSS PROFIT Sub 17Sub 18Gross%Gross%Customer LaborWarranty LaborInternal LaborInternal Labor 64,03419,90615,59874.9% 71.9% 76.6% 80,92128,05815,09876.3%75.6%71.5%Total Subaru Service Labor 99,53874.6% 124,07675.5%Express CPExpress WarrantyExpress Internal - -Total Express Labor - -Other-CustomerOther-WarrantyOther-Internal 98,78147,83236,620 118,79061,22143,409Total Other Service Labor 183,232 223,420Total Mechanical Labor 282,77074.6% 347,497Sublet Repairs-ServiceMisc. SalesAdjustment Cost of Labor Sales TOTAL 273,1361,327(10,962) 75.5%1,394(15,257)67.9% 333,63368.2%Internal Labor gross profit has dropped over 5 percentage points since 2017even though the labor rate has been increased for internals UnMost Pay plans in the store are incentivized on gross profit leading to trackingdispay with increasesSubaru financial DataAccount DescriptionSub 17%Sub icalOther Salaries and WagesTaxes Payroll 7,286.42 24,767 16,906 94,628 19,641Employee Benefits/Pension Fund 6,241Absentee Compensation 5,554Total Personnel Expenses 175,02342.7%9.1%0.0%0.0%6.2%34.6%7.2% 7,634.86 30,471 16,508 103,322 22,1792.3%9.1%0.0%0.0%4.9%31.0%6.6%2.3% 6,1232.0% 5,0611.5%64.1% 191,30057.3%Sep1.8%Eveis p
Farrish SubaruFamily owned and operated for over 50 yearsAccount DescriptionSub 17%Sub 18%Company Vehicle ExpenseOffice SuppliesOther SuppliesAdvertising 1,1981,758(5,358)15,3440.4%0.6%-2.0%5.6% 2802,527(7,527)16,6080.1%0.8%-2.3%5.0%internet AdvertisingBad DebtContributionsPolicy Work - Serivce. P&AOutside ServicesLaundry and UniformTravel and EntertainmentMembership, Dues, & PubLegal & AuditingTelephoneFreight & Express/PostageTrainingData ProcessingMisc %0.0%2.1%6.2%0.0%0.2%0.2%0.9%0.6%0.0%2.0%0.8%0.1% al Operating Expenses 48,69817.8% 48,26314.5%Rent LeaseAmortizationRepairs Real EstateDepreciation - Bldg & imrpv.Taxes - Real EstateInsurance - Bldg & imrpv.Interest - Real Estate MortgageHeat, Light, Power WaterIns Other than Blgs and Impv.Taxes Other than Real EstateOther InterestDepreciation other than Bldgs & impvEquipment Repairs and Rentals 0.0%1.4%0.0%0.0%1.3%0.7%0.5%0.3%0.0%0.8% Total Overhead Expenses 53,45719.6% 58,26717.5%TOTAL OPERATING EXPENSE 277,178101.5% 297,83089.3% Overall expenses have remained relatively flat year over year Some of the expense structure needs to be looked at to ensure visiblemanagement5Shha
Farrish SubaruFamily owned and operated for over 50 yearsAccount DescriptionSub 17%Sub 18%PROFITLabor Net ProfitSublet GrossAdjustment Cost of Labor SalesMisc. SalesStatement NetANNUALIZED NET 5,5931,327(10,962)(4,042)(48,507)2.0% 49,6661,394(15,257)35,803429,63914.3%Labor net has substantially improved year over year due to the flat expensesand increases in salesREPAIR ORDER COUNTSCustomer LaborWarranty LaborInternal LaborTotal Subaru Service LaborExpress CPExpress WarrantyExpress InternalTotal Express al Other Service LaborTotal Mechanical LaborTotal Work DaysSub 175362831861,00500006495792541,4832,48726Average Per Day%98 RO counts show increases matching sales Internal RO counts at Subaru have declined6Sub 186043001651,06900006407582951,6932,76226108%
Farrish SubaruFamily owned and operated for over 50 yearsSubaru financial DataAccount DescriptionSub 17%Sub 18%REPORTED HOURSCustomer LaborWarranty LaborInternal Laborservice l Subaru Service al Other Service LaborTotal Other Service LaborTotal Work DaysAverage Per Day66330720501,1751,1426035452,2903,46523153 Hours reported on the statement are self-calculating based on the ELR reported Hours on the statement do not match actual hours produced in the shop7
Farrish SubaruFamily owned and operated for over 50 yearsSERVICE DEPARTMENT REPAIR ORDER ANALYSIS Hours per Repair order are lowWe are not using the labor gridLabor sales per repair order are extremely low and coincide with Low ELR andlow hours per repair order8
Farrish SubaruFamily owned and operated for over 50 yearsJob list and related ELRs RO Review Showed the advisors over grossing on repair ordersSome operation codes are excessively high on ELRAreas or improvement opportunity determined from the repair order review: Increase customer pay sales performance Increase ASR rate and ASR Presentations Focus on production and not gross Reduction in one line repair orders9
Farrish SubaruFamily owned and operated for over 50 yearsTECHNICIAN PRODUCTION REVIEWObservations during the week: Technicians are consistently late Process for estimating is not effective Loss of production at the back parts counter Loss of production at the service driveTECNICIAN COST OF /19/9910/16/911/4/1011/22/10TECH NAMEADAM YNEERICKTotalsFRHCLK HRS 9280.8 8943.184 103.8%Our primary focus is to increase production through the service department and increaseour level of service (OLP) to our clients.Production for the service department is impacted by: Dispatch technique Service consultant selling ability Repair order information Scheduling technique Formal production objectives Formal service consultant objectives High percentage of one line repair orders Service maintenance presentation Lack of diagnostic pricing / selling Communication process Facility limitations Individual technician skills Tools & equipment Training10
Farrish SubaruFamily owned and operated for over 50 yearsTECHNICIAN SKILL SUMMARYCurrently, the shop percentage of repair skilled technicians is at 61%.Some technicians are still not certified even though capableTraining must be a priority for the departmentTECHNICIAN SKILL SUMMARYTechnician Name2.0 Fully Qualified1.0 Partial Qualified0.0 Non QualifiedTechnician NameBrakeRepai rFrontESundsp&El ensiectr i oncaRHe epa lati i rng&Ma Con Ai rnudalRe Tr anDr ar A s &i va xlbi eTu l i tyne&UpEngi neRepai rAuTr tomaansm ti ci ssSki onillPoi ntsSkillRati ngProdHo ucturs A i onvg/Wk Pete2.02.02.02.02.02.02.02.0 20.0100%56.6Jake2.02.01.02.01.02.01.01.0 12.075%61.1Matt2.02.02.02.02.02.02.02.0 16.0100%44.9Mike2.02.02.02.02.02.02.02.0 16.02.02.02.02.02.02.02.02.0 16.0100%100%24.5AdamMohan2.02.01.02.01.02.01.01.0 .00.00.00.00%Total Srvice Techs9.0Weekly Shop productionRepair Qualified in all areas 4.0total pointstotal possible%qualified88.014461%1133.0273.7
Farrish SubaruFamily owned and operated for over 50 yearsCurrent Subaru Training Status050-02-01-030260-FARRISH SUBARUCourse NameSkillGroupsLevelEngine Service Tips12EYYYERYRRYYYYEngine Theory & Diagnosis ILT12EYYY-EY--YYYYBelt Driven Valve Train Boxer Engines ILT13-EYY--E--EYYRChain Driven Valve Train Boxer Engines ILT14-EYY--Y--EYYYSG1 Certification Test15--YY------YY-Transmission Theory and Diagnosis Part 122YYYYERYEEYYYYTransmission Theory & Diagnosis Part 2 ILT22EYYY--Y--EYYYSplit Case Manual Transmissions ILT23-EYY--E---YYESix Speed Manual Transmissions ILT24-EYY--E---YYESG2 Certification Test25--YY------YY-Automatic Transmission Learning Procedures (ATL): Overview32YYYYERYEEYYYYFour Speed Automatic Transmissions ILT33-EYY--E---YYEFive Speed Automatic Transmissions ILT34-EYY--E---YYEContinuously Variable Transmissions ILT34-EYY--E---YYESG3 Certification Test35--YY------YY-Electronic Throttle Control (ETC): Overview42YYYYERYEEYYYYDiagnosis and Documentation of the DTC P042042YYYYERYEEYYYYBasic Fuel Injection Part 142YYYYEYYEEYYYYBasic Fuel Injection Part 242YYYYEYYEEYYYYBasic Fuel Injection Part 3 ILT42-YYY--Y--YYYYIntermediate Fuel Injection ILT43-QYY--Y---YYYIntermediate Diagnostics with Subaru Select Monitor ILT44--YY------YYQDirect Fuel Injection Systems ILT44-EYY--E---YYYSG4 Certification Test45--YY------YY-EyeSight Overview52YYYYERYEEYYYYBrakes Theory & Diagnosis ILT52ERYY-ER--RYYYSteering & Suspension ILT53EYYY-EY--EYYYNoise, Vibration & Harshness ILT53EEYY-EY--EYYYVehicle Dynamics & Driver Assist Systems ILT54--YY------YYYSG5 Certification Test55--YY------YYRGR8 Battery Diagnostic Station62YYYYERYEEYYYYTroubleshooting using Inputs and Outputs of Control Modules62YYYYERYEEYYYYSubaru Select Monitor III Training Series: Module 2: Intermediate Use of the SSMIII62RYYYERYEEYYYYOccupant Detection System (ODS)62YYYYERYEEYYYY609 Refrigerant Handling Certificate 06L201008T62EYYYEEEEEYYYYDST-i Oscilloscope62YYYYEYYEEYYYYNEW 3-Day Electrical Theory & Diagnosis ILT62EYYY-EY--QYYYAir Conditioning Refrigeration Systems ILT63-EYY--Y---YYESubaru Select Monitor Diagnostic Systems ILT63-YYY--Y--YYYYRestraint Systems ILT63-YYY--Y---YYRAutomatic Climate Control Systems ILT64--YY--Y---YY-Advanced Electrical Systems & Diagnosis ILT64-EYY--E---YYSG6 Certification Test65--YY------YY-XV Crosstrek Hybrid - Automatic Start/Stop72YYYYERREEYYYYXV Crosstrek Hybrid - Electrical Wiring Configuration72YYYYEEEEEYYYYXV Crosstrek Hybrid - Temporary Flat Tire Repair Kit72YYYYEEEEEYYYYXV Crosstrek Hybrid - CVT Power Flow During Normal and Hybrid Operations72YYYYEEEEEYYYYXV Crosstrek Hybrid - Technician Safety Kit72YYYYEEEEEYYYYSubaru BRZ ILT74--YY------YYQSubaru Hybrid ILT74--YY------YYQ ureSachlisEdsonGregorySilan4 of 13 techs are completely certifiedMany of the techs have eligible status for many coursesTech training needs to be a top priorityPay plans and rates for techs should reflect training and production status12SpencerPerpetuoYadavMikeMohan-
Farrish SubaruFamily owned and operated for over 50 yearsTECHNICIAN AND PERSONNEL RECRUITMENTNo technician basThere is not set paAttempting to appThe following areA tech baseRecruiting trequiredJob postingDealer webARE YOU TRIED OF WORKING 6 & 7 DAYS A WEEK?ARE YOU UNAPPRECIATED?ARE YOU UNDER PAID?FORCE TO WORK WITH OUTDATED EQUIPMENT?FORCE TO WORK IN BAD CONDITIONSIF SO WE WOULD LIKE TO SPEAK WITH YOU!!!South West Florida Coast“Locally Owned and Operated”Automotive Dealer is in SEARCH ofEnthusiastic, MotivatedAUTOMOTIVE TECHNICIANSPAY & BONUS BASED ON EXPERIENCE & CERTIFICATIONS“SIGN ON BONUS”ooooooooooooooPerformance Based Pay PlansPrescription InsuranceMedical InsuranceDental InsuranceVision InsuranceLife InsurancePaid Time Off (PTO)401(k) Retirement PlanPaid HolidaysDefined Career Paths with training providedPaid VacationsPaid TrainingFlexible SchedulingPerformance Bonuses13
Farrish SubaruFamily owned and operated for over 50 yearsALTERNATIVE STAFF SCHEDULES AND CAPACITY Future expansion of the shop may require alternative schedulingAlternative scheduling is also a good way to attract new employeesIn most cases, alternative scheduling allows for additional convenient hours forcustomersAlternative schedules also create additional work space and more available workinghoursExample of 4-10 alternative scheduleCurrent Scheduling ech 1OFF88888OFFOFF88888OFFTech 2888888OFF88888OFFOFFTech 388888OFFOFF888888OFFTech 488888OFFOFF88888OFFOFFTech 588888OFFOFF88888OFFOFFTech 688888OFFOFF88888OFFOFFTOT HRS AVL404848484816404848484816248248Scheduling Process P A30303030OFFOFFOFFOFFOFF30303030OFFGROUP BOFFOFF30303030OFF3030OFFOFF3030OFFGROUP 1111111111111111# OF TECHS666666666666TOT HRS AVL666666666666666666666666TOTAL WEEKLY HOURS AVAILABLE396TOTAL WEEKLY HOURS AVAILABLE14396
Farrish SubaruFamily owned and operated for over 50 yearsCOST OF SALE REVIEW Actual effective cost is over 7.00 higher than the flagging technicians average payrate.TECNICIAN COST OF /19/9910/16/911/4/1011/22/10TECH NAMEADAM YNEERICKFLAT RATE PAYFRHCLK HRS 25,667.22 25,767.229911115 23.50 26.00 2,095.04 2,095.0469.889.0 32.00 30.01 35,980.79 36,180.7918351265.0 18.00 19.72 55,062.89 55,114.8913461110.0 34.50 40.95 26,379.60 26,893.607341024.0 30.00 36.64 51,213.00 51,293.0016071140 30.00 31.92 65,741.33 80,492.3316981111 36.00 47.40 27,176.58 27,212.581000.01043 23.00 27.21 23,605.11 23,605.11679.1662.6 31.00 34.76 11,787.51 11,787.51335.9383.6 30.00 35.09 Totals YTD PAYRATEACTUAL.HR-289,316.45 328,654.56 9280.8 8943.184 28.38 35.41 Hourly Technician production is not being tracked Actual production levels are much lower than shown if hourly techs are added The spreadsheet below from ROSE shows the unflagged work that is being doneby the hourly staff Advisors are not flagging most services performed by hourly techsCurrent hourly Techs are producing only 2 oil changes per day average based on thedataLess than 100 flagged hours between all hourly techs over 7 months15
Farrish SubaruFamily owned and operated for over 50 yearsCUSTOMER IMAGEThere needs to be a major focus on maintaining customer image here at the store. Itshould not only be visible in the physical appearance of the store, but in the actions ofthe staff as well. Most of the processes will be designed around customer retention.Convenience and pricing should be extremely customer friendly and based on ananalysis of our competition and the customer needs. Implementation of these process’ will Impact OLP significantly to help reach an OLPscore of 800 or better Daily review of the appointment schedule to determine the length between customercall-in to the time the customers scheduled visit into the dealership Daily review of the customers who fail to show up for their scheduled appointment Continuous monitoring of the review the pricing of all services including maintenanceand repair items. Daily review of all customer pay declined maintenance and repairsVehicle throughput is another area of concern. We must have a focus on our ability to efficiently get customers’ vehicles written up,diagnosed, repaired, and redelivered. Both the scheduling and structural alignment in the shop is designed to do just this.The entire focus of the fixed operations MUST be OLP. The mission of the servicedepartment should be “to serve the customer in a manner that earns their repeatbusiness”. Nothing less is acceptable, and this needs to become the definition of a “goodjob” for all fixed operations staff. I recommend we develop job definitions for all fixed operations staff. The jobdefinitions will all include specific areas of focus that define a good job.16
Farrish SubaruFamily owned and operated for over 50 yearsSERVICE WRITE UP AND DELIVERYThe Service Advisor Team is a good group. The Advisors are friendly but are lackingexecution of the desired process for customer interaction. Training will be essential todeveloping long lasting and productive advisors.The service consultants are inconsistent in the following areas:Arrival & Greeting The customer is not being greet promptly at times Inconsistent handshakes & welcoming greetingsVehicle Walk Around Inspection Vehicle walks around inspections are not being performed consistentlyMPI Process This process is not being discussed at the time of write upService Write Up Maintenance menus are not being presented during the write upWork Flow Scheduled work flow is being scheduled in by vehicle count Work flow is scheduled heavy at specific times leading to lower customer servicedue of rushing.MPI and ASR presentation and sales Hours/RO and Lines per RO reflect MPI and ASRs are not being presentedconsistently and efficiently leading to low additional sales and loss of hoursActive delivery Active delivery is not being done consistently The entire focus of the service staff is OLP and retention The staff would benefit from weekly meetings to include role play exercises on thecomplete service write up process17
Farrish SubaruFamily owned and operated for over 50 yearsOLP REVIEWAddressing 4 main areas will take the store OLP above average Walk Arounds MPI presentations Building Value Time to completeSERVICE APPOINTMENTS AND WORKFLOW Current scheduling process is based on appointment slots and car count Effective workflow scheduling schedules on the available inventory for the departmentwhich is available hours Processes and procedures should be put in place to spread the work out throughout theday Scheduling should allow for shop to be preloaded in the morning to ensure maximumproductivity Current practice deters advisors from scheduling afternoon work resulting in productionloss18
Farrish SubaruFamily owned and operated for over 50 yearsSERVICE CONSULTANT COMPENSATION The service consultants are currently paid on gross sales.Not geared to selling the service department inventoryIncentivizes the selling at a markup instead of producingAdvisors intentionally markup items in order to make more grossWhen labor rate increases, advisors get a raise without any additional performancePay plan encourages avoiding Low Flagging servicesThere are things to consider when adjusting any of the service staffs’ compensation plans: First – Create job descriptions Second – Compare the job values Third – Evaluate the employees’ performance Last – KEEP IT SIMPLEAdvisor Compensation Plan Guidelines Focus on Hour production Additional incentives for achieving defined objectives Objectives should match technician team objectives Heavily influenced by OLP for up to 15% of total pay Total Pay should equal at least 4% but no more than 7% of total salesPay plan based on these guidelines will Encourages an increase in production hours Promotes the sale of ALL items, including the low sale price items Has a HEAVY focus on customer satisfaction? Promotes a TEAM unity within the service department Pays more for better performance Aligns the advisors to the same goal as the technicians Encourages to maintain high OLP Scores19
Farrish SubaruFamily owned and operated for over 50 yearsThis is an example of a pay plan of a working pay plan calculatorService Advisor Pay Plan CalculatorAnnualProjectionSummaryAll Yellow Boxes Require EntryAmountMonthlySpiffs andLevel I 750IncentivesFlat rate hoursLevel II 4.35producedCustomer repairLevel III3.8%order parts salesCSI - At or aboveLevel IV 750regional average 70.00Projected Amounts 60,000.00EffectiveRateCalculationsProjectedFRH's permonthMonthlyBudget 173690.0 ly15.0% 9,000 75060.0% 36,000 3,000 692CustomerParts Sales10.0% 6,000 500 115 13,000 500 18.84Parts Salesper FRH15.0% 9,000 750100.0% 173 5,000ProjectionsHoursProducedParts SalesSpiffs andIncentivesFRH Parts SalesCSImonthsProjectedAnnualHrsIncrease621 11,700 750 2,700 450 750 4,650x12 55,800-10%690.0 13,000 750 3,000 500 750 5,000x12 60,0000%759.0 14,300 750 3,300 550 750 5,350x12 64,20010%834.9 15,730 750 3,630 605 750 5,735x12 68,82021%918.4 17,303 750 3,993 666 750 6,159x12 73,90233%1010.2 19,033 750 4,392 732 750 6,624x12 79,49246%1111.3 20,937 750 4,832 805 750 7,137x12 85,64161%1222.4 23,030 750 5,315 886 750 7,700x12 92,40677%Total Monthly xPercentagesAnnualIncomeLabor SalesParts SalesTotalmonthsAnnual SalesPercentage ofSales 55,800 43,470 11,700 55,17012 662,0408.4% 60,000 48,300 13,000 61,30012 735,6008.2% 64,200 53,130 14,300 67,43012 809,1607.9% 68,820 58,443 15,730 74,17312 890,0767.7% 73,902 64,287 17,303 81,59012 979,0847.5% 79,492 70,716 19,033 89,74912 1,076,9927.4% 85,641 77,788 20,937 98,72412 1,184,6917.2% 92,406 85,566 23,030 108,59712 1,303,1607.1%20
Farrish SubaruFamily owned and operated for over 50 yearsADDITIONAL SERVICE REQUESTS (ASR’s)ASRs must be managed dailySales must be tracked and compared against set objectivesAdvisors in some instances are not even making the recommendationTechnicians have no incentive or objective therefore are not recommending ASRsconsistentlyAverage mileage of vehicle in the shop is over 80kIn a 35 RO survey performed the following observations were made35 ros14 maintenance waiters6 repair waiters10 with MPI not completed14 vehicles over 30k with no recommendations1 of 35 had recommendations(data was discussed with David and reasons werefound on ROs with no MPIs)Example tracking sheet21
DEALER MARKET LABOR RATE SURVEYFarrish SubaruFamily owned and operated for over 50 yearsUltimate SubaruDEALERSHIP CONDUCTING SURVEY:DEALER MARKET LABOR RATE SURVEYDATE SURVEY CONDUCTED:TYPE OF SURVEY - BERLABOR RATEFLAT RATEGUIDE USEDSheehy Subaru703 594-8719 130.00GridManassas Subaru888 604-7535 145.00GridStohlman Suaru866 994-5891 130.00GridDon Beyer Subaru888 323-5144 135.00GridStohlman Sterling Subaru888 768-2150 140.00GridDulles Subru703 669-6000 159.00GridDEALERSHIP NAMETOTAL OF ALL LABOR RATES: 839.00NUMBER OF DEALERS SURVEYED:a(divided by)6(equals) 139.83LOCAL MARKET MAINTENANCE PRICING SURVEYWiygul Automotive Clinic 79.00 0.00 80.00 45.00Kims Auto Service 60.00 20.00 40.00 25.00ABS Unlimited Auto Repair 80.00 36.00 119.00 60.00 295.00 99.00 600.00 240.00 96.00 189.50 185.00 531.00 200.00AK Auto 63.00 0.00 45.00 25.00Jermantown Shell 78.00 25.00 50.00 21.95 79.95 210.00Precision 70.00 30.00 88.00 50.00 120.00 225.00 450.00 200.00 430.00 111.00 422.00 226.95 535.00 180.00 0.00 394.95 1,000.00 1,581 904.45 5,355.35Market Average 71.67 18.50 70.33 37.83 267.50 180.00 0.00 98.74 250.00 527.00 180.89 1,630.79Farrish 71.70 25.50 79.95 64.10 149.80 144.90 657.70 159.95 339.95 657.90 207.95 0.03 7.00 9.62 26.28( 117.70)( 35.10) 657.70 61.21 89.95 130.90 27.06TotalsOver/Under Market 240.00ReplBatteryRotorPads&ReplFrtReplFrontPadsAli gns 180.004Wheel6cylTune-ATran utomsmi ss ati ci onServi ceCool ingSystemFl ushFi ltAire&RotaterBal anceeRotatLube,OCh i l &ange Fi l teCornv.1/0/00 325.0022 129.95 856.91
Farrish SubaruFamily owned and operated for over 50 yearsTIRE SALESThere are currently no tire displays available. Store needs to be committed to the tirebusiness Every car should get a walk around including a tire inspection from the serviceadvisor Tires should be displayed in a prominent location and the customer given options Customer tire sales increases customer retention First person to inform the customer of need for tires gets the sale 75% of the time Tires sales increase undercar repairs by allowing for inspections during tiremaintenance Alignments increase significantly when tire sales increaseWe can’t sell them if you can’t smell them!23
Farrish SubaruFamily owned and operated for over 50 yearsEXPRESS SERVICEThe Express department is a crucial part of the business. Current wait times andprocesses in the departments are leading to unsatisfied customers.Stores with an established express department are much more effective at capturingadditional business that is currently walking out the door. Express will also alleviatemuch of the current pressure in the shop which allows main shop techs to be workingon main shop work.Express needs: Training on established process A level of expected performance for each employee Incentive programs that drive desired performance goals Effective scheduling processes BDC training on customer handling for maintenance items Dedicated Technicians focused on time and inspectionsEstablished express will Reduce high paid technicians from working on low level work Reduce wait times for customers resulting in increased OLP Increase additional recommendations capturing more of the currently lost business Increase shop capacity Increase customer loyalty24
Farrish SubaruFamily owned and operated for over 50 yearsREPORTING AND SYSTEM MANAGEMENT TRAININGA key component of management and accountability for the department is the effective useof reporting and use of the system.Service manager should be trained in the following All reports related to production of hours by technicians (PTO)All reports related to advisor performanceAll reports related to departmental performanceAccounting reports related to service department expensesFinancial statement layout and performance comparisonASR reporting for accountabilityIn addition, Service Manger must be familiar with all setups and usage related to Creation,usage and modification of Operation codes Discount codes Fees and shop chargesService manager also needs to have a process for accountability and key metrics tomanage on a daily, weekly and monthly basis.Questions that must be asked daily by the Service Manager: Overall effective labor rateNumber of hours producedNumber of ROsTire Sales for the dayNumber of menu sales for the dayNumber of wiper salesAll other management functions should also be listed and scheduled in order to maintaingrowth pattern and allow for time to coach and train associates which should be over 80% ofthe service managers time.25
Farrish SubaruFamily owned and operated for over 50 yearsSERVICE DEPARTMENT CURRENT ORGANIZATION CHARTThis below illustration is a representation of the lines of management/communication anddispatch in the service department.The current situation leaves no time to the management of the process, profitability orthrough-put in the service department. Service management must be reactive instead ofproactive to most improvement opportunities.26
Farrish SubaruFamily owned and operated for over 50 yearsPROPOSED SERVICE DEPARTMENT ORGANIZATIONThis below illustration of a possible organization structure for the service department. Thisorganizational structure would require the following changes: Organize department into three groups with a team leader Maintain low level of employees directly reporting to service manager Will increase production hours allowing for more clients to be served Will increase OLP by reducing the turnaround time Management at the lower levels Largest impact will be for advisors to have a clear vision of the production in the shopand be able to estimate completion times properly Advisors must answer for every customer:§ What will be done to my vehicle?§ How much will it cost?§ When will the repairs be completed?This layout will allow for growing and training of new employeesAn27
Farrish SubaruFamily owned and operated for over 50 yearsAdvance Production Structure will allow the department to become more efficient as a whole.With layers of supervision the number of direct reports to any
Farrish Subaru Family owned and operated for over 50 years 3 FINANCIAL OVERVIEW Service department customer dependency Currently the service departments' 2018 customer dependency is 64.6%. Objective for dependency is a goal of 70% Customer dependency is an indicator of self-sustainment of the department Low customer dependency leaves the department vulnerable to new car sales

