Transcription
IRENA woRkINgg ppAApERIRENAInternational Renewable Energy AgencyRENEWABLE ENERGY TECHNOLOGIES: COST ANALYSIS SERIESVolume 1: Power SectorIssue 4/5Solar PhotovoltaicsJune 2012
Copyright (c) IRENA 2012Unless otherwise indicated, material in this publication may be used freely, shared or reprinted,but acknowledgement is requested.About IRENAThe International Renewable Energy Agency (IRENA) is an intergovernmental organisation dedicatedto renewable energy.In accordance with its Statute, IRENA's objective is to "promote the widespread and increasedadoption and the sustainable use of all forms of renewable energy". This concerns all forms ofenergy produced from renewable sources in a sustainable manner and includes bioenergy,geothermal energy, hydropower, ocean, solar and wind energy.As of May 2012, the membership of IRENA comprised 158 States and the European Union (EU), outof which 94 States and the EU have ratified the Statute.AcknowledgementThis paper was prepared by the IRENA Secretariat. The paper benefitted from an internal IRENAreview, as well as valuable comments and guidance from Zuzana Dobrotkova (IEA), Al Goodrich(NREL), Miller Mackay (NREL), Cedric Philibert (IEA), Giorgio Simbolotti (ENEA) and Professor XIWenhua (UNIDO-ISEC).For further information or to provide feedback, please contact Michael Taylor, IRENA Innovationand Technology Centre, Robert-Schuman-Platz 3, 53175 Bonn, Germany; MTaylor@irena.org.This working paper is available for download from www.irena.org/PublicationsDisclaimerThe designations employed and the presentation of materials herein do not imply the expressionof any opinion whatsoever on the part of the Secretariat of the International Renewable EnergyAgency concerning the legal status of any country, territory, city or area or of its authorities, or concerning the delimitation of its frontiers or boundaries. The term “country” as used in this materialalso refers, as appropriate, to territories or areas.
PrefaceRenewable power generation can help countries meet their sustainable developmentgoals through provision of access to clean, secure, reliable and affordable energy.Renewable energy has gone mainstream, accounting for the majority of capacityadditions in power generation today. Tens of gigawatts of wind, hydropower andsolar photovoltaic capacity are installed worldwide every year in a renewable energymarket that is worth more than a hundred billion USD annually. Other renewable powertechnology markets are also emerging. Recent years have seen dramatic reductions inrenewable energy technologies’ costs as a result of R&D and accelerated deployment.Yet policy-makers are often not aware of the latest cost data.International Renewable Energy Agency (IRENA) Member Countries have asked forbetter, objective cost data for renewable energy technologies. This working paperaims to serve that need and is part of a set of five reports on solar pholtovoltaics, wind,biomass, hydropower and concentrating solar power that address the current costs ofthese key renewable power technology options. The reports provide valuable insightsinto the current state of deployment, types of technologies available and their costs andperformance. The analysis is based on a range of data sources with the objective ofdeveloping a uniform dataset that supports comparison across technologies of differentcost indicators - equipment, project and levelised cost of electricity – and allows fortechnology and cost trends, as well as their variability to be assessed.The papers are not a detailed financial analysis of project economics. However, they doprovide simple, clear metrics based on up-to-date and reliable information which can beused to evaluate the costs and performance of different renewable power generationtechnologies. These reports help to inform the current debate about renewable powergeneration and assist governments and key decision makers to make informeddecisions on policy and investment.The dataset used in these papers will be augmented over time with new project costdata collected from IRENA Member Countries. The combined data will be the basis forforthcoming IRENA publications and toolkits to assist countries with renewable energypolicy development and planning. Therefore, we welcome your feedback on the dataand analysis presented in these papers, and we hope that they help you in your policy,planning and investment decisions.Dolf GielenDirector, Innovation and Technology
ContentsKEY FINDINGSiLIST OF TABLES AND FIGURESii1. INTRODUCTION11.1 Different measures of cost1.2 Levelised cost of electricity generation2. SOLAR PHOTOVOLTAIC TECHNOLOGIES42.1 First-generation PV technologies: Crystalline silicon cells2.2 Second-generation PV technologies: Thin-film solar cells2.3 Third-generation PV technologies2.4 The Solar PV Resource2.5 Summary of PV technologies3. CURRENT GLOBAL PV MARKET TRENDS123.1 Total installed PV capacity3.2 Annual PV capacity additions3.3 Future projections of PV capacity growth4. COST AND PERFORMANCE154.1 Solar PV module price/cost4.2 Balance of system cost4.3 Total PV system costs5. PV SYSTEM COST REDUCTION POTENTIAL285.1 Cost reduction potential for c-Si PV modules5.2 Cost reduction potential for thin-film PV modules5.3 BOS cost reduction potentials5.4 Overall cost reduction potentials for PV systems5.5 PV module efficiency improvements6. LEVELISED COST OF ELECTRICITY FROM SOLAR PV386.1 LCOE ESTIMATES FOR 2011 TO 2015iiREFERENCES42ACRONYMS45Cost Analysis of Solar Photovoltaics
Key findings1. At the beginning of 2012, thin-film module prices (factory gate or spot) had fallen below USD 1/watt (W), with pricesbetween USD 0.84 and USD 0.93/W available. The prices of crystalline silicon (c-Si) modules are more varied, but weretypically in the range USD 1.02 to USD 1.24/W for the most competitive markets. PV module costs have a learningrate of 22%, implying that costs will decline by just over a fifth with every doubling of capacity. Continued rapid costreductions are likely due to the rapid growth in deployment, given that cumulative installed capacity grew by 71% in2011 alone.2. The total installed cost of PV systems can vary widely within individual countries, and between countries and regions.These variations reflect the maturity of domestic markets, local labour and manufacturing costs, incentive levels andstructures, and a range of other factors. At an average of USD 3.8/W for c-Si systems, Germany has the lowest PV systemcosts in the small-scale residential market ( 5 kW). In comparison, the average installed cost in 2011 in Italy, Spain, Portugaland the United States was between USD 5.7 to USD 5.8/W.3. Utility-scalesystems using thin-film amorphous silicon, Cadmium Telluride (CdTe) and Copper-Indium-GalliumDiselenide (CIGS) PV modules tend to have lower capital costs than residential systems in a given market, butthis is not always the case if tracking is included. Thin-film utility-scale systems had an average cost of aroundUSD 3.9/W in 2010, not substantially cheaper than the average cost of a residential c-Si system in Germanyin 2011.TABLE 1: TYPICAL COST AND PERFORMANCE VALUES FOR SOLAR PV SYSTEMSModule cost,factory gate or spot(2010 USD/W)Installed cost(2010 USD/W)Efficiency(%)Levelised cost ofelectricity(2010 USD/kWh)Residentialc-Si PV system1.02 – 1.243.8 – 5.8140.25 – 0.65c-Si PV system with battery storage1.02 – 1.245–6140.36 – 0.710.84 – 0.933.6 – 5.08–90.26 – 0.59Utility-scaleAmorphous Si thin filmNote: Assumes a 10% cost of capital.4. Despite the impressive declines in PV system costs, the levelised cost of electricity (LCOE) of PV remains high.The LCOE of residential systems without storage assuming a 10 % cost of capital was in the range USD 0.25 andUSD 0.65/kWh in 2011. When electricity storage is added, the cost range increases to USD 0.36 and USD 0.71/kWh.The LCOE of current utility-scale thin-film PV systems was estimated to be between USD 0.26 and USD 0.59/kWhin 2011 for thin-film systems.5. Despite the large LCOE range, PV is often already competitive with residential tariffs in regions with good solarresources, low PV system costs and high electricity tariffs for residential consumers. In addition, PV with storage is nowvirtually always cheaper than diesel generators for the provision of off-grid electricity.6. The prospects for continued cost reductions are very good. However, the rate at which PV costs will decline is highlyuncertain due to the very rapid growth in the PV market compared to the installed base and the high learning rate forPV. As a result, even small differences in scenarios for PV growth can have a big impact on the projected decline inmodule prices. Leaving aside this uncertainty, the installed costs of a c-Si residential system may decline from betweenUSD 3.8 to USD 5.8/W in 2011 to between USD 2.9 to USD 4.1/W in 2015 if current trends continue.Cost Analysis of Solar Photovoltaicsi
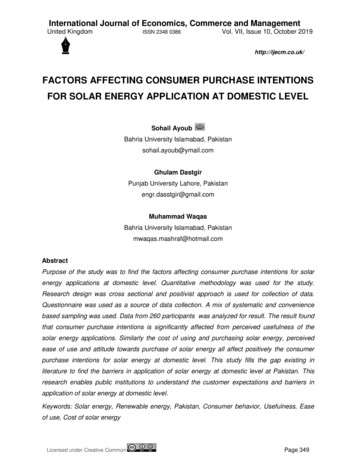
List of tablesTable 2.1: an overview and comparison of major PV technologies10Table 4.1: Summary of the worldwide market price of PV modules , Q4 2009 to Q1 201217Table 5.1: Crystalline Silicon PV module prices projections for European, North american and Japanese manufacturers, 2010 to 201528Table 5.2: Crystalline Silicon PV module prices projections for low-cost manufacturers; 2010 to 201529Table 5.3: Installed PV system cost projections for residential and utility-scale systems, 2010 to 203034Table 6.1: C-Si and thin-film PV system costs and LCoE, 2010 to 202039Table 6.2: Installed cost and efficiency assumptions for residential PV systems, 2010 to 201540Table 6.3: Installed cost and efficiency assumptions for utility-scale PV systems, 2011 to 201541List of figuresFigure 1.1: renewable power generation cost indicators and boundaries2Figure 2.1: Global mean horizontal irradiance8Figure 2.2: the solar PV resource in the united Statesii9Figure 3.1: Evolution of global cumulative installed capacity, 2000-201112Figure 3.2: EPIa scenarios for global annual new installed PV capacity, 2000 to 201514Figure 4.1: the global PV module price learning curve for c-Si wafer-based and Cdte modules, 1979 to 201516Figure 4.2: average worldwide PV module price level and their cost structure by technology (2010)16Figure 4.3: European and united States PV module factory-gate prices, Q1 2010 to Q1 201218Figure 4.4: Weighted average retail c-Si PV module price levels and structure in 201019Figure 4.5: Cost breakdown of current conventional PV systems in the united States , 201020Figure 4.6: Installed PV system prices for residential applications in different countries, 201123Figure 4.7: Cost breakdowns of typical utility-scale c-Si PV systems installed in Europe and the united States, Q1 2009 to Q4 201024Figure 4.8: System cost breakdown for residential, commercial and utility-scale c-Si PV systems in the united States, 201025Figure 4.9: Installed costs of utility-scale PV plants in 2010 ( 10 MW and 10 MW)26Figure 4.10: average prices and sizes of large utility-scale PV plants by country, 201027Figure 5.1: Crystalline silicon PV module cost projections, 2010 to 201529Figure 5.2: Single junction and tandem structures of amorphous silicon thin-film PV module cost breakdown and projections, 2010 to 201530Figure 5.3: CIGS thin film PV module cost breakdown and projections, 2010 to 201532Figure 5.4: Cdte thin film PV module cost breakdown and projections, 2010 to 201533Figure 5.5: average crystalline silicon and thin film PV system price forecasts for 2010 to 201535Figure 5.6: uS DoE Cost reduction goals to achieve uSD 1/W36Figure 5.7: theoretical solar cell maximum efficiency by PV technology36Figure 5.8: Current and projected PV module efficiency improvements to 201537Figure 6.1: LCoE scenarios for PV systems, 2010 to 203039Figure 6.2: retail electricity prices (2007) and the projected LCoE of PV systems (2020)40Figure 6.3: Illustrative LCoE of residential and utility-scale PV systems, 2010 and 201541Cost Analysis of Solar Photovoltaics
1. IntroductionRenewable energy technologies can help countries meet their policy goals for secure, reliable and affordableenergy to expand electricity access and promote development. This paper is part of a series on the costsand performance of renewable energy technologies produced by IRENA. The goal of these papers is to assistgovernment decision-making and ensure that governments have access to up-to-date and reliable information onthe costs and performance of renewable energy technologies.Without access to reliable information on the relativecosts and benefits of renewable energy technologiesit is difficult, if not impossible, for governments toarrive at an accurate assessment of which renewableenergy technologies are the most appropriate for theirparticular circumstances. These papers fill a significantgap in information availability because there is a lackof accurate, comparable, reliable and up-to-date dataon the costs and performance of renewable energytechnologies. The rapid growth in installed capacity ofrenewable energy technologies and the associated costreductions mean that even data one or two years oldcan significantly overestimate the cost of electricity fromrenewable energy technologies. There is also a significantamount of perceived knowledge about the cost andperformance of renewable power generation that is notaccurate or even misleading. Conventions on how tocalculate costs can influence the outcome significantlyand it is imperative that these are well-documented.1.1 DIFFErENt MEaSurES oF CoStCost can be measured in a number of different ways,and each way of accounting for the cost of powergeneration brings its own insights. The costs that can beexamined include equipment costs (e.g. PV modules),financing costs, total installed cost, fixed and variableoperating and maintenance costs (O&M), fuel costs andthe levelised cost of energy (LCOE).The analysis of costs can be very detailed, but forcomparison purposes and transparency, the approachused here is a simplified one. This allows greater scrutinyof the underlying data and assumptions, improvingtransparency and confidence in the analysis, as well asfacilitating the comparison of costs by country or regionfor the same technologies in order to identify what arethe key drivers in any differences.The three indicators that have been selected are:The absence of accurate and reliable data on the costand performance of renewable power generationtechnologies is therefore a significant barrier to theuptake of these technologies. Providing this informationwill help governments, policy-makers, investors andutilities make informed decisions about the rolerenewable energy can play in their power generationmix. This paper examines the fixed and variable costcomponents of solar photovoltaics (PV), by country andregion and provides the levelised cost of electricity fromsolar PV, given a number of key assumptions. This up-todate analysis of the costs of generating electricity fromsolar PV will allow a fair comparison of solar PV withother generating technologies.1»»Equipment cost (factory gate FOB anddelivered at site CIF);»»Total installed project cost, including fixedfinancing costs2; and»»The levelised cost of electricity.The analysis in this paper focuses on estimating the costof solar PV energy from the perspective of a privateinvestor, whether they are a state-owned electricitygeneration utility, an independent power producer oran individual or community looking to invest in small-IRENA, through its other work programmes, is also looking at the costs and benefits, as well as the macroeconmic impacts, of renewable powergeneration technologies. See WWW.IRENA.ORG for further details.2Banks or other financial institutions will often charge a fee, such as a percentage of the total funds sought, to arrange the debt financing of a project.These costs are often reported separately under project development costs.1Cost Analysis of Solar Photovoltaics1
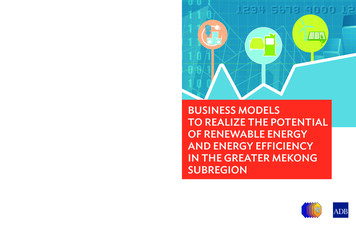
scale renewables (Figure 1.1). The analysis excludes theimpact of government incentives or subsidies, systembalancing costs associated with variable renewablesand any system-wide cost-savings from the meritorder effect3. Further, the analysis does not take intoaccount any CO2 pricing, nor the benefits of renewablesin reducing other externalities (e.g. reduced local airpollution, contamination of the environment). Similarly,the benefits of renewables being insulated from volatilefossil fuel prices have not been quantified. These issuesare important, but are covered by other programmes ofwork at IRENA.It is important to include clear definitions of thetechnology categories, where this is relevant, to ensurethat cost comparisons are robust and provide usefulinsights (e.g. off-grid PV vs. utility-scale PV). Similarly,it is important to differentiate between the functionalityand/or qualities of the renewable power generationtechnologies being investigated (e.g. PV with and withoutbattery storage). It is important to ensure that systemboundaries for costs are clearly set and that the availabledata are directly comparable. Other issues can also beimportant, such as cost allocation rules for combined heatand power plants, and grid connection costs.An important point is that, although this paper tries toexamine costs, strictly speaking, the data available areactually prices, and not even true market average prices,but price indicators. The difference between costs andprices is determined by the amount above, or below,the normal profit that would be seen in a competitivemarket. The rapid growth of renewables markets from asmall base means that the market for renewable powergeneration technologies is rarely well-balanced. As aresult, prices can rise significantly above costs in theshort-term if supply is not expanding as fast as demand,while in times of excess supply, prices may too low toearn a normal return on capital and losses can occur ifprices are below production costs. This makes analysingProject developmentSite preparationGrid connectionWorking capitalAuxiliary equipmentNon-commercial costTransport costImport leviesFactory gateEquipmentThe data used for the comparisons in this paper comefrom a variety of sources, such as business journals,industry associations, consultancies, governments,auctions and tenders. Every effort has been made toensure that these data are directly comparable and are forthe same system boundaries. Where this is not the case,the data have been corrected to a common basis usingthe best available data or assumptions. It is planned thatthis data will be complemented by detailed surveys of realworld project data in forthcoming work by the agency.On siteEquipmentProject costOperation &MaintenanceCost of financeResource qualityCapacity factorLife spanLCOELevelized cost of electricity(Discounted lifetime costdivided by discountedlifetime generation)FIGURE 1.1: RENEWABLE POWER GENERATION COST INDICATORS AND BOUNDARIES32See EWEA, Wind Energy and Electricity Prices, April 2010 for a discussionCost Analysis of Solar Photovoltaics
the cost of renewable power generation technologieschallenging and every effort is made to indicate whethercurrent equipment costs are above or below their longterm trend.The cost of equipment at the factory gate is oftenavailable from market surveys or from other sources.A key difficulty is often reconciling different sourcesof data to identify why data for the same period differ.The balance of capital costs in total project coststends to vary even more widely than power generationequipment costs, as it is often based on significant localcontent, which depends on the cost structure of wherethe project is being developed. Total installed costs cantherefore vary significantly by project, country and regiondepending on a wide range of factors.required. This often gives the impression of greateraccuracy, but when it is not possible to robustlypopulate the model with assumptions, or to differentiateassumptions based on real world data, then the“accuracy” of the approach can be misleading.The formula used for calculating the LCOE of renewableenergy technologies is:LCOE Σnt 1ΣIt Mt Ft(1 r)tnt 1Et(1 r)tWhere:1.2 LEVELISED CoSt oF ELECtrICItYGENEratIoNThe LCOE of renewable energy technologies varies bytechnology, country and project based on the renewableenergy resource, capital and operating costs, andthe efficiency / performance of the technology. Theapproach used in the analysis presented here is based ona discounted cash flow (DCF) analysis. This method ofcalculating the cost of renewable energy technologies isbased on discounting financial flows (annual, quarterlyor monthly) to a common basis, taking into considerationthe time value of money. Given the capital intensivenature of most renewable power generation technologiesand the fact that fuel costs are low, or often zero, theweighted average cost of capital (WACC), often alsoreferred to as the discount rate, used to evaluate theproject has a critical impact on the LCOE.There are many potential trade-offs to be consideredwhen developing an LCOE modelling approach. Theapproach taken here is relatively simplistic, given the factthat the model needs to be applied to a wide range oftechnologies in different countries and regions. However,this has the additional advantage that the analysis istransparent and easy to understand. In addition, moredetailed LCOE analyses result in a significantly higheroverhead in terms of the granularity of assumptionsLCOE the average lifetime levelised cost of electricitygeneration;It investment expenditures in the year t;Mt operations and maintenance expenditures in theyear t;Ft fuel expenditures in the year t;Et electricity generation in the year t;r discount rate; andn economic life of the system.All costs presented in this paper are real 2010 USD; that isto say, after inflation has been taken into account, unlessotherwise stated.4 The LCOE is the price of electricityrequired for a project where revenues would equal costs,including making a return on the capital invested equalto the discount rate. An electricity price above this wouldyield a greater return on capital, while a price below itwould yielder a lower return on capital, or even a loss.As already mentioned, although different cost measuresare useful in different situations, the LCOE of renewableenergy technologies is a widely used measure bywhich renewable energy technologies can be evaluatedfor modelling or policy development. Similarly, moredetailed DCF approaches taking into account taxation,subsidies and other incentives are used by renewableenergy project developers to assess the profitability ofreal world projects.An analysis based on nominal values with specific inflation assumptions for each of the cost components is beyond the scope of this analysis. Projectdevelopers will develop their own specific cash-flow models to identify the profitability of a project from their perspective.4Cost Analysis of Solar Photovoltaics3
2. Solar photovoltaictechnologiesPhotovoltaics, also called solar cells, are electronicdevices that convert sunlight directly intoelectricity5. The modern form of the solar cell wasinvented in 1954 at Bell Telephone Laboratories. Today,PV is one of the fastest growing renewable energytechnologies and it is expected that it will play a majorrole in the future global electricity generation mix.Solar PV systems are also one of the most “democratic”renewable technologies, in that their modular sizemeans that they are within the reach of individuals,co-operatives and small-businesses who want to accesstheir own generation and lock-in electricity prices.PV technology offers a number of significant benefits,including:»»Solar power is a renewable resource that isavailable everywhere in the world.»»Solar PV technologies are small andhighly modular and can be used virtuallyanywhere, unlike many other electricitygeneration technologies.»»Unlike conventional power plants using coal,nuclear, oil and gas; solar PV has no fuel costsand relatively low operation and maintenance(O&M) costs. PV can therefore offer a pricehedge against volatile fossil fuel prices.»»PV, although variable, has a highcoincidence with peak electricity demanddriven by cooling in summer and year roundin hot countries.A PV system consists of PV cells that are groupedtogether to form a PV module, and the auxiliarycomponents (i.e. balance of system - BOS), including theinverter, controls, etc. There are a wide range of PV celltechnologies on the market today, using different typesof materials, and an even larger number will be availablein the future. PV cell technologies are usually classifiedinto three generations, depending on the basic materialused and the level of commercial maturity:»»First-generation PV systems (fullycommercial) use the wafer-based crystallinesilicon (c-Si) technology, either singlecrystalline (sc-Si) or multi-crystalline (mc-Si).»»Second-generation PV systems (earlymarket deployment) are based on thin-filmPV technologies and generally includethree main families: 1) amorphous (a-Si)and micromorph silicon (a-Si/µc-Si); 2)Cadmium-Telluride (CdTe); and 3) CopperIndium-Selenide (CIS) and Copper-IndiumGallium-Diselenide (CIGS).»»Third-generation PV systems includetechnologies, such as concentrating PV(CPV) and organic PV cells that are stillunder demonstration or have not yet beenwidely commercialised, as well as novelconcepts under development.2.1 FIrSt-GENEratIoN PV tECHNoLoGIES:CrYStaLLINE SILICoN CELLSSilicon is one of the most abundant elements in theearth‘s crust. It is a semiconductor material suitablefor PV applications, with energy band gap6 of 1.1eV.Crystalline silicon is the material most commonly usedin the PV industry, and wafer-based c-Si PV cells andmodules dominate the current market. This is a mature5The Photovoltaic effect is when two different (or differently doped) semiconducting materials (e.g. silicon, germanium), in close contact with eachother generate an electrical current when exposed to sunlight. The sunlight provides the electrons with the energy needed to leave their bounds andcross the junction between the two materials. This occurs more easily in one direction than in the other and gives one side of the junction a negativecharge with respect to the other side (p-n junction), thus generating a voltage and a direct current (DC). PV cells work with direct and diffusedlight and generate electricity even during cloudy days, though with reduced production and conversion efficiency. Electricity production is roughlyproportional to the solar irradiance, while efficiency is reduced only slowly as solar irradiance declines.6The energy needed to produce electron excitation and to activate the PV process.4Cost Analysis of Solar Photovoltaics
technology that utilises the accumulated knowledge basedeveloped within the electronic industry. This type ofsolar cell is in mass production and individual companieswill soon be producing it at the rate of several hundredMW a year and even at the GW-scale. The manufacturingprocess of wafer-based silicon PV modules comprisesfour steps:1. Polysilicon production;2. Ingot/wafer production;3. Cell production; and4. Module assembly.Crystalline silicon cells are classified into three main typesdepending on how the Si wafers are made. They are:»»Monocrystalline (Mono c-Si) sometimesalso called single crystalline (sc-Si);»»Polycrystalline (Poly c-Si), sometimesreferred to as multi-crystalline (mc-Si); and2.2 SECoND-GENEratIoN PVtECHNoLoGIES: tHIN-FILM SoLar CELLSAfter more than 20 years of R&D, thin-film solar cellsare beginning to be deployed in significant quantities.Thin-film solar cells could potentially provide lower costelectricity than c-Si wafer-based solar cells. However,this isn’t certain, as lower capital costs, due to lowerproduction and materials costs, are offset to some extentby lower efficiencies and very low c-Si module costsmake the economics even more challenging. Thin-filmsolar cells are comprised of successive thin layers, just1 to 4 µm thick, of solar cells deposited onto a large,inexpensive substrate such as glass, polymer, or metal.As a consequence, they require a lot less semiconductormaterial to manufacture in order to absorb the sameamount of sunlight (up to 99% less material thancrystalline solar cells). In addition, thin films can bepackaged into flexible and lightweight structures, whichcan be easily integrated into building components(building-integrated PV, BIPV). The three primary typesof thin-film solar cells that have been commerciallydeveloped are:»»Amorphous silicon (a-Si and a-Si/µc-Si);»»EFG ribbon silicon and silicon sheet-definedfilm growth (EFG ribbon-sheet c-Si).Commercial production of c-Si modules began in 1963when Sharp Corporation of Japan started producingcommercial PV modules and installed a 242 Watt (W) PVmodule on a lighthouse, the world’s largest commercialPV installation at the time (Green, 2001). Crystallinesilicon technologies accounted for about 87% of globalPV sales in 2010 (Schott Solar, 2011). The efficiencyof crystalline silicon modules ranges from 14% to 19%(see Table 2.1).7 While a mature technology, continuedcost reductions are possible through improvementsin materials and manufacturing processes, and fromeconomies of scale if the market continues to grow,enabling a number of high-volume manufacturers toemerge.»»Cadmium Telluride (Cd-Te); and»»Copper-Indium-Selenide (CIS) and CopperIndium-Gallium-Diselenide (CIGS).Amorphous silicon solar cells, along with CdTe PV cells,are the most developed and widely known thin-film solarcells. Amorphous silicon can be deposited on cheap andvery large substrates (up to 5.7 m² of glass) based oncontinuous deposition techniques, thus considerablyreducing manufacturing costs. A number of companiesare also developing light, flexible a-Si modules perfectlysuitable for flat and curved su
List of tables List of figures Table 2.1: an overview and comparison of major PV technologies 10 Table 4.1: Summary of the worldwide market price of PV modules , Q4 2009 to Q1 2012 17 Table 5.1: Crystalline Silicon PV module prices projections for European, North american and Japanese manufacturers, 2010 to 2015 28 Table 5.2: Crystalline Silicon PV module prices projections for low-cost .