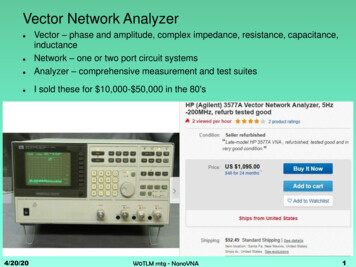
Transcription
Vector Network Analyzer1 Objectives To get acquainted with a vector network analyzer (VNA).To learn how to characterize networks at high frequencies.To learn how to measure scattering parameters.To explore the characteristics of microwave devices.2 Background Theory2.1 Transmission BasicsElectronic circuits which operate at high frequencies present some unique challenges for a propercharacterization. At high frequencies the wavelengths of operation become similar in dimension to thephysical properties of circuit elements. This results in circuit performance that is distributed in naturerather than describing the voltage and current at a specific circuit node. It is more appropriate todescribe how waves in a transmission medium respond to a component in their path. Networkanalyzers are a class of instruments that have been developed to characterize Radio Frequency (RF)components accurately and efficiently as a function of frequency. Network analysis is the process ofcreating a data model of the transfer and/or impedance characteristics of a linear network throughstimulus-response testing over the frequency range of interest. At frequencies above 1MHz, lumpedelements actually become circuit consisting of the basic elements plus parasitic elements like straycapacitance, lead inductance and unknown absorptive losses. Since parasitic depend on the individualdevice and its construction, they are almost hard to predict. Above 1 GHz, component geometries arecomparable to a signal wavelength, intensifying the variance in circuit behavior due to deviceconstruction. Network analysis is generally limited to the definition of linear networks. Since linearityconstrains networks stimulated by a sine wave to produce a sine-wave output, sine-wavetesting is an ideal method for characterizing magnitude and phase response as a function offrequency. This chapter discusses the key parameters used to characterize RF components,the types of network analyzer techniques used to make measurements and theconsiderations to be made in obtaining the most accurate results.2.2 Component CharacteristicsRF (frequencies less than 3 GHz) or microwave (frequencies in the 3 to 30 GHz range) energy can belikened to a light wave. Incident energy on a Device Under Test (DUT) (for example, a lens) is eitherreflected from or transmitted through the device (see Figure 1). By measuring the amplitude ratios andphase differences between the two waves it is possible to characterize the reflection (impedance) andtransmission (gain) characteristics of the device.2.3 Reflection and TransmissionThere are many terms used to describe these characteristics. Some use only magnitude information(scalar) and others include both magnitude and phase information (vector). If an incident voltage andcurrent waves on a device are denoted by Vincient, Iincident, the ratio of Vincient and Iincident is called thecharacteristic impedance Z0, and a device terminating a transmission system has an impedance calleda load impedance ZL, then the device characteristics can be defined by:Transmission terms:Reflection terms:Γ VreflectVincident VtransVincidentInsertion loss(dB) 20 log10 τ , Gain(dB) 20log10 τ Z L Z0, -1 Γ 1.Z L Z0Transmisson coefficient: τ where Γ : reflection coefficientVreflect, Vincident: reflected, incident waves on DUTZL, Z0: load, characteristic impedancesReturn loss (dB) 20 log10 Γ 20 log10 ρStanding wave ratio: SWR Vtrans: transmitted wave on DUT1 ρ1 ρ1
2.4 Scattering (S) ParametersMany component measurements are two-port networks, such as amplifiers, filters, cablesand antennas. These component characteristics are typically used to determine how aparticular device would contribute as a part of a more complex system. To provide amethod that models and analyzes a full two ports device in the RF environment, scatteringparameters (S parameters) are defined as follows:Sij biajak 0 , k jwhere aj denotes the wave entering the jth port, and bi denote the wave exiting the ith port.Once all S parameters are obtained, the relationship between the incoming and outgoingwaves can be written in terms of scattering matrix, [S], as:[b] [S][a], where [a],[b] are incoming, outgoing wave vectors, respectively.This is a characterization technique similar to a lower-frequency Z or Y modeling, exceptthat it uses incident, transmitted and reflected waves to characterize the input and outputports of a device as opposed to using voltage and current terms which are impossible tomeasure at high frequencies. The S parameter terms are related to other parameters withcertain conditions. For instance, S11 is equivalent to a device input reflection coefficientunder the condition the device has a perfect Z0 match on its output. S parametercharacterization of devices plays a key role in the ability of measuring, modeling anddesigning complex systems with multiple components. By definition, S parameters can bemeasured with a network analyzer.3 Vector Network AnalyzerA network analyzer measurement system can be set of four major parts: a signal source providing theincident signal, signal separation devices to separate the incident, reflected and transmitted signals, areceiver to convert the microwave signals to a lower Intermediate Frequency (IF) signals, a signalprocessor and a display section to process the IF signals and display detected information, as shown inFigure 1.Figure 1: The major elements of a network analyzer.The receiver performs the full S parameters which defined as:S11 reflected wave Areflected backward wave B; S 22 ; incident wave R1incident backward wave R22
S 21 transmitted wave Btransmitted backward wave A. ; S12 incident waveR1incident backward waveR23.1 Signal SourceThe signal source (RF or microwave) produces the incident signal used to stimulate the Device UnderTest (DUT). The DUT responds by reflecting part of the incident energy and transmitting theremaining part. By sweeping the frequency of the source the frequency response of the device can bedetermined. Frequency range, frequency stability, signal purity, output power level and level controlare factors which may affect the accuracy of a measurement. The source used for the networkanalyzer measurements, is a synthesizer, which characterized by stable amplitude frequency and ahigh frequency resolution (less than 100 Hz at microwave range).3.2 Signal SeparationThe next step in the measurement process is to separate the incident, reflected and transmitted signals.Once separated, their individual magnitude and/or phase differences can be measured. This can beaccomplished through the use of wideband directional couplers, bridges or power splitters. Adirectional coupler is a device that consists of two coupled transmission lines that are configured tocouple energy to an auxiliary port if it goes through the main port in one direction and not in theopposite direction. Directional couplers usually have relatively low loss in the mainline path and thuspresent little loss to the incident power. In a directional coupler structure (see Figure 1) the coupledarm samples a signal traveling in one direction only. The coupled signal is at a reduced level and therelative amount of reduced level is called the coupling factor. For instance a -20dB directional couplermeans that the coupled port power level is 20 dB below the input, which is equivalent to 1% of theincident power. The remaining 99% travel through the main arm. The other key characteristic of adirectional coupler is directivity. Directivity is defined as the difference between a signal detected inthe forward direction and a signal detected in the reverse direction (isolation between the forward andreverse signals). A typical directional coupler will work over several octaves with 30 dB directivity.The two-resistor power splitter (see Figure 1) is used to sample either the incident signal or thetransmitted signal. The input signal is split equally between the two arms, with the output signal(power) from each arm being 6dB below the input (power). A primary application of the powersplitter is for producing a measurement with a very good source match. If one side of the splitteroutput is taken to a reference detector and the other side goes through a DUT to a transmissiondetector, a ratio display of transmitted to incident has the effect of making the resistor in the powersplitter determine the equivalent source match of the measurement. Power splitters are verybroadband, have excellent frequency response and present a good match at the DUT input. Separationof the incident and reflected signals can be accomplished using either a dual directional coupler or asplitter.3.3 ReceiverThe receiver provides the means of converting and detecting the RF or microwave signals to a lowerIF or DC signals. There are basically two receiver techniques used in network analysis (see Figure 2).Figure 2: Fundamental and harmonics mixing receiverThe receivers are broadband tuned receivers that use either a fundamental mixing or harmonic mixinginput structure to convert an RF signal to a lower-frequency IF signal. The tuned receivers provide a3
narrowband-pass Intermediate-Frequency (IF) filter to reject spurious signals and minimized the noisefloor of the receiver. The vector measurement systems (tuned receivers) have the highest dynamicranges, are less suspect from harmonic and spurious responses, they can measure phase relationshipsof input signals and provide the ability to make complex calibrations that lead to more accuratemeasurements.3.4 Analyzing and DisplayOnce the RF signals have been detected, the network analyzer must process the detected signals anddisplay the measured values. Network analyzers are multichannel receivers utilizing a referencechannel and at least one test channel. Absolute signal levels in the channels, relative signal levels(ratios) between the channels, or relative phase difference between channels can be measured by thenetwork analyzer. Relative ratio measurements are usually made in dB, which is the log ratio of anunknown signal (test channel) with a chosen reference signal (reference channel). For example, 0 dBimplies that the two signal levels have a ratio of unity, while /-20 dB implies a 10: 1 voltage ratiobetween two signals. All network analyzer phase measurements are relative measurements, with thereference channel signal considered to have zero phase. The analyzer then measures the phasedifference of the test channel with respect to the reference channel.4 Operator Calibration4.1 GeneralAll real measurement systems are affected by three types of measurement errors:* Systematic errors.* Random errors.* Drift errors.Calibration is a set of operations which improve measurement accuracy by means of compensation forsystematic measurement errors (repeatable measurement variation).4.2 Systematic ErrorsSystematic errors are caused by non-perfect devices. We assume that these errors do not change overtime, therefore they can be characterized and mathematically removed during the calibration process.Systematic errors are related to (see Figure 3):* Frequency response errors during transmission or reflection measurements.* Signal leakage within or between components of the system, directivity and crosstalk errors.* Impedance mismatch due to unequal input and output impedance of the DUT and the networkanalyzer.Manufacturers assume that the operator takes care of random errors that are caused by connectorsrepeatability and by the cables.4.3 Random ErrorsRandom errors vary randomly as a function of time (amplitude and phase). Since there is no way topredict them, they cannot be removed. Sources of random errors are:* Internal noise of the instrument.* Connector and adapters.* Cables.As it mention above it is impossible to remove these errors, but it is possible to minimize their effectsby:Internal noise:* Increasing source power.* Narrowing IF filter.* Using trace averaging.Connectors and adapter care Connector repeatability is a source of random measurement errors. Forall connectors and adapters, you have to frequently do the following:* Inspect all the connectors for damage or visual defect.* Clean the connectors.* Use high quality, well known and preserved connectors and adapters.4
Cables Care Coaxial cables connecting the DUT to the analyzer. Cables can cause random errors,you have to frequently do the following:* Inspect for unusual lossy cables.* Inspect for damage cable connectors.* Inspect for cables which change response when flexing (this may indicate for damage near theconnectors).It is strongly recommended to use known high quality and well preserved cables, if high accuracymeasurement is needed.4.4 Drift ErrorsDrift errors occur when the test results of measurements change, after calibration has been performed.They are primary caused by temperature variation. These errors can be minimized by frequentlycalibration or use the equipment in a controlled temperature range, such as 25 5 C.Figure 3: Error correction due to calibration5 Measurements5.1 CalibrationBefore performing measurements, calibration is required to improve the accuracy of themeasurements. The one-path 2-port calibration1 provides directivity, source match, loadmatch, isolation and frequency response vector error correction, in only forward directionfor transmission and reflection measurements of two-port devices. This calibration providesthe best magnitude and phase measurement accuracy for both transmission and reflectionmeasurements of two-port devices.One-path 2-port calibration procedure (See figure 4 and also the manual for the reference)1. Turn on the Network Analyzer.2. Press Cal.3. Click Cal Kit to select Calibration Kit.4. Click Calibrate.5. Click One Path 2-Port Cal.6. Click Select Port to select a test port (and corresponding S parameter) on which 1-port calibrationwill be performed.7. Connect an OPEN calibration standard to the selected test port (connector to which the DUT is tobe connected).8. Click Open to start the calibration measurement. Also observe the S11 on the display.9. Connect a SHORT calibration standard to the selected test port (connector to which the DUT is tobe connected).10. Click Short to start the calibration measurement. Also observe the S11 on the display.1For both forward and reverse directions, “the full 2-port calibration” is required.5
11. Connect a LOAD calibration standard to the selected test port (connector to which the DUT is tobe connected). Click Load to start the calibration. Also observe the S11 on the display.12. Make a between the selected test ports (between the connectors to which the DUT will beconnected).13. Click Thru to start the calibration measurement.14. Click Done to terminate the One Path 2-Port Calibration calibration process. Upon pressing thiskey, calibration coefficients will be calculated and saved. The error correction function will also beautomatically VNAbled.Figure 4: One-path 2-port calibration5.2 S-parameter Measurements1. Connect the antenna (1-port device) to port 1, and measure both magnitude and phase ofS11. Record the frequency response and find the 3-dB bandwidth.2. Connect the bandpass filter (2-port device) between port 1 and port 2, and measure bothmagnitude and phase of both S11 and S21. Record the frequency response and find the 3-dBbandwidth.3. Make sure that the attenuation is set to be 0 dB, then connect the attenuator (2-portdevice) between port 1 and port 2, and measure both magnitude and phase of both S11 andS21. Record the frequency response. Then change the attenuation to 10 dB, 20 dB, and 30dB, respectively, and record the frequency response for each case.4. Connect the coaxial cable (RG58) between port 1 and port 2, and measure bothmagnitude and phase of both S11 and S21 at 10,20,30,50,100,200,300,500,1000,1300 MHz tobe used in characteristic impedance (Z0) and propagation constant (γ) analyses.NOTE Change frequency range and scale for proper measurements.6 Final Report1. Show all the measurement results. Also convert dB unit to linear magnitude scale.2. Find the characteristic impedance and propagation constant from the measurement resultsand compare them with the data given in the data sheet file (rg58.pdf).3. Summarize what you have found from the measurements.7 Postlab Questions1. Explain how to use this vector network analyzer to measure S-parameters of a devicewith more than 2 ports.2. Explain how to obtain the parameters R, L, G, C of the RG58 coaxial cable.6
Vector Network Analyzer 1 Objectives To get acquainted with a vector network analyzer (VNA). To learn how to characterize networks at high frequencies. To learn how to measure scattering parameters. To explore the characteristics of microwave devices. 2 Background Theory 2.1 Transmission Basics