Transcription
To appear in InterfacesAssessing Golfer Performance on the PGA TOURMark BroadieGraduate School of BusinessColumbia Universitymnb2@columbia.eduOriginal version: April 27, 2010This version: April 8, 2011AbstractThe game of golf involves many different types of shots: long tee shots (typically hit with a driver),approach shots to greens, shots from the sand, putts on the green, and others. While it is easyto determine the winner in a golf tournament by counting strokes, it is not easy to assess whichfactors most contributed to the victory. In this paper we apply an analysis based on strokes gained(previously termed shot value) to assess the performance of golfers in different parts of the gameof golf. Strokes gained is a simple and intuitive measure of the contribution of each shot to agolfer’s score. Strokes gained analysis is applied to extensive ShotLinkTM data in order to rankPGA TOUR golfers in various skill categories and to quantify the factors that differentiate golferson the PGA TOUR. Long game shots (those starting over 100 yards from the hole) explain abouttwo-thirds of the variability in scores among golfers on the PGA TOUR. Tiger Woods is rankednumber one in total strokes gained and he is ranked at or near the top of PGA TOUR golfers ineach of the three main categories: long game, short game and putting. His dominance is a result ofexcelling at all phases of the game, but his long game accounts for about two-thirds of his scoringadvantage relative to the field. A similar approach is used to rank PGA TOUR courses in termsof overall difficulty and difficulty in each part of the game. A preliminary analysis shows that therecent change in the groove rule for irons by the United States Golf Association (USGA) has hadalmost no impact on scores from the rough.Acknowledgement:Thanks to the PGA TOUR for providing the ShotLinkTM data. Thanksalso to Kin Lo of the PGA TOUR, Richard Rendleman and Soonmin Ko for helpful discussionsand comments, Lou Lipnickey for extensive programming on the project, Alexsandra Guerra forassistance with the data and the USGA for supporting the initial development of the Golfmetricssoftware.1
1.IntroductionA golf score tells how well a golfer played overall, but does not reveal what factors contributed mostto that score. The goal of this paper is to analyze the play of PGA TOUR professional golfers inorder to understand and quantify the contributions of different categories of golf shots (e.g., longgame, short game and putting) in determining a total golf score for an eighteen-hole round. Thisperformance attribution analysis is used to rank golfers in various skill categories. The relativeimpact of each skill category on overall score is also examined.Golf fans know that Tiger Woods is the best golfer of his generation, but it is often debatedwhether his low scores are primarily due to superior putting, wedge play around the greens, driving,or some other factor or combination of factors. Sweeney (2008) writes: “What really differentiatesWoods from everyone else is his ability to make more putts from the critical range of 10 to 25 feet.”In June 2010, U.S. Open winner Geoff Ogilvy said, “I think by now every player on tour is awarethat the biggest reason Tiger is the best is because he putts the best.” (Diaz, 2010). In spite ofthese assertions, it is not clear whether putting is the most important factor contributing to Tiger’sscoring advantage.This paper shows that Tiger Woods’ scoring advantage in the years 2003-2010 was 3.20 strokesper round better than an average tournament field. Tiger is ranked at or near the top of PGATOUR golfers in all three categories (long game, short game and putting), and his dominance is aresult of excelling at all phases of the game. But Tiger’s long game accounts for 2.08 of the total3.20 stroked gained per round, so about two-thirds of his scoring advantage comes from shots over100 yards from the green. Tiger’s putting advantage versus the field is 0.70 shots per round, whilehis short game contributes 0.42 shots per round. Even though he is a phenomenal putter, his gainfrom putting is less than the 1.01 strokes he gains from shots starting between 150 and 250 yardsfrom the hole, and comparable to the 0.70 strokes he gains from long tee shots.Performance attribution analysis is difficult using the current standard golf statistics, many ofwhich involve relatively crude counting measures. For example, the fairways hit statistic is thecount of the number of fairways hit on a long tee shot (i.e., on par-4 and par-5 holes) divided bythe number of tee shots. One problem with this statistic is that it doesn’t distinguish betweenshots which barely miss the fairway, from shots that miss the fairway by a large amount and endup behind trees, in water, or out of bounds. Many standard golf statistics have the drawbackthat they mix several parts of the game together. For example, the sand save statistic counts thenumber of times a golfer gets the ball in the hole in one or two shots from a greenside sand bunkerdivided by the number of attempts. However, this statistic mixes together sand play with putting,making it difficult to isolate sand shot skill from putting skill. It is useful to have shot locationinformation in order to better measure driving skill, sand play and putting skill. The PGA TOURhas collected this type of detailed data using their ShotLinkTM system since 2003.In this paper, detailed shot data is used to assess and rank the performance of PGA TOURgolfers in three main parts of the game: the long game (shots over 100 yards from the hole), the2
short game (shots under 100 yards from the hole, excluding putts), and putting (shots on the green).The performance analysis is based on the concept of strokes gained (see Broadie 2008, where theterm shot value was used instead of strokes gained), which measures the quality of each shot basedon its starting and ending locations. As pointed out in Broadie and Ko (2009), the strokes gainedmetric is related to the value function of a dynamic program. If, for example, a golfer hits a poorsand shot followed by great putt, the sand shot will have a negative strokes gained value while theputt’s strokes gained value will be positive. This approach allows each shot to be measured on itsown merits, which is not possible with the sand save statistic which combines both shots. Just asgolf scores are often compared to the benchmark of par, strokes gained represents the quality of ashot relative to a benchmark defined by the average performance of PGA TOUR golfers. Addingstrokes gained for shots in a given category gives a performance measure for that category and isuseful in understanding a golfer’s strengths and weaknesses and in comparing one golfer to another.Strokes gained analysis is used to determine what separates the top golfers on the tour from others.Since the publication of the landmark book by Cochran and Stobbs (1968), a large literature onthe scientific and statistical analysis of golf has developed. Recent surveys include Penner (2003),Farrally et al. (2003) and Hurley (2011). Statistical analysis of amateur golfers was done in Riccio(1990). An early attempt to quantify the value of a shot was given in Landsberger (1994). Severalpapers have investigated which golf skill factors are most important in determining earnings inprofessional tournaments. Examples include Davidson and Templin (1986), Shmanske (1992), Moyand Liaw (1998), Berry (1999), Berry (2001), Nero (2001), Callan and Thomas (2007), Shmanske(2008) and Puterman and Wittman (2009). Most of these studies were limited by the lack ofdetailed shot information and had to rely on standard golf statistics (e.g., putting average, sandsave percent, fairways hit, etc.). The strokes gained approach used in this paper directly decomposesa golfer’s score by the quality of each shot, and is an alternative to the regression analyses used inmany earlier studies.Strokes gained analysis was introduced in Broadie (2008), primarily to determine which skillsmost separate the play of professional and amateur golfers. Putting performance on the PGATOUR was investigated in Fearing et al. (2010), also using strokes gained analysis. In their study,the putting benchmark was adjusted to account not only for the distance to the hole, but also thedifficulty of the green on each hole and the quality of putters in each tournament. Larkey (1994) andBerry (2001) represent early efforts to adjust tournament results for course difficulty and golfer skillfactors. More recently, Connolly and Rendleman (2008) employed a statistical model in order toinvestigate golfer skill and streaky play on the PGA TOUR. The important idea in Larkey (1994),Berry (2001), Connolly and Rendleman (2008) and Fearing et al. (2010), is that overall scores andnumber of putts depend on golfer skill and on the difficulty of the course. Fewer putts are sunkon bumpy greens and scores are higher on more difficult courses, e.g., those with narrow fairways,deep rough and many water hazards. However, discerning the difficulty of a course is problematicwhen golfer skill is unknown: scores could be high because of less skill or a more difficult course.3
The issue of disentangling golfer skill from course difficulty in golf scores also arises in creating golfhandicaps for amateur golfers. For issues related to golf handicapping, see Pollock (1974), Scheid(1977) and Stroud and Riccio (1990).This paper extends the analysis in Broadie (2008) in several ways. First, a benchmark functionrepresenting the average strokes to complete a hole is estimated for PGA TOUR golfers. Thebenchmark is interesting in itself, because it summarizes the skill of PGA TOUR golfers in various shot categories. A component of estimating the benchmark is the automatic identification ofrecovery shots. An estimation procedure is used to simultaneously estimate the difficulty of eachcourse and round and to adjust the strokes gained results for the difficulty factors. In addition toproviding a better measure of golfer performance, this procedure allows courses to be ranked interms of overall difficulty and difficulty in each part of the game. Finally, the analysis is appliedto a database of more than eight million shots by PGA TOUR golfers, leading to many interestingresults, including the relative importance of the long game versus the short game.In the next section the strokes gained concept is defined and illustrated. The construction ofa benchmark function representing the average strokes to complete a hole for PGA TOUR golfersis described in Section 3. In Section 4 the strokes gained approach is applied to rank PGA TOURgolfers and analyze the factors that differentiate golfers on the PGA TOUR. PGA TOUR coursesare ranked as well. A preliminary analysis of the effect of the USGA’s groove rule change is alsopresented. Brief concluding remarks are given in Section 5.2.Strokes gainedIn this section the strokes gained concept is defined, examples are given and a simple but importantadditivity property of strokes gained is presented. The connection of strokes gained with dynamicprogramming is mentioned at the end of the section.Strokes gained is a simple and intuitive quantitative measure of the quality of a golf shot.Suppose a function J(d, c) has been estimated, where d represents the distance to the hole fromthe current location (not the distance of the shot), c represents the condition of the current balllocation (i.e., green, tee, fairway, rough, sand or recovery) and J is the average number of strokesa PGA TOUR golfer takes to finish the hole from the current location. For brevity, J will oftenbe referred to as the benchmark. Define the strokes gained of the ith shot on a hole that starts at(di , ci ) and finishes at (di 1 , ci 1 ) to be(1)gi J(di , ci ) J(di 1 , ci 1 ) 1.Strokes gained represents the decrease in the average number of strokes to finish the hole fromthe beginning of the shot to the end of the shot, minus one to account for the stroke taken. Forexample, suppose the average number of shots to complete the hole is 2.6 from a position in thefairway forty yards from the hole. If the golfer hits the shot to one foot from the hole, where the4
average number of shots to complete the hole is 1.0, then equation 1 attributes a gain of 0.6 strokesto the shot: it reduced the average number of shots to complete the hole by 1.6 and it took oneshot to do so, for a gain of 0.6. In general, a positive gi indicates that a shot is better than a PGATOUR golfer’s average shot, while a negative gi indicates that a shot is worse than average.The units of strokes gained are strokes, e.g., a strokes gained value of 0.1 means the shot is 0.1strokes worse than the benchmark. Because the units are the same for different types of shots, e.g.,long shots and putts, the strokes gained metric offers a consistent method for evaluating differentaspects of the game of golf. The strokes gained approach solves the problem of incommensurablemeasures in standard golf statistics that was pointed out in Larkey and Smith (1999).To give an example of strokes gained, suppose that PGA TOUR golfer A plays a long par-3that takes the PGA TOUR field an average of 3.2 strokes to complete the hole. Golfer A’s tee shotfinished on the green, leaving a 16-foot putt for birdie. From 16 feet, the PGA TOUR field takes anaverage of 1.8 putts to finish the hole. The PGA TOUR field will one-putt about 20% of the time,two-putt about 80% of the time, and rarely three-putt from 16 feet (1.8 20%(1) 80%(2) 0%(3)).The ball started in a spot where the benchmark is 3.2 and finished at a position where the benchmarkis 1.8, so the strokes gained for the shot is 3.2 1.8 1 0.4. Golfer A left his birdie putt oneinch short. His ball started in a spot where the benchmark is 1.8 and finished in a spot where thebenchmark is one (the average number of shots to finish the hole for a tap-in is one), for a strokesgained value of: 1.8 1 1 0.2. Golfer A’s missed putt represents a loss of 0.2 shots relative tothe benchmark, because he reduced the average number of strokes to complete the hole by 0.8 buthe used one putt to do so. Because a PGA TOUR golfer only sinks 20% of 16-footers, missing thisputt doesn’t cost a full shot: it really only costs 0.2 strokes. To complete the example, golfer Atapped-in for par. The strokes gained equation (1) gives a value of zero for this putt, becausehe reduced the benchmark from one to zero using one shot. This makes sense, because sinking aone-inch putt neither gains nor loses shots relative to the benchmark.The strokes gained metric has a simple but important additivity property: the strokes gained ofa group of shots is the sum of the strokes gained of the individual shots. Suppose a golfer takes nshots on a hole. Then the total strokes gained for the n shots is:(2)nXi 1gi nX(J(di , ci ) J(di 1 , ci 1 ) 1) J(d1 , c1 ) ni 1because of the telescoping sum and J(dn 1 , cn 1 ) 0 for the last shot which ends in the hole. Inthe previous example, golfer A’s score of n 3 represents a net gain of 0.2 strokes compared to thebenchmark of J(c1 , d1 ) 3.2 from the tee. Golfer A did this with a great tee shot ( 0.4 strokesgained), a disappointing putt ( 0.2 strokes gained), and a tap-in (0 strokes gained), for a totalstrokes gained of 0.2 for the hole, consistent with equation (2).Let’s consider PGA TOUR golfer B playing the same par-3 hole. Golfer B’s tee shot missedthe green long and left. From this position in the rough, suppose the average number of shots to5
complete the hole (the benchmark) is 2.6. The strokes gained equation (1) gives: 3.2 2.6 1 0.4,so golfer B lost 0.4 strokes compared to the PGA benchmark. Golfer B hit his second shot from therough to inside of four feet from the hole, where the benchmark score is 1.1 (a PGA TOUR golfersinks about 90% of these putts). Applying equation (1) gives: 2.6 1.1 1 0.5, so golfer B’ssecond shot gained a half-stroke compared to the benchmark. Golfer B sunk the four-footer andthe strokes gained equation gives 1.1 0 1 0.1. Golfer B’s score of three also represents anet gain of 0.2 strokes compared to the benchmark value of 3.2 from the tee. Golfer B did thiswith a poor tee shot ( 0.4 strokes gained), a good chip from the rough (0.5 strokes gained), and aone-putt (0.1 strokes gained), for a total of 0.2 strokes gained for the hole.Golfers A and B had the same score on the hole, but they did it in very different ways. If thiswas a representative example, we could see that golfer A has a great long game, while golfer B hasa great short game. Strokes gained allow us to compare golfer A’s game to golfer B’s, both in totalstrokes gained (for the hole, round, or season) and in various categories (e.g., long game, shortgame, and putting). This observation can be formalized by decomposing the total strokes gainedfor a round into different categories as follows:mX(3)gi i 1Xgi Xi Si Lgi Xgii Pwhere m is the total number of shots in a round, L is the set of indices corresponding to longgame shots, S is the set of indices corresponding to short game shots, P is the set of putts andwhere {1, 2, . . . , m} L S P. In a similar way, the strokes gained for a given category can befurther decomposed into subcategories. For example, the total strokes gained of all long game shotscan be split into the sum of strokes gained for tee shots and approach shots from various distancecategories. Unlike fraction of greens hit, proximity to the hole, or other statistical measures, thestrokes gained approach provides a consistent way to quantify the value of shots in various categoriesand subcategories.The game of golf can be modeled as a dynamic program. The score on a hole depends on thestrategy and results of each of the shots on the hole. The optimal strategy from the tee dependson all of the possible outcomes of the first shot and the optimal strategy for the second shot, whichdepends on all of the possible outcomes of the second shot and the optimal strategy for the thirdshot, etc. The solution of a dynamic program involves starting from the last stage, in this casethe shot which ends in the hole, and working backwards to determine the optimal strategy. TheBellman (1957) equation says:(4)J(di , ci ) min E[J(di 1 , ci 1 ) 1 (di , ci , µ)]µwhere the expectation is taken over (di 1 , ci 1 ), the random distance and condition of the end ofshot i, given its start at (di , ci ) and the strategy µ (e.g., target and club) chosen by the golfer.6
For more detail, see Broadie and Ko (2009). This paper does not address the strategy choices ofgolfers, but PGA TOUR golfers are among the best golfers in the world, so it is not unreasonableto assume that they play optimal or nearly optimal strategies and the observed data can be used toestimate J(di , ci ) E[J(di 1 , ci 1 ) 1 (di , ci , µ )], where µ represents an optimal strategy. Nowan individual shot can be measured by the difference in the left and righthand sides of the equationfor a particular outcome, i.e., by J(di , ci ) J(di 1 , ci 1 ) 1, which is the strokes gained definitiongiven in equation (1). This dynamic program viewpoint provides the justification for the strokesgained definition.3.PGA TOUR benchmarkThe strokes gained computation is based on a benchmark function that gives the average numberof strokes for PGA TOUR golfer to complete a hole. The benchmark typically increases withthe distance to the hole and depends on the course condition at the location of the ball, i.e., tee,fairway, rough, green, sand or recovery. Shots from the rough are more difficult than shots fromthe fairway, and the benchmark is larger as a consequence. There are situations, typically fromthe rough, where a direct shot to the hole is impossible because the path is blocked by trees orother obstacles. In this case a golfer may elect to play a recovery shot, i.e., a short shot that is hitback to the fairway rather than directly toward the hole. Recovery shots are placed in their owncategory in order to better estimate the differential effects of fairway and rough. The estimation ofthe benchmark function, the recovery shot identification procedure and empirical results are givenin this section.The results in this paper are based on the PGA TOUR’s extensive ShotLink database, whichincludes all shots at PGA TOUR tournaments from 2003 to 2010. The data is collected by 250volunteers at each tournament. The ShotLink database contains more than eight million shots(about one million shots per year), with shot locations measured to within one inch on putts andone foot on other shots. Further information on the ShotLink system is given in Deason (2006).The ShotLink database does not include detailed shot information for the four major tournaments:the Masters, U.S. Open, British Open and the PGA.The benchmark function (the average number of shots to complete the hole) needs to be definedin terms of observable information recorded in the database. Not all shots from the fairway with125 yards to the hole are equal in difficulty, since there are many other factors involved: the ball’s liemight be perfect or in a divot, the golfer’s stance might be level or on a hill, the wind could be calmor gusting, etc. All of these other factors affect the difficulty of a shot and the average numberof shots to complete the hole. However, the benchmark can only be computed from observableinformation, and the ShotLink database includes the most important of these factors: the distancefrom the hole and the condition of the ball (e.g., tee, fairway, green, sand, or rough). The benchmarkfunction can be interpreted as an average over these other unobservable factors.7
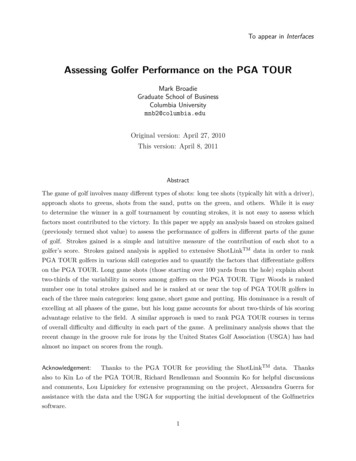
The goal is to estimate the benchmark function J(d, c), where d represents the distance to thehole from the current location and c represents the condition of the current location (i.e., green, tee,fairway, rough, sand or recovery). Statistical and model-based approaches are two main ways toaccomplish this. Statistical procedures include simple interpolation, linear regression, splines, kernelsmoothing and other methods. In model-based approaches a parametric analytical or simulationmodel is formulated and optimization is used to determine the model parameters that best fit thedata. Both approaches attempt to find a benchmark that is close to the data and appropriatelysmooth to take into the noise in the data.The large size of the database allows for accurate estimation of the benchmark, since in mostdistance and condition categories, there are many shots available to estimate the average scoreto complete the hole. Experimentation with several approaches yielded similar results. Piecewisepolynomial functions were used as the form of the benchmark, except for putts on the green.For putts on the green, a model-based approach is used to fit one-putt probabilities based on asimplification of the putting model presented in Broadie and Bansal (2008). This is combined witha statistical model for three-putts to give an average score function for putts on the green. Thisapproach is used to smooth the somewhat limited data for long putt distances.3.1.Tee shot benchmarkFrom the tee, a simple linear regression of average score (J) on the distance to the hole (d, measuredin yards) for PGA TOUR pros using 2003-2010 data gives: J 2.38 0.0041d. The distance tothe hole d is measured along the fairway from the tee to the hole (i.e., the dogleg distance, not thedirect “as the crow flies” distance). In this regression, the data are grouped into 20-yard distancebuckets and the R2 of the regression is over 98%. The slope of the equation implies that everyadditional 100 yards of hole distance adds 0.41 strokes to the average score of a PGA TOUR pro.(This regression is similar to the result 2.35 0.0044d obtained in Cochran and Stobbs (1968),based on a smaller set of data collected from a single British professional tournament in 1964.)In spite of the high R2 , a linear regression does not provide an adequate fit to the data as shownin Figure 1. In particular, the average score from the tee exhibits a jump between long par-3 holesat 235 yards and short par-4 holes at 300 yards (there is little data between these distances). Thecomputations in the paper are based on a more accurate piecewise polynomial fit to the data. Theresults are given in Appendix A.Broadie (2008) finds that the average score from the tee is 2.79 0.0066d for golfers whose 18hole average score is 90 (i.e., 90-golfer). The slope implies that every additional 100 yards of holedistance adds 0.66 strokes to the average score of 90-golfers, while for PGA TOUR pros it adds 0.41strokes. The USGA refers to this slope as the ability to overcome distance. For 90-golfers, goingfrom 180 yards (par-3 distance) to 580 yards (par-5 distance) will increase their average score byabout 2.6. But the par goes up by 2, so 90-golfers do worse relative to par on par-5 holes comparedto par-3 holes. Going from a hole of 180 yards (par-3 distance) to 580 yards (par-5 distance), pros8
Average score5.04.54.03.53.02.5100200300400Distance to hole500600Figure 1: Average score from the tee for PGA TOUR golfers in 2003-2010. Distance to the hole ismeasured along the fairway from the tee to the hole, not “as the crow flies.”will see an average score increase of 1.6. The par goes up by two, so the pros do better relative topar on par-5 holes compared to par-3 holes. The main reason is the 290-yard average distance thatthe pros drive the ball, compared to an average drive of about 210 yards for 90-golfers. (Of course,on par-5 holes 90-golfers have more chances to flub shots or hit into trouble.)3.2.Benchmark within 50 yards of the holeIn this subsection average strokes to complete the hole from the sand, rough and fairway arecompared on shots within 50 yards of the hole. It is often claimed that professional golfers are sogood from the sand that they would rather be in the sand than in the rough. Figure 2 illustratesthe data and the fitted curves. The figure shows that when the distance to the hole is less than 15yards or greater than 34 yards, sand shots have larger average strokes to complete the hole thanshots from the rough from the same distance. In the range from 15 yards to 34 yards, sand shotsare easier than shots from the rough, on average. Conditioned on the shot starting within 50 yardsof the hole, the average initial distance to the hole for shots from the sand and rough is 16 yards,just about the distance of equal difficulty for sand and rough shots. The average score can betranslated into an up-and-down fraction, i.e., the fraction of the time it takes two or less shots tofinish the hole. From 15 yards from the hole, pros get up-and-down 51% of the time from the roughor sand and 69% of the time from the fairway. At 25 yards from the hole, pros get up-and-down42% of the time from the sand, 35% from the rough and 54% of the time from the fairway. Theseare averages over all situations; note that the outcome for an individual shot will depend on theball’s lie, the contour of the green near the hole and other factors. However, the distance from thehole and condition of the ball are primary factors in determining the average number of shots tocomplete the hole.9
Average strokes to complete istance to holeFigure 2: Average strokes to complete the hole from the rough, sand and fairway for PGA TOURgolfers in 2003-2010.3.3.Putting benchmarkIn this subsection the estimation of the benchmark function for putts is discussed. The benchmarkis fit in three steps. First, a one-putt probability function is fit, then a three-putt function is fit,and then these two are combined into a benchmark average putts-to-complete-the-hole function.This approach is followed for several reasons. First, the data is sparse and noisy for long putts(e.g., greater than 50 feet from the hole) and so smoothing is necessary. Second, the procedureworks well for fitting smaller data sets and it is useful to have a consistent procedure for all sets ofdata. Finally, golfers think in terms of one-putts and three-putts, so these models and results areof independent interest.The one-putt probability function is based on a simple physical model for putts. Putting skillis modeled with two components: a random distance and a random direction, both independentlydistributed normal random variables. The random direction of the putt with respect to the holeis α, with α N (0, σα2 ), so angular putt errors have a standard deviation of σα . The putt rolls arandom distance l with l N (d t, (d t)2 σd2 ), where d is the initial distance to the hole and t isthe target distance beyond the hole (all measured in yards). The standard deviation of the distancea putt rolls, (d t)σd , is proportional to the intended target distance d t. If t 1/2 yards itmeans the golfer aims to hit the putt 1.5 feet beyond the hole. For the putt to have a chance offinishing in the hole, the angle must satisfy α αc tan 1 (r/d), where d is the distance to thehole and r is the radius of the hole (2.125 inches). In addition, the distance the putt rolls, l, mustbe at least d, otherwise the putt will not reach the hole. If the putt is hit too hard (even if hitstraight at the hole) and rolls a distance greater than d h, it will also not result in a holeout.A holeout occurs if the putt rolls a distance l satisfying d l d h and is hit with an angle10
satisfying α αc .This model is a generalization of the Gelman and Nolan (2002) model which only takes puttdirection into account. It is a simplification of Broadie and Bansal (2008), which models distance,direction and green reading errors, but is not analytically tractable and requires simulation toevaluate. The holeout criterion is u
Graduate School of Business Columbia University mnb2@columbia.edu Original version: April 27, 2010 This version: April 8, 2011 To appear in Interfaces Abstract The game of golf involves many different types of shots: long tee shots (typically hit with a driver), approach shots to greens, shots from the sand, putts on the green, and others .