Transcription
ALA WAI CANAL PROJECTOAHU, HAWAIISECTION 209 OF FLOOD CONTROL ACT OF 1962(PUBLIC LAW 87-874)APPENDIX BECONOMIC ANALYSISHonolulu DistrictSeptember 2016March 2017THIS DRAFT DOCUMENT IS BASED ON THE INFORMATION AVAILABLE AT THE TIME OF PUBLICATION. TheCorps of Engineers planning process is dynamic and responsive to public and stakeholder input; it is possible that the contentherein may change as a result of review comments received. This document does not necessarily represent the perspective ofhigher review levels within the agencies involved or the Executive Branch of the federal government.
ALA WAI CANAL PROJECT FEASIBILITY STUDY,OAHU, HAWAIIDRAFT ECONOMIC ANALYSISEXECUTIVE SUMMARYThe purpose of this economic analysis is to describe the economic analysis, methodologies,modeling and assumptions involved in evaluation of flood risk in the Ala Wai Canal watershed.The flood risk was initially analyzed in terms of a future without-project condition.Subsequently, the future without-project condition analysis served as a baseline condition forconsideration and comparison of alternatives. This analysis resulted in the selection of a NationalEconomic Development (NED) Plan, a Tentative Selected Plan (TSP), and ultimately arecommended plan.Economic efficiency is not be the only decision point for selection of the preferred alternative, asmany other criteria exist. However, it is critical to the success of any water resources project toensure that recommended alternatives do not cause dramatic and possibly harmful changes to thenation’s economy, regional and local economies or local social infrastructure. Recently releasedregulations and guidelines like Executive Order 11988 have instructed Federal agenciesresponsible for water resource development projects to give more weight to projects thatpotentially reduce the threat to human health and safety and/or valuable natural resources.The Ala Wai Canal watershed is located in the heart of Honolulu, on the island of Oahu, Hawaii.The neighborhoods of Makiki, Manoa, Waikiki, McCully/Moiliili, Kaimuki/Palolo, and AlaMoana comprise the primary impact area for the proposed flood risk management alternativesdescribed in this feasibility report. For the purposes of this study, the area designated as the AlaWai Canal flood plain is generally defined by its 0.002 annual chance exceedance (ACE) floodplain. A total of about 200,000 people live in this inundation area, which also includesapproximately 6,800 residences, 1,900 commercial buildings and 250 public buildings. Thevalue of these properties, along with public infrastructure such as city streets, is an estimated 9billion in 2017 dollars. The majority of this value is located in the Waikiki vicinity. Withnumerous hotels and hundreds of stores and restaurants, it is easily the most important economicdriver in the State of Hawaii. The majority of the public structures are found in the ManoaValley, where the main campus of the University of Hawaii is located along with researchbuildings and other district public schools.Given the current built-out status of the watershed, new development will be almost entirelyrestricted to replacing old structures with new ones. As this happens, the study area is expectedto expand vertically with new high rises replacing single-family homes and outdated apartmentbuildings and multiple storied structures replacing older single-floor development. Commercialdevelopment is expected to follow suit, but it is impossible to say exactly which buildings will bereplaced and by what types of occupancy. Therefore, this study does not assume any significantfuture changes to the structure inventories or other assets supporting damage estimation. Futureconditions will be the same as present conditions for purposes of calculating damages or costsES-I
except for the inclusion of sea-level rise parameters which will result in somewhat higher watersurface profiles in some portions of the basin in the future condition. However, the number ofpeople potentially placed in harm’s way from a flood, whether they be residents, workers,shoppers, tourists or motorists traveling through the flood plain, will clearly be increasing overthe 50-year planning horizonThe primary economic benefit associated with a flood risk management project is the reductionin inundation damages to structures, structure contents (furniture, equipment, inventory, etc.) andinfrastructure. All categories of economic benefits considered in this study involve reduction ofpotential physical flood damages to structures and contents as well as infrastructure. Thesecategories are unquestionably the most significant drivers of National Economic Development(NED) benefits. The economic evaluation of physical flood risk is accomplished through the useof two programs developed by the USACE Hydrologic Engineering Center: HEC-RAS, theRiver Analysis System which computes stream flows and stages along with the relativefrequency of various magnitudes of flooding; and HEC-FDA, the Flood Damage Analysisprogram, which estimates expected annual economic damages and damages reduced (benefits) aswell as project performance under conditions of risk and uncertainty. HEC-FDA uses MonteCarlo simulation techniques to account for uncertainty in key variables while evaluating the fullrange of possible flood events within the study area under existing, base year and futureconditions.The plan formulation for this project follows recently-issued USACE guidelines forimplementing the SMART Planning paradigm. A detailed account of how the Project DeliveryTeam (PDT) screened various project alternatives and selected the recommended plan, alongwith the planning objectives and selection criteria followed, can be found in Chapters 3 and 4 ofthe main section of this feasibility report. This economic appendix picks up the SMARTplanning process in the later stages of plan comparison and describes and quantifies theeconomic results behind such decisions as: How alternative 5, a stand-alone nonstructural flood risk management plan, wasdeveloped and considered and why it ultimately was dropped from further consideration;Why alternative 3A was selected as superior to Alternative 2A in the final array stage;How the multiple measures comprising alternative 3A were economically justified;How alternative 3A was optimized, leading to its emergence as the NED Plan and theTSP;How alternative 3A was confirmed as the recommended plan in the final stages ofcompletion of this feasibility study.In summary, alternative 3A, a comprehensive, basin-wide plan consisting of floodwalls along theAla Wai Canal along with an assortment of detention and debris basins and a flood warningsystem, is the recommended plan. The economic benefit-cost analysis of the recommended planquantified the plan’s economic outputs as shown in Table ES-01 below:ES-II
Table ES-01. Economics of the Recommended PlanOct. 2016 prices ( 000s); 3.125% 2.875% discount rateTotal First CostTotal Investment Cost (with IDC)Total Annual CostExpected Annual BenefitsBenefit-Cost RatioNet Annual Benefits 301,084.0 315,785.0 13,548.0 39,732.02.9 26,184.0Total First CostTotal Investment Cost (with IDC)Total Annual CostExpected Annual BenefitsBenefit-Cost RatioNet Annual Benefits 306,095,000 319,697 48,331,000 13,117,0003.7 35,214,000By implementing the recommended plan, equivalent annual damages (EAD) to structures andcontents within the watershed are anticipated to fall from approximately 45.2 53.7 million inwithout-project conditions to 5.5 5.4 million, reducing the EAD to about 12 10 percent ofwithout-project EAD. The reduction is even more impressive in the three Ala Wai Canal reaches,where Waikiki flooding is of upmost concern; there, residual damages to structures, contents andinfrastructure would be reduced to well under 1 percent of their without-project levels. Nonphysical costs of flooding not quantified for this analysis, including emergency costs, trafficinterruption impacts and business interruption costs, would be expected to follow suit. Inaddition, with the recommended plan’s floodwalls in place, there is a greater than 95% 99%assurance that the project would successfully contain a 0.01 ACE event under both current andprojected (2025 and 2075) conditions and assuming either low, intermediate or high sea levelrise scenarios.ES-III
Ala Wai Canal Project Feasibility Study,Oahu, HawaiiEconomic AnalysisSeptember 2016 March 2017ContentsExecutive Summary . ES-I1.0 INTRODUCTION . 11.1 Purpose . 11.2 Location and Description . 11.3 Economic Study Reaches . 51.3.1 Ala Wai Reaches . 51.3.2 Makiki Reaches . 61.3.3 Manoa Reaches. 71.3.4 Palolo Reaches . 91.4 Historical Damages . 91.5 Economic Parameters . 101.6 Methodology and Terminology . 111.6.1 Annual Chance Exceedance . 111.6.2 Methodology . 111.6.3 Expected Annual Damages (EAD) . 131.6.4 Expected Annual Benefits (EAB) . 131.6.5 Equivalent Annual Damages . 131.6.6 Expected Annual Cost (EAC) . 132.0 SYSTEM OF ACCOUNTS . 132.1 General . 132.2 National Economic Development (NED) . 142.3 Regional Economic Development (RED) . 142.4 Environmental Quality (EQ) . 162.5 Other Social Effects (OSE) . 163.0 ECONOMIC DATA AND MODEL DEVELOPMENT . 173.1 Data Gathering: The Economic Flood Plain Survey . 183.1.1 Typical Residential Structures . 193.1.2 Typical Commercial Structures . 193.1.3 Typical Public Structures . 193.1.4 Parks . 203.2 Economic Data Development . 203.2.1 Economic Study Reaches . 203.2.2 Structure Elevations . 203.2.3 Structure Values . 233.2.3.1 Structure Value Uncertainty . 253.2.3.2 2016 Update of Structure Values . 25ES B-I
3.2.44.05.06.07.0Other Values . 263.2.4.1 Street Values . 263.2.4.2 Residential Auto Values . 273.2.5 Occupancies . 273.2.6 Generic Content Values and Depth-Damage Functions . 333.3 The Economic Model . 353.3.1 Software Version . 363.3.2 Model Configuration . 363.3.3 Engineering Data Inputs . 363.3.4 Economic Data Inputs . 373.3.5 Model Calibration . 38EXISTING WITHOUT-PROJECT CONDITION DAMAGE ANALYSIS RESULTS . 414.1 Investment . 414.2 Single-Event Damages . 414.3 Expected Annual Damages (EAD) . 414.4 Beginning Damage Elevations . 424.5 Annual, Long-Term and Conditional Exceedance Performance . 42FUTURE WITHOUT-PROJECT CONDITION DAMAGE ANALYSIS RESULTS.575.1 Expected Annual Damages . 575.2 Equivalent Annual Damages . 575.3 Annual Exceedance Probability, Long-Term Risk and Conditional NonexceedanceProbability . 575.4 Economic Context for Future Conditions 685.5 Sea-Level Rise Change . .695.6 Flood Plain Management .70ALTERNATIVES ANALYSIS . 716.1 The Plan Selection Process . 716.2 The Nonstructural Alternative (Alternative 5) . 726.2.1 Background . 726.2.2 A Purely Nonstructural Solution for the Ala Wai Canal Project Area . 746.2.3 3-Step Process for Evaluation of Nonstructural Measures . 756.2.4 The First Screening . 766.2.5 The Second Screening . 786.2.6 The Third Screening . 796.2.7 The Outcome . 806.3 Choosing Alternative 3A over Alternative 2A in the Final Array Stage . 806.3.1 Incremental Cost Analysis for Alternative 3A Measures . 826.3.2 Posssible Trade-Offs in Measures to Improve Alternative 3A . 866.3.3 Optimization and NED Plan Determination . 886.3.4 2016 Recheck of NED Plan Determination 91RECOMMENDED PLAN . 937.1 Plan Summary . 937.2 Project Costs . 937.2.1 Total Project Costs . 93ES B-II
7.2.2 Annual Costs . 947.3 Project Benefits . 967.3.1 NED Benefits . 967.3.2 NED Benefits vs. RED Effects . 967.3.3 Benefits in Low Flow Reaches (ER 1165-2-21) .1027.4 Benefit-Cost Analysis . 1067.5 Project Performance and Sea-Level Rise Considerations . 1077.6 Residual Risk . 1097.6.1 EAD and Project Performance . 1097.6.2 Public Safety . 1097.6.3 Iolani School . 1097.6.4 Ala Wai Golf Course . 1107.6.5 Resiliency and Superiority . 1108.0 CONCLUSION .1129.0 REFERENCES . 130ES B-III
FiguresFigure B-1. Flood Inundation Outlines for Selected Events3Figure B-2. Overview of Stream Reaches4Figure B-3. Existing Condition 0.01 ACE Flood Damages by Reach47Figure B-4. Existing Condition Expected Annual Damages – 2015 Conditions49Figure B-5. Results of the Incremental Analysis85Figure B-6. Identification of the NED Plan and the Tentatively Selected Plan90Figure B-7. Ala Wai Stream Reaches and Detention Basin Feature Locations104Figure B-8. Location of Makiki Stream Detention Basin and 800 cfs Location Point105Figure B-9. Location of Woodlawn Detention Basin and Beginning Benefits Location Downstream106Figure B-10. Residual Expected Annual Damages for the Recommended Plan113TablesTable B-1. Total Population in the Ala Wai Watershed2Table B-2. Economic Study Reaches21Table B-3. Breakdown of Structure Inventory by Occupancy Types28Table B-4. Occupancy Groups by Reach29Table B-5. Depth-Damage Functions Used in the Economic Analysis39Table B-6. Content-to-Structure Value Ratios Used in the Economic Analysis40Table B-7. Total Investment in Ala Wai Study Area – By Reach and Category44Table B-8. Existing Condition Single-Event Damages45Table B-9. Existing Condition EAD (Expected Annual Damages) by Reach and Category51Table B-10. Beginning Damage Frequency by Reach53Table B-11. Existing Condition Annual Exceedance Probability, Long-Term Risk and ConditionalNonexceedance Probability55Table B-12. Future Without-Project Expected and Equivalent Annual Damages 2025 vs. 207559Table B-13. Future Without-Project Annual Exceedance Probability, Long-Term Risk and ConditionalNonexceedance Probability – 2075 Intermediate SLR Conditions62Table B-14. 2025 vs. 2075 Water Surface Profile Changes for Ala Wai Canal Reaches68Table B-15. Early Relative Order of Magnitude (ROM) Cost and Benefit Estimates (Screening Cost –November 2013)81Table B-16. 10% Design – Cost and Benefit Estimates, February 201481Table B-17. Definition of Increments Used for Incremental Justification83Table B-18. Incremental Cost Analysis, May 201484ES B-iv
Table B-19. Check on the Validity of the Last Increment Added87Table B-20. Ala Wai NED Plan Optimization Analysis – EAC (2015)89Table B-21. Ala Wai NED Plan Optimization Analysis – EAC (2016)91Table B-22. Total Project Costs for Recommended Plan93Table B-23. Annual Costs94Table B-24. Interest During Construction95Table B-25. Annual Benefits with Probabilistic Values96Table B-26. Annual Benefits by Category and Reach98Table B-27. Contribution to the State’s Economy by Statewide Visitor Industry and Waikiki: 2013100Table B-28. Ala Wai Watershed Project-Related Locations of 10% ACE Flows (Existing Conditions)103Table B-29. Benefit-Cost Ratio107Table B-30. Project Performance115ES B-v
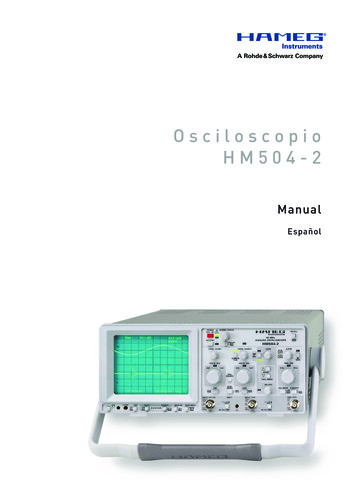
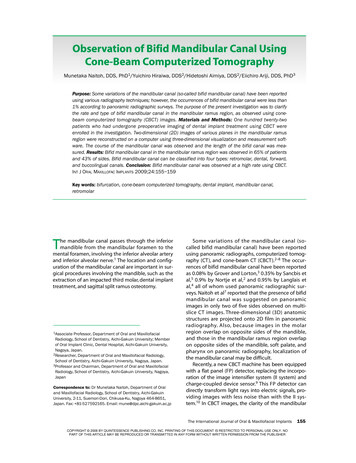
ALA WAI CANAL PROJECT FEASIBILITY STUDYOAHU, HAWAIIECONOMIC ANALYSIS1.0.INTRODUCTION1.1. Purpose. The purpose of this economic analysis is to describe the economicmethodologies, modeling, assumptions and findings of the Ala Wai Canal economic analysiswhich ultimately led to the selection of the recommended plan. The flood risk was initiallyanalyzed in terms of economic damages estimated for future without-project conditions.Subsequently, this future without-project analysis served as a baseline condition forconsideration and comparison of alternatives. This analysis resulted in the selection of,successively, a National Economic Development (NED) Plan, a Tentative Selected Plan (TSP),and a recommended plan.1.2.Location and Description. The Ala Wai Canal watershed is located in the heart ofHonolulu, on the island of Oahu, Hawaii. Figure B-1 shows the watershed and highlights theareas that would be inundated by selected floods—the 0.02, 0.01 and 0.002 ACE (annual chanceexceedance) events, assuming an intermediate sea level rise (SLR) scenario. The watershed ismade up of the Palolo, Manoa and Makiki drainage areas and covers over 16 square miles. Theneighborhoods of Makiki, Manoa, Waikiki, McCully/Moiliili, Kaimuki/Palolo and Ala Moanacomprise the primary impact area for the proposed flood risk management project.As shown in Table B-1, these six neighborhoods comprising the Ala Wai watershed, shown inTable B-1, had a total population of about 200,000 in 2010, and their population has beenincreasing at an annual rate of about 2.1 percent since 2010. Overall, population growth in thewatershed has increased an estimated 9.2 percent up to 2014 since the 2000 census. This is lessthan the City of Honolulu’s 12.2 percent population increase over roughly the same time periodand is also less than the comparable state and national increases. The Ala Moana neighborhoodshowed the largest percentage growth, 29 percent, among the Ala Wai watershed neighborhoods;it also has the smallest population among these neighborhoods. Waikiki had the next highest rateof growth with a 17 percent change. The largest population totals are to be found in theKaimuki/Palolo and Manoa areas, while the McCully/Moiliili area has seen an outmigration of13 percent since 2000.The population of the Ala Wai Canal watershed is expected to continue to grow at an annual rateof between 1 and 2 percent over the 50-year planning horizon, with the Waikiki and Ala Moanadistricts anticipated to grow the fastest. Both residential and commercial areas of the flood plainare fully built-out, with little room available for construction of new structures without thedemolition of existing structures. Given the built-out status of the watershed, new developmentwill be almost entirely restricted to replacing old structures with new ones. As this happens, thestudy area is expected to expand vertically with new high rises replacing single-family homesand outdated apartment buildings and multiple storied structures replacing older single floordevelopment. Commercial development is expected to follow suit.ES B-1
Exactly which buildings will be replaced and by what is impossible to say. Therefore, this studyassumes that no significant changes will occur to the structure inventories or other assets onwhich damage categories are based, and that future conditions will be the same as presentconditions for the purposes of calculating damages or costs. The number of residents, workers,shoppers, tourists and motorists traveling through the flood plain who will potentially be placedin harm’s way from a flood will clearly be increasing over the 50-year period of analysis.Table B-1. Total Population in the Ala Wai WatershedNeighborhoodAla ikiTotalHonolulu CountyState of HawaiiUnited States200020102014% 86,795199,668203,9299.2%200020102013% %15.9%12.3%The total asset base as defined by depreciated replacement value of all the structures, structurecontents and infrastructure in the watershed is approximately 8.9 billion in 2017 dollars. Thesebillions of dollars of property are spread across the central part of Honolulu in the form ofbusinesses, residential properties and public facilities. The majority of this value is located in theWaikiki vicinity along the Ala Wai Canal. With numerous hotels and hundreds of stores andrestaurants, it is easily the economic driver for the state. Businesses in the district rely heavily ontourist dollars for sustenance and growth. Other districts with large commercial activities areMakiki and Kapahulu, which are located north and northwest of Waikiki, respectively. Themajority of public facilities are found in the Manoa Valley. Manoa houses the main campus ofthe University of Hawaii in addition to research buildings and other public schools. The Manoaarea also includes a large portion of the study area’s residential properties, including many of themore upscale properties. Makiki also has a high portion of its total investment in residentialproperties, which include numerous small apartments. Other areas with especially denseresidential development include Waikiki, Kapahulu, and Palolo.ES B-2
Figure 1. Flood Inundation Outlines for Selected EventsES B-3
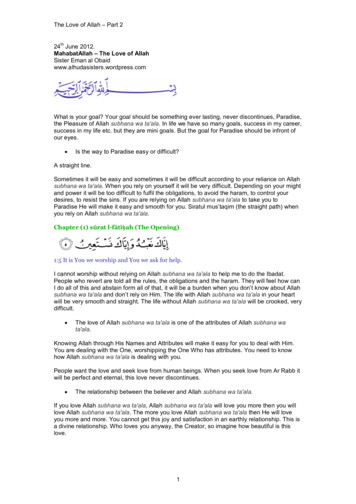
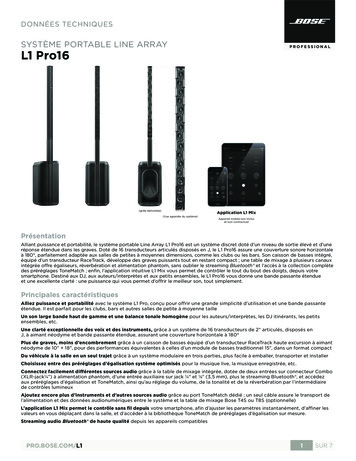
Figure B-2. Overview of Stream ReachesES B-4
1.3.Economic Study Reaches. The Ala Wai Canal Project hydraulic and economic modelsextend from the mouth of the canal upstream to the extent of the developed areas along Makiki,Manoa, and Palolo Streams (Figure B-1). For purposes of this economic analysis, the watershedis divided into 27 economic reaches along 10 streams in four subbasins. Each reach has specificcharacteristics that make it unique. Figure B-2 displays the 27 reaches. (It should be noted thatthere are several reaches shown in the upper Ala Wai watershed in Figure B-2 that were includedin early phases of the feasibility study but are not discussed here since they were dropped fromthe study early on.) The Ala Wai Canal itself is divided into three reaches, while streams such asMakiki, Manoa and Palolo have as many as seven reaches. A few smaller areas include only oneor two reaches. A description of the four subbasins and the 27 economic reaches follows, whileinvestment in the individual subbasins and reaches is summarized in Table B-2.1.3.1. Ala Wai ReachesThe Ala Wai subbasin is one of four subbasins within the Ala Wai watershed. It includes the AlaWai Canal and the Manoa-Palolo Canal. The latter, which flows into the Ala Wai Canal, is thelower portion of the Manoa and the Palolo streams. This subbasin has by far the highestinvestment value of the four subbasins, with total investment estimated at 5 billion, more thanhalf of the total investment in the study area. More than 4,200 structures are located in the AlaWai subbasin, which includes five reaches:ALA1 is the last leg of the Ala Wai Canal before it arrives at the ocean. This reach is the westernportion of Waikiki and includes such points of interest as the Ala Moana Shopping Center, IlikaiHotel and Hawaii Prince Hotel. The tourist population density is relatively heavy in this area.Other than Ala Moana Mall, most businesses are small retail stores and restaurants. Theeconomic structure inventory accounts for 472 structures, of which nearly three-fourths arecommercial or public. The commercial properties have much more value and potential to bedamaged by flooding than the approximately 130 residential properties in this reach. Mostresidents live in apartments and large condominiums. There is a handful of single-familyresidences, but space is extremely limited, so the housing lots are relatively small. Totalinvestment in this reach is estimated at approximately 2.18 billion, which is the highestinvestment value of all 27 reaches in the study. More than 2 billion of this total is accounted forby commercial and public uses. Equivalent annual
The Ala Wai Canal watershed is located in the heart of Honolulu, on the island of Oahu, Hawaii. The neighborhoods of Makiki, Manoa, Waikiki, McCully/Moiliili, Kaimuki/Palolo, and Ala Moana comprise the primary impact area for the proposed flood risk management alternatives described in this feasibility report.