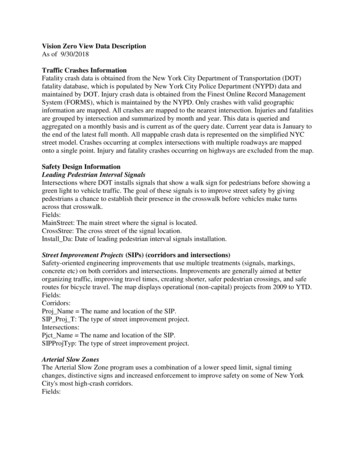
Transcription
Vision Zero View Data DescriptionAs of 9/30/2018Traffic Crashes InformationFatality crash data is obtained from the New York City Department of Transportation (DOT)fatality database, which is populated by New York City Police Department (NYPD) data andmaintained by DOT. Injury crash data is obtained from the Finest Online Record ManagementSystem (FORMS), which is maintained by the NYPD. Only crashes with valid geographicinformation are mapped. All crashes are mapped to the nearest intersection. Injuries and fatalitiesare grouped by intersection and summarized by month and year. This data is queried andaggregated on a monthly basis and is current as of the query date. Current year data is January tothe end of the latest full month. All mappable crash data is represented on the simplified NYCstreet model. Crashes occurring at complex intersections with multiple roadways are mappedonto a single point. Injury and fatality crashes occurring on highways are excluded from the map.Safety Design InformationLeading Pedestrian Interval SignalsIntersections where DOT installs signals that show a walk sign for pedestrians before showing agreen light to vehicle traffic. The goal of these signals is to improve street safety by givingpedestrians a chance to establish their presence in the crosswalk before vehicles make turnsacross that crosswalk.Fields:MainStreet: The main street where the signal is located.CrossStree: The cross street of the signal location.Install Da: Date of leading pedestrian interval signals installation.Street Improvement Projects (SIPs) (corridors and intersections)Safety-oriented engineering improvements that use multiple treatments (signals, markings,concrete etc) on both corridors and intersections. Improvements are generally aimed at betterorganizing traffic, improving travel times, creating shorter, safer pedestrian crossings, and saferoutes for bicycle travel. The map displays operational (non-capital) projects from 2009 to YTD.Fields:Corridors:Proj Name The name and location of the SIP.SIP Proj T: The type of street improvement project.Intersections:Pjct Name The name and location of the SIP.SIPProjTyp: The type of street improvement project.Arterial Slow ZonesThe Arterial Slow Zone program uses a combination of a lower speed limit, signal timingchanges, distinctive signs and increased enforcement to improve safety on some of New YorkCity's most high-crash corridors.Fields:
FROM STREET: The beginning of the road stretch.TO STREET: The end of the road stretch.Speed HumpsSpeed Humps are a raised area of a roadway designed to reduce vehicle speeds. Dates reflect thefirst time a speed hump was installed at a location, subsequent removals and/or re-installationsare not included.Fields:on st: The Street on which the speed bumps are located.from st: The cross street where the speed bump installation begins.to st: The cross street where the speed bump installation ends.new humps: The number of speed humps in the segmentdate insta: Date of speed hump installation.Safe Streets for SeniorsThe Safe Streets for Seniors program is an initiative aimed at increasing safety for older NewYorkers. Based on factors such as senior population density, injury crashes, and senior tripgenerators, DOT has selected and studied Senior Pedestrian Focus Areas. Within these areas,DOT evaluates potential safety improvements and also conducts educational outreach to seniorcenters.Fields:Name: The neighborhood where the Safe Streets for Seniors zone is located.Neighborhood Slow ZonesThe Neighborhood Slow Zone program is an application based program which takes aneighborhood area and reduces the speed limit to 20 mph. Areas are chosen based on crashes,presence of schools and other neighborhood amenities, and community support. The treatmentsinclude a mixture of markings, signage, and speed humps.Fields:Name: The neighborhood where the Neighborhood Slow Zone is located.Year: The year that the project was implemented.Vision Zero Priority IntersectionsThe intersections with the highest number of pedestrian KSI (killed and severely injured) thatcumulatively account for 15% of the borough’s total pedestrian KSI. Developed as part of theBorough Pedestrian Safety Action Plans.Fields:Street1: The main street where the intersection meets.Street2: The cross street of the intersection.Vision Zero Priority CorridorsAll corridors in each borough were ranked on a pedestrian KSI (killed and severely injured) permile basis. Corridors were selected from the top of this list until the cumulative number of KSIreached half of the borough’s total. Developed as part of the Borough Pedestrian Safety ActionPlans.
Fields:Corridor:OnStreet: The road stretch where the corridor is located.FromStreet: The beginning of the road stretch.ToStreet: The end of the road stretch.Vision Zero Priority AreasAreas in each borough were ranked on a pedestrian KSI density basis. Areas were selected frommost dense to least, such that, when combined, account for half of all of pedestrian KSI in theborough. Developed as part of the Borough Pedestrian Safety Action Plans.Fields:SqMi: Area in Square MilesVision Zero Bike Priority Areas (study)Priority Bicycle Districts are neighborhoods with comparatively high numbers of cyclist KSI andfew dedicated bicycle facilities. These districts, seven in Brooklyn and three in Queens, represent14% of the City’s bicycle lane network and 23% of cyclist KSI. NYC DOT identified these areasin the 2017 report “Safer Cycling: Bicycle Ridership and Safety in New York City.” The agencyhas prioritized these areas for bicycle network expansion.Fields:BoroCD code: Community District number25MPH Signal RetimingPriority Corridors where the signal progression has been changed to match the 25 MPH speedlimit.Corridor:OnStreet: The road stretch where the corridor is located.FromStreet: The beginning of the road stretch.ToStreet: The end of the road stretch.YR: The year that the project was implemented.Left Turn Traffic CalmingIntersections where DOT installs traffic calming measures that guide drivers to turn left at a saferspeed and angle, as well as increase visibility for pedestrians in the crosswalk.Fields:Completion: Date InstalledEnhanced CrossingsEnhanced Crossings are marked high-visibility crosswalks on calm streets with low vehiclevolumes and a strong pedestrian desire to cross. Standard DOT toolbox treatments are used(ADA pedestrian ramps, pedestrian warning signs and high-visibility crosswalk markings) toimprove the mobility and accessibility of pedestrians.Fields:Date Imple: The date that the project was implemented
Speed LimitsOn November 7, 2014, New York City’s default speed limit was changed from 30 mph to 25mph. Unless otherwise signed, all streets in New York City are governed by this 25 mph speedlimit. Driving at or below 25 MPH decreases stopping distance, gives drivers and pedestriansmore time to see each other and react, and improves drivers’ ability to avoid crashes. Pedestriansstruck by vehicles traveling at 25 MPH are half as likely to die as those struck at 30 MPH. Ifcrashes do occur, the severity of injuries is reduced a lower speeds. The information shown herewas compiled by the New York City Department of Transportation for governmental purposes.The information is updated as soon as reasonably practicable. The public is advised that speedlimits are subject to temporary or permanent change and that posted signage must be observedfor compliance with laws and regulations.Fields:Street: The name of the street.postvz sl: The post-vision zero speed limit.postvz sg: Describes if the street segment is signed or unsigned.Outreach InformationSchoolsDOT is conducting outreach to numerous schools in the five boroughs, using age-appropriatematerials to educate school children about traffic safety.Fields:Activity: The type of outreach session.SiteServed: The name of the school where the event occurred.EventDate: The date on which the event occurred.Senior CentersDOT is partnering with Senior Centers across New York City to increase communication andobtain specific feedback from older New Yorkers about the challenges they face and potentialstreet safety improvements.Fields:Activity: The type of outreach session.Site Serve: The name of the senior center where the event occurred.EventDate: The date on which the event occurred.Taxi & Car Service TrainingsTaxi fleets, for-hire vehicle bases, and industry associations have been welcoming TLC into theirestablishments to discuss Vision Zero and traffic safety. TLC staff use a presentation to guidethis discussion, and at the end of the session drivers sign the TLC Safe Driver Pledge.Fields:Event: the name of the business where the training occurred.Address: The location of the business where the training occurred.
Town Hall MeetingsIn Spring 2014, DOT partnered with New York City Councilmembers across the five boroughsto host a number of Town Halls, where community members could come learn more aboutVision Zero and give specific suggestions or concerns regarding traffic safety in theirneighborhoods.Fields:Sheet1 NA: The name of the institution where the town hall occurred.Sheet1 AD: The location of the institution where the town hall occurred.WorkshopsIn Spring 2014, DOT hosted nine pedestrian safety workshops across the five boroughs aimed atgathering community feedback on areas in need of safety improvements. This feedback was usedto shape the Borough Pedestrian Safety Action Plans, released in 2015.Fields:Sheet1 Na: The name of the institution where the workshop occurred.Sheet1 AD: The location of the institution where the workshop occurred.Street TeamsStreet Team members trained the general public with Vision Zero hands-on safety exercisesincluding safe walking and biking, car safety tips and an opportunity to get inside of largedelivery trucks to experience their blind spots. Vision Zero promotional materials were handedout along with educational handouts.Fields:Date: The date of the flyer distribution.TotalFlyer: The number of flyers handed out on that date.Hands-On Safety DemosHands-on safety demonstrations are held in conjunction with local partners throughout NewYork City, bringing traffic safety education and assistance directly to the public. Events includecar safety seat fittings, bicycle helmet fittings and giveaways, truck safety and car safetydemonstrations, Vision Zero table seminars and DWI awareness events.Fields:Site Serve: The location of the safety demo.Event Date: the date of the safety demo.Activity: The type of safety demo that occurred at this location.Administrative District Summary InformationPolice PrecinctNew York City is divided into a number of police precincts with officers who manageenforcement within that area.Boroughs and Community DistrictNew York City is comprised of five boroughs, containing 59 community districts citywideestablished by local law in 1975. Local communities are represented by community boards thatcreate opportunity for active participation in the political process and provision of services toaddress evolving community needs.
City Council DistrictNew York City is divided into 51 City Council districts, each represented by a councilmemberelected by residents of the district.Density of Injuries and Fatalities by (Police Precinct, Community District, City CouncilDistrict, Borough)Number of traffic injuries and fatalities occurring in a given area, normalized by the populationof that area. Only mapped crashes visible on Vision Zero View are calculated.Fields:CounDist: City Council District number (Summary City Council Districts layer)Precinct: Police Precinct number (Summary Police Precincts layer)BoroCD: Community District number (Summary Community Districts layer)Borough na: Borough Name (Summary Borough Boundaries layer)Population data is derived from the 2010 US Census, and is mapped for each correspondingdistrict.TotalPop: total population for that districtAges under: population under 5 years oldAges 5to9: population aged 5-9 yearsAges 10to1: population aged 10-14 yearsAges 15to1: population aged 15-19 yearsAges 20to2: population aged 20-24 yearsAges 25to4: population aged 25-44 yearsAges 45to6: population aged 45-64 yearsAges 65and: population aged 65 and overThe summary traffic crash data is derived from NYPD crash data as described above, andmapped to each corresponding district. Only mapped crash data on Vision Zero View from 2016is included.SUM Injuries: The total traffic injuries for that district.SUM PedInjuries: The total pedestrian traffic injuries for that district.SUM BikeInjuries: The total cyclist traffic injuries for that district.SUM MVOInjuries: The total motorist traffic injuries for that district.SUM Fatalities: The total traffic fatalities for that district.SUM PedFatalities: The total pedestrian traffic fatalities for that district.SUM BikeFatalities s: The total cyclist traffic fatalities for that district.SUM MVOFatalities: The total motorist traffic fatalities for that district.The street design data is derived from the street design projects described above. Each layer ismapped to the corresponding district. Data timeframes are given below, and the data onlyincludes currently implemented projects unless otherwise stated.SUM LPI: The number of leading pedestrian intervals signals in that district. 2014-YTDSUM SIPIntersections: Safety-oriented engineering improvements at intersections, 2009-YTDfor that district.SUM SIPCorridors: Safety-oriented engineering improvements along traffic corridors, 2009YTD, for that district.
SUM SpeedHumps: The number of speed humps constructed in that district. First timeinstallations only.SUM ASZ: The linear miles of Arterial Slow Zones implemented in that district, 2014.SUM NeighSlowZones: The linear miles of corridors included in Neighborhood Slow Zonesprogram, 2011-2016SUM VZ Priority Corridors: Linear milesSUM VZ Priority Intersections # of intersectionsSUM VZ Priority Zones : road miles within study zonesSUM Left Turn Traffic Calming: # of intersections with implementationsSUM SignalTiming: miles of Corridors where the signal progression has been changed to matchthe 25 MPH speed limit.Please note that the data and information on this website is for informational purposes only.While we seek to provide accurate information, please note that errors may be present andinformation presented may not be complete. Accordingly, the City of New York or the NewYork City Department of Transportation make no representation as to the accuracy of theinformation or its suitability for any purpose and disclaim any liability for omissions or errorsthat may be contained therein.
The summary traffic crash data is derived from NYPD crash data as described above, and mapped to each corresponding district. Only mapped crash data on Vision Zero View from 2016 is included. SUM_Injuries: The total traffic injuries for that district. SUM_PedInjuries: The total pedestrian traffic injuries for that district.
