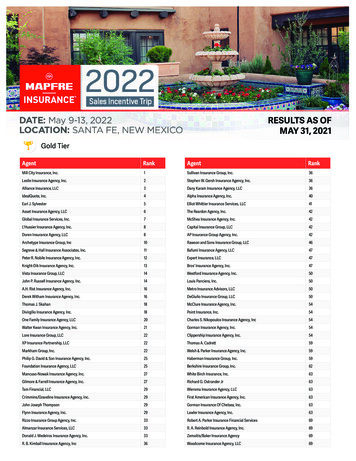
Transcription
SERFF Tracking #:HGHM-131937188State Tracking #:HGHM-131937188Company Tracking #:State:PennsylvaniaTOI/Sub-TOI:H15G Group Health - Hospital/Surgical/Medical Expense/H15G.003 Small Group OnlyFiling Company:Product Name:HCA Small Group 2020 ACA Rate FilingProject Name/Number:1A-SG-HCA-2020/1A-SG-HCA-2019Highmark Coverage Advantage IncSupporting Document SchedulesSatisfied - Item:Comments:Attachment(s):Item Status:Status Date:1A-SG-HCA-2019ACA Public Rate Filing PDFHCA Public PDF (FAR).pdfPDF Pipeline for SERFF Tracking Number HGHM-131937188 Generated 10/07/2019 11:51 AM
May 21, 2019Ms. Tracie Gray, DirectorBureau of Life, Accident & Health InsuranceCommonwealth of Pennsylvania Insurance Department1311 Strawberry SquareHarrisburg, PA 17120Re: Highmark Coverage Advantage (HCA) 2020 ACA Rate Filing (Small Group Market)HCA Filing # 1A-SG-HCA-2019 (SERFF Filing # HGHM-131937188)This constitutes Notice pursuant to Section 707 of the PennsylvaniaRight-to-Know Law that the attached Highmark Coverage Advantage2020 Small Group Market Rates Filing contains Trade Secret andConfidential Proprietary Information. Therefore, Highmark CoverageAdvantage must, prior to the release of any portion of this Filing, benotified of any request by a third party for access to this Filing, and theTrade Secret and/or Confidential Proprietary Information identified byHighmark Coverage Advantage should be redacted before release.Dear Ms. Gray:This Filing includes the Highmark Coverage Advantage (HCA) (NAIC # 15507; HIOS Issuer ID# 79279) Small Group Market Off Exchange ACA rates and the supporting rate development forpolicies with effective dates on or after January 1, 2020.In the event the Department decides to publish this Filing in the PA Bulletin, the companyinformation requested as per the Department’s 2020 ACA-Compliant Health InsuranceRate Filing Guidance, Section B, is provided below:1. Company Name & NAIC #: Highmark Coverage Advantage, NAIC # 15507(“Company”)2. Market: Small Group (“Market”)3. On or Off Exchange: This Company’s products are offered Off Exchange only4. Effective date of coverage: January 1, 2020
Ms. Tracie Gray, DirectorHighmark Coverage Advantage 2020 Small Group Market RatesMay 21, 2019Page 2 of 45. Average rate change requested: -0.89% increase6. Range of rate change requested: -1.3% to -0.6%7. Total additional annual revenue generated from the proposed rate change: ( 68,750)8. Product(s): PPO9. Rating Areas and the change from 2019: Regions 1, 2, 4, 5, 6 (Western, PA only)There are no changes in our covered Rating Areas from the 2019 rate filing.10. Metal Levels and Catastrophic Plans: This filing reflects that the Company anticipatesselling the following Metal Levels of coverage in the indicated Market: Platinum, Gold,Silver, and Bronze11. Current number of covered lives and of policyholders as of February 1, 2019: 1,554 coveredlives; 893 policyholders12. Number of plans offered in 2020 and the change this represents from 2019: 11The Company offered 14 plans in 2019. For 2020, the Company is offering 0 new plans inthe Market, and removing 3 plans from the Market.Please note that inclusion of premium rates in this filing for a given offering should not beconstrued to mean that the offering will ultimately be made available for sale in the market.Final offering decisions will be made consistent with and within the timelines set forth inCMS rules and/or ACA regulations.13. Corresponding contract form number, SERFF and Binder ID numbers: The correspondingSERFF binder number is HGHM-PA20-125092148 affecting the following Companyproducts and forms:Product Name / TypePPOHDHPContract Form & SERFF #HCA/PPO-6; HGHM-131921065HCA/HDHP-6; HGHM-13192128614. HIOS Issuer ID # and submission tracking number: HIOS Issuer ID # 79279, CompanyFiling # 1A-SG-HCA-2019 (SERFF Filing # HGHM-131937188)
Ms. Tracie Gray, DirectorHighmark Coverage Advantage 2020 Small Group Market RatesMay 21, 2019Page 3 of 4Additional Filing DisclosuresThe Company has submitted all Required Documents stipulated by the Department, includingthe federal documents related to this filing, in its SERFF submission. In addition to the RequiredDocuments, the Company has submitted a Supplemental Exhibits file containing additionaldetailed exhibits on items referenced in the PA Actuarial Memorandum. All tables, exhibits, anddetail in support of this filing and the PA Actuarial Memorandum have been included in Excelformat. For the Department’s benefit, the Excel files have retained their formulas to the extentpossible.CMS has instructed issuers that it no longer requires any interim changes to the URRT to besubmitted to HIOS. CMS is requesting that only the initial URRT and the final URRT besubmitted to HIOS.Request for ConfidentialityPlease note that the rates and the supporting rate development contained in this Filing arecompetitively sensitive, are not in the public domain, and constitute business confidentialproprietary/trade secret information that would cause harm to the competitive position ofHighmark Coverage Advantage if disclosed to the public.Public disclosure of any information contained in this Filing would allow Highmark CoverageAdvantage competitors to better understand or discover its confidential and proprietary rating,pricing and/or marketing practices, would undermine competition in the Small Group market,and could have negative consequences for the operation of Highmark Coverage Advantage’sbusiness. Therefore, Highmark Coverage Advantage asserts that this Filing, in its entirety,constitutes Trade Secret and Confidential Proprietary Information and should not be disclosed.It is our understanding that the Department does not intend to publish the confidential andproprietary information contained in this Filing or to otherwise permit this Filing and itsconfidential information, other than the redacted information and final approved rates, to bedisclosed or released.Furthermore and pursuant to the Pennsylvania Right-to-Know Law (“RTKL”), HighmarkCoverage Advantage must be notified prior to release of information contained in this Filing andbe given the opportunity to respond to requests for such information. Should the Departmentreceive such request or require the release of information contained in this Filing for its ownpurposes, Highmark Coverage Advantage asserts its right to release a redacted version of theFiling. In accordance with the RTKL, please contact the Highmark Coverage Advantage RTKLrepresentative identified below prior to release of any information contained in this Filing:
Ms. Tracie Gray, DirectorHighmark Coverage Advantage 2020 Small Group Market RatesMay 21, 2019Page 4 of 4Lisa Martinelli, Esq.RTKL RepresentativeVP Chief Privacy Officer120 Fifth Avenue, FAP Suite 2114Pittsburgh, PA 15222Furthermore, it should be noted that Highmark Coverage Advantage is equally concerned thateven if this information is released in aggregate form, it still may be easy to identify the carrierthat submitted it.Should you have any questions regarding the attached Filing, please feel free to contact me at(717) 302-3077 or via e-mail at: frank.haver@highmark.com.Sincerely,Frank Haver, FSA, MAAAVice President, Actuarial ServicesHighmark Inc.cc:Robert RoyerTija Hilton-Phillips, Esq.William R. Sarniak
Pennsylvania Actuarial Memorandum1. Basic Information and DataA. Company Information (Table 0)Table 0 has been completed as per the instructions.Please refer to the Excel file“2020 SmGrp HCA PAAMExhibits 052119.xlsm” submitted with this filing containing the department’srequired tables.Note that for the remainder of this document, “Company” refers to Highmark Coverage Advantage,“Market” refers to Small Group, and “Rating Area” refers to Pennsylvania Rating Regions 1, 2, 4, 5, and 6(Western, PA only). No Service Area changes were made since the last approved filing.B. Rate History and Proposed Variations in Rate ChangesThe most recent three years of historical rate changes in the Pennsylvania Small Group Market for theCompany are as follows:Year201920182017Avg. Increase12.3%-1.1%-9.0%SERFF ID#HGHM-131496215HGHM-131014753HGHM-130535903Rate changes vary by plan, as plan benefits need adjusted to help maintain compliance with metal levelrequirements. Other base rate components (pricing actuarial factor and network discount) are also reevaluated each year. For 2020, the Company’s proposed rate revisions vary by plan, according to thedetail presented in the URRT, Worksheet 2, and the PA Rate Template Table 10.C. Average Rate ChangeThe average rate change from Table 10, column AC is a -0.89% increase. The rate change presented inthis table reflects the average rate change over 2019 for the entire plan year, premium weighted basedon the anticipated distribution of quarterly renewals.For comparison, the change in 21-year-old non-tobacco premium PMPM calculated in Table 11, cell AN13,is a 0.6% increase. This rate change reflects the change for first quarter 2020 rates over first quarter 2019rates.D. Membership Count (Table 1)Table 1 has been completed according to the instructions with the average age, age breakdown and totalnumber of members or member months, as indicated in the table. For the 2/1/2019 data, this tablereflects all Small Group enrollment, including enrollment from 2018 and 2019 plan year plans.105/21/2019
E. Benefit ChangesMost plans required benefit changes because of the new Actuarial Value (AV) calculator released for 2020effective dates. The plan changes were mostly required so that the plans remained within the definedmetal level AV requirements, and were enacted by adjusting member cost sharing and the maximum outof pocket levels.F. Experience Period Claims and Premium (Table 2)Please see Table 2 for the experience period data for the most recent calendar year, for the Company andMarket. The experience period paid claims data represents the 2018 calendar year results for all nongrandfathered policies in the single risk pool, with run out through February 2019 (2 months). This datais consistent with the data reported in Section I of Worksheet I of the URRT (see below commentary). TheCompany has offered only ACA-compliant policies in the Market in the experience period. As such, thereis no transitional policy experience to report.The components of this exhibit were developed as follows: The Earned Premium represents actual revenues earned in the experience period.The Allowed Claims represent our best estimate of the total claims prior to member cost sharingincurred during the experience period. The Allowed Claims include:o Two months of run out from the end of the experience period,o Claims processed outside of the Company’s claims system (e.g., settlements andcapitations), ando Our best estimate of claims incurred but not paid as of the end of the run out period.Note that the Incurred Claims and Allowed Claims presented in the URRT are net of thePrescription Drug Rebates, while Table 2 has the Prescription Drug Rebates separately identified.As per the URR instructions, Allowed Claims do not include reinsurance recoveries or poolingcharges, nor do they include quality incentive payments.There are no non-EHB benefits or costs in the experience period.There are no capitated claim services in the experience period.The EHB coverage for pediatric vision benefits are provided by our vision coverage vendor undera capitation arrangement. These costs are 0.17 PMPM uniform across each member in theexperience period and are reflected in Table 2 under the Total EHB Capitation section.Prescription Drug Rebates are used to reduce the level of Incurred Claims in the experienceperiod.The Estimated Risk Adjustment represents our best estimate of the year end risk adjustmenttransfer payment that the Company will incur based on the results in the experience period. Thisamount is developed based on an analysis of Company data (risk scores as defined in the HHSNotice of Benefit and Payment Parameters, as well as other risk transfer formula components),and an estimate as to the Market-wide risk transfer component profile. This Market-wide profileis developed from available Market data, including the Interim Summary Report for 2018 riskadjustment published by CMS, the PA Insurance Department’s calculation of 2018 risk adjustment205/21/2019
transfer amounts using the 5/1/2019 RATEE files, prior years’ risk adjustment transfer results,publicly available data (such as MLR reports), and outside expertise from actuarial consultants.The calculated loss ratio is 82.96%.G. Credibility of Data (Tables 2b, 3b, 4b)The experience period data for this Company is large enough to be fully credible. The results are based100% on the experience period data, adjusted as described herein. Given the Company’s fully crediblerate development, Tables 2b, 3b, and 4b have not been populated.H. Trend Identification (Table 3)Table 3 identifies the annual medical and prescription drug allowed claims cost and utilization trends, asrequested by the Pennsylvania Insurance Department. The definitions of service categories, cost, andutilization in Table 3 are consistent with the URRT instructions. The numbers entered in the Cost andUtilization columns are consistent with those entered in Worksheet I, Section 2 of the URRT, except asnoted below.To arrive at our trend assumption, the experience period cost and utilization data were pulled from theCompany’s claims systems by the defined benefit categories. For the trend component development, theCompany uses results from the combined experience of the following companies within the Highmarkcorporate family: Highmark Inc., Highmark Choice Company, Highmark Health Insurance Company, andHighmark Coverage Advantage. The combined experience used is limited to the Company’s Rating Areaand Market, and provides a more credible base to analyze the trend components impacting the businessin the Company’s Market. The trend development uses a projection of allowed claim PMPMs by servicecategory that takes into account many factors, including the Company’s expectations of changes in innetwork provider contracting levels, changes in out-of-network costs, changes in utilization from medicalmanagement programs, and changes in drug costs from impacts such as generic drug development andnew drug treatments. To reflect the impact of provider contracting on trend, changes in in-networkprovider contracting levels, either known or anticipated, are factored into the cost component of trendusing detailed analysis of the impact on claim levels from each material provider arrangement.These projected costs measure and normalize for benefit leveraging, population aging, and historicalchanges in fee schedules, as well as company-wide utilization management programs, and external trenddrivers. Based upon the coverage and demographics of our membership, our historical claim levels,adjusted for these factors and projected forward, represent the best estimates of trend for this block ofbusiness. Please note that since these historical claim levels are normalized throughout to account forthese forces impacting claim utilization and costs, the claim levels presented will not reflect actualexperience claim levels.For the rate development, the Company uses the aggregate claim trend for all types of service, applied tothe experience period. This is done so that the combined trend is reasonable in consideration of thevarious pricing trend components and the overall anticipated trend level. Based on a review of theprojected normalized annual trends for 2019 and 2020, an overall claim trend of 8.5% (8.5% cost; 0.0%utilization) was selected for the 2020 rate development. Please refer to the “Trend Support” exhibit in the305/21/2019
“2020 Supplemental Exhibits - HCA.xlsx” file showing the historical and projected normalized claim valuesfor the Company’s trend determination, along with the Company’s proposed rate trend.For this Small Group Market filing, quarterly rates are proposed, with rates adjusted each quarter basedon the Total Annual Trend presented in Table 3, excluding the Induced Utilization trend. The quarterlytrend is based on the cost and utilization trend from Table 3. Note that we zeroed out the impact of theCapitation trend in the Composite URRT Trend. The change in the Capitation charge is reflected in theChange in Benefits adjustment discussed below.I. Historical Experience (Table 4)Table 4 presents the most recent 48 months (4 calendar years) of Company data with run-out throughFebruary 2019. Allowed claims are sourced from claim records with adjustments for claims that areoutside of the claims processing system such as hospital settlements. This data, combined with the datafrom other companies within Highmark's corporate family, was used to develop the trend in Table 3.Please see Section H for further details.The Company has offered only ACA-compliant policies in the Market in the experience period. As such,there is no transitional policy experience to report.2. Rate Development & ChangeA. Projected Index Rate, Market-Adjusted Index Rate, & Total Allowed Claims(Table 5)The development of the Projected Index Rate, Projected Market-Adjusted Index Rate, and Projected TotalAllowed Claims, shown in Table 5, closely follows that utilized in the development presented in Worksheet1 of the URRT, a discussion of which can be found in the Part III Actuarial Memorandum submitted in theRate Filing Justification. Some of the items separately identified in Table 5 include: The Change in Morbidity represents an adjustment from the experience period claims to theprojection period. See below for additional commentary related to the projection periodassumptions.The Change in Demographics adjustment reflects the change in age and geography factors weexpect from the experience period to the projection period.The Change in Network adjustment reflects the change in the allowed claims we anticipate dueto changes in in-network discount levels between the experience period and the projectionperiod.The Change in Benefits adjustment reflects the change in the EHB benefits (pediatric benefits) weanticipate between the experience period and the projection period, as well as the change inexpected pharmacy rebates. See below for additional commentary related to these cost changes.Please see the worksheet named “Table 5 Support” in the “2020 Supplemental Exhibits - HCA.xlsx” file forthe calculation of these factors from our experience period data and projected rate results.405/21/2019
Our initial step in developing the index rates is to determine the expected covered membership for therating period. We estimate the covered member base by adjusting for those groups known to have lapsedduring the experience period, and those that we expect will lapse prior to the projection period. Then weadd in expected new business from groups with current transitional coverage moving to ACA plans, andgroups currently with another carrier.As we have seen through the transitional coverage availability period, many of the Small Group marketcustomers have retained their pre-ACA coverage, and have yet to join the ACA risk pool. With thetransitional coverage provisions extension through the end of 2020 for groups that renew on or prior toOctober 1, 2020, we continue to believe that many groups, especially lower-risk groups, will continue toretain their current transitional coverage until required to transfer coverage. The customers who havealready transitioned to the ACA pool to date have been groups with higher morbidity and as more groupsmigrate to the ACA products, we expect the morbidity of the ACA pool to improve. We are expecting thatenrollment drops slightly and that we lose some of the better risk groups. Also, with the continuedavailability of transitional coverage, we expect any new groups moving into ACA products fromtransitional coverage will be of higher morbidity. Thus we expect our morbidity to worsen slightly fromthe experience period and reflect this with a Change in Morbidity adjustment of 1.024.The Change in Benefits adjustment reflects our estimate of the additional costs associated with theaddition of EHBs from the experience period to the coverage period, as well as a change in expectedPharmacy rebates.The development of the Projected Paid to Allowed Ratio shown in Table 5 is presented in the “2020Supplemental Exhibits - HCA.xlsx” file in the “Table 5 Paid-to-Allowed” worksheet. This value is consistentwith the paid-to-allowed ratio in the URRT Worksheet 2, line 4.15 Incurred Claims, divided by line 4.11Allowed Claims.Table 5 reflects that we are assuming a Projected Risk Adjustment receipt in the projection period of 86.20 PMPM. This amount reflects an anticipated risk transfer receipt of 83.53, which is trended by theaverage 2020 pricing trend to arrive at the value of 86.20 reflected in Table 5.To arrive at the anticipated risk transfer for 2020, we bring in the risk adjustment calculation componentsfor the projected 2020 Company portfolio (as discussed above), and use our current knowledge of thePennsylvania Small Group market profile to estimate the risk adjustment components for the entire stateMarket. This Market-wide profile is developed from available Market data, including the Interim SummaryReport on Risk Adjustment for the 2018 Benefit Year published by CMS, the PA Insurance Department’scalculation of 2018 risk adjustment transfer amounts using the 5/1/2019 RATEE files, prior years’ riskadjustment transfer results, publicly available data (such as MLR reports and rate filings), and outsideexpertise from actuarial consultants.In analyzing the risk transfer components from Highmark’s corporate family of businesses, we havenoticed a significant difference in results between the various regions (Western, Central, andNortheastern Pennsylvania). Thus when projecting the risk transfer components to 2020, we determine505/21/2019
each region’s risk transfer results separately to arrive at the estimated risk transfer results for eachcompany, as appropriate for each company’s region.The Company considered the impact of the high-cost risk pooling payment for the Small Group market,first implemented in 2018, in its development of its anticipated risk transfer for 2020, and is assuming thatthe net cost (payments less recoveries) will be negligible for the 2020 projection period.The Projected Paid Exchange User Fees are developed from the Exchange user fees to be charged by CMSin 2020, multiplied by the percentage of business we expect to purchase Market coverage through theExchange for this Company. For this Company, all business will be offered Off Exchange in 2020, so thereare no Exchange User Fees charged in the rate development.For this Small Group Market filing, Table 5A has been completed, showing the number of member monthsrenewing by quarter, and the quarterly Single Risk Pool Projected Allowed Claims.B. Retention Items (Table 6)Table 6 has been completed with the requested retention elements for the proposed rates for the ratingperiod. The administrative expenses and taxes and fees presented in the rate development in Table 6 cellC53 equal the Taxes and Fees in Table 10. Due to the Risk Adjustment User Fee not having a line in Table6, the sum of the taxes and fees in Table 6 will not match the total taxes and fees in Table 6.Administrative costs reflect internal costs that the Company is projected to incur in the projectedexperience period, and are developed from standard expense allocation methods. Agent/broker fees andcommissions reflect our anticipated costs for these items in the experience period.The development of internal administrative costs utilizes an allocation of Company costs back to lines ofbusiness. The allocation method uses measureable stats such as claims worked, inquiries worked,contracts, and members to allocate the majority of expenses. When possible, expenses are direct chargedif they can be identified by product instead of going through an allocation method. For corporateallocations, a TCI (total costs incurred) methodology is generally used to allocate by product.The following Taxes and Fees were included in the rate development: 2.16 per member per annum for the Risk Adjustment User Fee; and2.8% for the Health Insurer Provider Fee.Note the following regarding plan level retention items: The rate development reflects a 0% risk/contribution to surplus margin for all products and plans.The Company has voluntarily refrained from including a risk and contingency factor in thisfiling. By this voluntary action, the Company is not waiving any right to include a risk andcontingency factor which the Company believes is consistent with historical and legalinterpretations of the Company and the Department.The administrative expenses do not vary by plan.605/21/2019
Expenses for Quality Improvement Initiatives are estimated to be 7% of internal Companyexpenses, based upon historical analysis of these costs.Please note that for the Small Group Market the Projected Required Revenue PMPM shown in Table 6 willnot match the URRT Worksheet 2 value in line 4.17 Premium since the value in the URRT is based on aJanuary 1 effective date without reflecting the impact of quarterly rates in the Small Group market.C. Normalized Market-Adjusted Projected Allowed Total Claims (Table 7)The normalization factors presented in Table 7 are each determined from the underlying membershipdemographics expected in the projected rating period. The 2019 values are pulled from the prior year’sfiling, while the 2020 values represent our projection for 2020 assumed in the 2020 rate development.The Age Factor is the weighted average of the Average Age Factors for the Current ACA Book of Businessas of the End of Year 2018 and for the Membership Moving to the ACA Book (from transitional and newbusiness).The Geographic Calibration Factor is the weighted average of the Area Factors by County. This average isweighted by membership.The Tobacco Surcharge is not applicable since the Company does not use one.D. Components of Rate Change (Tables 8 and 9)Table 8 presents the components of change in the proposed 2020 Calibrated Plan Adjusted Index Rate(PMPM). The 2019 base period allowed claims is carried over from the 2019 rate filing. Row H of Table 8may differ from Row A due to the detailed breakdown of all the components of the increases in rows Bthrough G not calculating exactly to the change in the calibrated plan adjusted index rate in Row A, whichis the more accurate percentage change based on the rate development.Table 9 presents the data elements supporting the calculations in Table 8. The amounts shown in the2019 Column match those entered in the 2019 Column in the plan year 2019 rate filing.3. Plan Rate Development (Table 10)Table 10 showing the plan rate development has been completed following the instructions in the 2020ACA-Compliant Health Insurance Rate Filing Guidance. This table shows the plans that the Companyintends to offer in 2020, as well as plans discontinued from the 2019 portfolio for 2020. Since many SmallGroup market enrollees as of 2/1/18 are still in plan year 2018 plans, the enrollees in plan year 2018 planswere mapped to the plan year 2019 plan that we anticipate they will renew into in 2019. The calibratedplan adjusted index rates for 2020 and 2019, and all of the supporting factors, are calculated according tothe instructions.Each plan takes the Market Adjusted Index Rate and multiplies by the Pricing AV, Benefit Richness Factor,Benefits in Addition to EHB Factor, Provider Network Factor, Catastrophic Eligibility Factor, and NonFunding of CSR Adjustment Factor (not applicable to Small Group) in order to calculate the Pure Premium.705/21/2019
The Pure Premium is then grossed up to account for expenses (Admin Costs, Taxes & Fees, and Profit orContingency) in order to calculate the Calibrated Plan Adjusted Index Rate. Since each component of theCalibrated Plan Adjusted Index Rate is applied multiplicatively (including the Plan AV Pricing Value), planpremiums are in proportion to the Plan AV Pricing Values.Note that the HHS Actuarial Value Calculator was able to accommodate all of the Company’s benefitdesigns, and that no adjustments were needed from the values produced by the calculator.The requested Induced Utilization Exhibit was completed and is presented within the “2020 SupplementalExhibits - HCA.xlsx” file submitted with this filing (worksheet named “Induced Utilization”). Note that thecalculated Induced Utilization factor in Column (8) is a component of the Actuarial Value AllowableModifier. As such, it is adjusted by the Average Benefit Richness normalization factor of 1.1039. Inmultiplying the Induced Utilization column (8) result by the Average Benefit Richness normalization factor,the result is the Induced Utilization factor appropriate for the plan’s metal level (before normalization),which are the CMS-prescribed assumptions used in the risk adjustment transfer calculation. These factorshave been unchanged since they were originally developed for the 2014 rating period.The member-weighted average of the pure plan-level Induced Utilization factors in the last column of theinduced utilization exhibit against the projected membership does match the 1.000 expectation of theDepartment. This calculation can be seen at the bottom of the Induced Utilization Exhibit, where theformulas used in the calculation have been retained.The Child Capping Adjustment is applied to the Age Calibration Factor in Table 10 to reflect the limitationon the number of children allowed in rating. This factor is determined by estimating the amount of lostrevenue due to this restriction, and applying the resulting factor to the normalized age factor in the baserate development. Support for the calibration factors is shown in the “2020 Supplemental Exhibits HCA
Bureau of Life, Accident & Health Insurance Commonwealth of Pennsylvania Insurance Department 1311 Strawberry Square Harrisburg, PA 17120 Re: Highmark Coverage Advantage (HCA) 2020 ACA Rate Filing (Small Group Market) HCA Filing # 1A-SG-HCA-2019 (SERFF Filing # HGHM-131937188)