Transcription
The Modernization ofCI Global Asset Management –A Product PerspectiveGeraldo Ferreira,SVP & Head of Investment Products & Manager OversightCI Global Asset ManagementJune 22, 2021
Themodernizationof CI GAM –A productperspective1CI GAM’s strategic priorities2Alternative investments – Private equity3Liquid alternatives4Crypto solutions5Enhancements to existing funds & optionsfor today’s market realities6CI GAM – Investment Management updateFOR ADVISOR USE ONLY – NOT FOR DISTRIBUTION TO INVESTORS2
CI Global Asset Management’sstrategic priorities
CI Global Asset Management – Strategic prioritiesSTRATEGIC RATIONALEOUR 3 STRATEGIC PRIORITIESModernize our assetmanagement businessExpand our wealthmanagement platformGlobalizeour company Evolving demographics Shifts in investor preferences Changing expectations forservicing and support Ongoing regulatory change Role of advisor is more importantthan ever Our breadth of capabilitiesuniquely positions us to beCanada’s market leader Consumers’ lives are becomingincreasingly complex and digital Scale is becoming increasinglyimportant, and difficult to achievein Canada Investors want to be serviced andsupported globally Talent acquisition from globalmarketsFOR ADVISOR USE ONLY – NOT FOR DISTRIBUTION TO INVESTORS4
CI GAM – Modernizing our asset management businessWHY?MODERNIZE OUR ASSET MANAGEMENT BUSINESSEvolvingDemographicsShifts in investorpreferencesFOR ADVISOR USE ONLY – NOT FOR DISTRIBUTION TO INVESTORSIncreasingly complex& challengingfinancial marketsChangingexpectations forservices & supportOn-goingregulatory changes5
CI GAM – Modernizing our asset management businessHOW?MODERNIZE OUR ASSET MANAGEMENT BUSINESSLaunch new &innovative investmentsolutionsEnhance existingproductsFOR ADVISOR USE ONLY – NOT FOR DISTRIBUTION TO INVESTORSSimplify ourinvestment productline-upEnhance CI GAM’sin-house investmentcapabilitiesExpand ourexternal investmentmanagementexpertise6
CI GAM investment products – At-a-Glance Assets Under Management: 126 billion asof May 31, 2022 Solutions include mutual funds, ETFs, privatepools, SMAs, corporate class & alternatives Strategies span asset classes, geographicregions, sectors, investment styles, multi-asset,cryptocurrencies, & ESG Extensive In-house investment expertise –100 investment professionals External investment expertise –17 sub-advisory relationshipsFOR ADVISOR USE ONLY – NOT FOR DISTRIBUTION TO INVESTORSOur investment products & strategiesshould be designed to help clientsachieve the outcomes they desire.However, our market & regulatoryenvironment is not static, and ourinvestment product line-up needs to beconstantly reviewed & improved.7
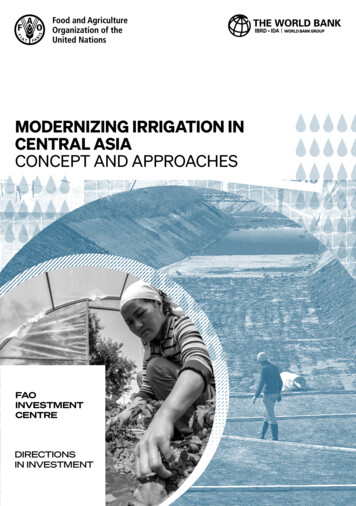
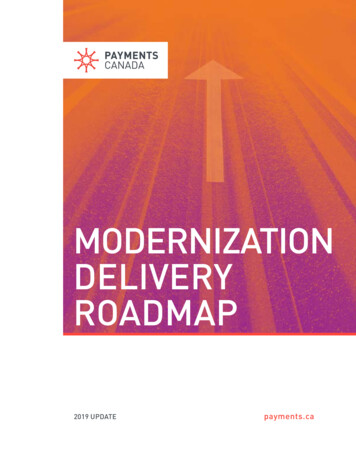
Investment products – Realities of today’s marketsWhat is required to generate 8%? Markets have become more challenging – increasedvolatility & correlations Generating 8% returns on a “balanced” portfoliowith traditional investments typically requirestaking on more risk One area of focus for us has been on how we canimprove the traditional 60/40 portfolio? What new,arguably better, building blocks can we add? You need solutions to help your clients meet theirinvestment goals For CI GAM, one approach has been the launchingof Alternative Investments – specifically, privateequity and liquid alternative solutionsSource: Marquette Associates.FOR ADVISOR USE ONLY – NOT FOR DISTRIBUTION TO %20%14%10%10%29%26%10%10%2021 - No Alts17.40%2021 - Alts11.73%30%0%Std Dev29%20068.94%Broad Fixed IncomeU.S. Large Cap CoreDeveloped Large CapReal EstatePrivate CreditHigh YieldU.S. Small Cap CoreEmerging MarketInfrastructurePrivate Equity8
Alternative investments Private equity solutions
Privates – What, who & whyWHAT are private investments? Unlike public market investments, private marketopportunities are: Not available or listed on any public exchanges, Do not have publicly available pricing or valuations, &WHOinvests in private investments? Institutional investors and UHNW individuals Endowments & foundations, pension plans, familyoffices, insurance companies, and retail investors* Do not trade in a standardized manner More illiquid than public market investments Investors are paid through recurring distributionsover the life of the fund Generally accessible through private funds or directinvestments in private companies Simply put: buy companies, add value, & sellWHYinvest in private ficationbenefitsInflationprotection*Sources: McKinsey Global Private Markets Review 2022 and Preqin Investor Outlook: Alternative Investments H1, 2022FOR ADVISOR USE ONLY – NOT FOR DISTRIBUTION TO INVESTORS10
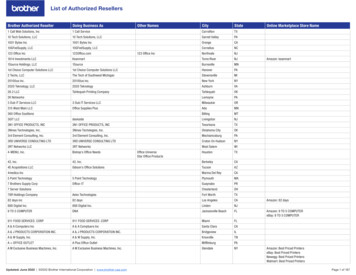
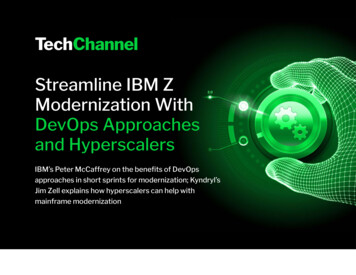
CPP recognized the need to add privates after GFCDiversified investment portfolio weathered Q4 market volatilityQuarterly net nominal returns (after costs)Quarter endingCalendar 2021 return: 13.8%3.4%3.8%3.5%Jun-21Sep-211 yearAnnualized netreturns16.8%Dec-215 year10.0%Real estate9%Infrastructure9%Fixed income7%Private equities32%Global36%Canada16%10 year10.8% 539BFixed income32%Equities63%Mar-22 98BPublic equities27%Credit16%-2.9%Mar-212022Real assets5%2.4%Fiscal 2022 return: 6.8%2006Canada64%Global84%Source: CPP Investments. Annual Report 2022. Assets as of March 31, 20021Net returns are reported net of costsFOR ADVISOR USE ONLY – NOT FOR DISTRIBUTION TO INVESTORS11
Our approach with alternatives – Private equitySelect best-in-classmanagersExperiencedStrong GP relationshipsSolid & consistentperformanceFirm AUM* 141.9 billion 49.8 billion 92.9 billionEstablished197219721982Head officeNew York CityChicagoBostonEmployees &offices900 , 24 countries250 , 11 countries800 , 11 countriesSpecialists inPrivate Real AssetsPrivate Equities & CreditPrivate Equities, Credit &Real AssetsCanadianInstitutionalRelationships*Global presenceCanadian clients &CI exclusivity*Representative list. Assets in USD as of December 31, 2021.FOR ADVISOR USE ONLY – NOT FOR DISTRIBUTION TO INVESTORS12
Our alternatives line-up – Private equityInception dateSold byProduct eligibilityMin investmentManagement feeCI Global PrivateReal Estate FundAugust 2017Offering MemorandumCanadian accredited investors 100,000 USD1.1%CI Adams Street Global PrivateMarkets FundDecember 2020Offering MemorandumCanadian accredited investors 100,000 USD1.4%Performance feen/a10% subject to High-Water MarkQuarterly24 months3 Years starting when capital is calledQuarterly post-lock periodPrivate Real Estate – Industrial, Residential,Office & Retail1-Yr: 10.2%, 2-Yr: 8.1%, 3-Yr: 7.3%, SI: 7.4%Quarterly12 months3 Years starting when capital is calledQuarterly post-lock periodPrivate Equity – Primary, Secondary, CoInvestment, Growth & Private Credit1-Yr: 40.8%, SI: 40.8%NameDistributions & NAVInvestment periodLock-up periodRedemptionsUnderlying investmentsReturns (Class I)**, net IRR***CI HarbourVest Private InfrastructureIncome FundJune 2022Offering MemorandumCanadian accredited investors & QPs* 100,000 USD1.0%5% of distributions subject to performancehurdles of 1. 5% quarterly & 2. TVI TVPIQuarterly24 months3 Years starting when capital is calledQuarterly post-lock periodPrivate Infrastructure – Seaports, Toll Roads,Airports, Rail Leasing, Utilities & Renewables1-Yr: 10.8%**** Qualified Purchaser (QP) is a U.S. term and defined as an individual or family-owned business that owns 5 million USD or more in investments, excluding primary residence of property used for business**Data as of December 31, 2021. Net of Fees. Please see important information and disclaimers regarding performance on slide . Past performance is not necessarily indicative of future results and therecan be no assurance that comparable results will be met.***Performance is of HarbourVest Adelaide Feeder the seed portfolio for the HarbourVest Infrastructure Income Cayman Parallel partnership L.P.FOR ADVISOR USE ONLY – NOT FOR DISTRIBUTION TO INVESTORS13
Liquid alternative solutions
Liquid alternatives market in CanadaIntroduced in 2018, liquid alternatives are essentially hedge funds strategies madeavailable in a mutual structureInvestmentparameterMutual fundsMarketNeutral8%Liquid alternativesLeverageProhibitedUp to 300% of NAV*Borrowing5% max, for limitedpurposes50% max of NAV subjectto restrictionsShort-sellingUp to 20%, 5% single issuerlimit, 150% cash coverUp to 50% of NAV,10% single issuer limit**ConcentrationUp to 10% of NAVUp to 20% of NAVIlliquidinvestmentsUp to 10% at a time,hard limit of 15%Up to 10% at a time,hard limit of 15%RestrictionsReal property, nonguaranteed mortgages,loan syndicationsReal property, nonguaranteed mortgages,loan syndicationsOther6%Equity37%Total AUM:MultiStrategy24% 20.06billion*Credit25%Source: CAASA as of November 30, 2021.FOR ADVISOR USE ONLY – NOT FOR DISTRIBUTION TO INVESTORS15
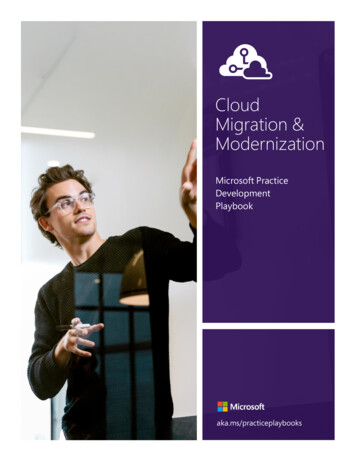
Alternative strategies can help protect and diversifyRisk-rewardMax drawdown101.0-10Return (%)9Return (%)1.00Global hedge funds8MSCI World GR rd DeviationGlobal Hedge Funds20Alternative strategies haveoutperformed on a risk-adjusted andabsolute basis compared to globalequities.0.20.30.0-606BetaMSCI World GRIndexAlternative strategies have declined bymuch less during severe marketdownturns.Global Hedge FundsMSCI World GR IndexAlternative strategies can serve asportfolio diversifiers, having shown avery low correlation to the movementsof global equity markets.Source: Morningstar Research Inc. from common inception (1/1/1990) to 12/31/2021. Returns are shown in USD. Global Hedge Funds HFRI Fund Weighted Composite.FOR ADVISOR USE ONLY – NOT FOR DISTRIBUTION TO INVESTORS16
The core pillars of CI GAM’s liquid alternative strategiesExperienceTrack recordCI GAM’s portfolio managers allhave extensive experiencerunning alternative strategies.Experience matters, butnumbers don’t lie. Trackrecords for CI GAM’s strategiesare readily available.FOR ADVISOR USE ONLY – NOT FOR DISTRIBUTION TO INVESTORSAlignmentCI GAM’s liquid alt strategiescharge performance fees,ensuring alignment with clientsas the fee is earned only if themanagers perform well.17
CI GAM’s liquid alternative lineupCI Munro Alternative GlobalGrowth FundPotential returnCI Alternative North AmericanOpportunities FundCI Alternative DiversifiedOpportunities FundCI Marret AlternativeAbsolute Return Bond FundCI Marret AlternativeEnhanced Yield FundCI Alternative InvestmentGrade Credit Fund*Potential risk*Formerly CI Lawrence Park Alternative Investment Grade Credit Fund, renamed effective June 25, 2021.FOR ADVISOR USE ONLY – NOT FOR DISTRIBUTION TO INVESTORS18
CI GAM’s liquid alternative lineupCIFSC categoryStrategyPortfolio ManagersInvestmentobjectiveRisk ratingMgmt. fee (F)Performance feeHurdleETF tickersCI Alternative InvestmentGrade CreditCI Marret AlternativeEnhanced YieldCI Marret AlternativeAbsolute Return BondCI Alternative DiversifiedOpportunitiesCI Alternative NorthAmerican OpportunitiesCI Munro AlternativeGlobal GrowthAlternative - Credit FocusedAlternative - Credit FocusedAlternative - Credit FocusedAlternative - Credit FocusedAlternative - Equity FocusedAlternative - Equity FocusedLong/Short CreditYield Focused FIGlobal Macro FITotal Return/Growth FINorth American L/S EquityGlobal L/S EquityAndrew Torres, Jason Pitre,Jason GoddardPaul Sandhu, Adam Tuer,Adrian PrencPaul Sandhu, Adam Tuer,Adrian PrencPaul Sandhu, Adam Tuer,Adrian PrencPeter Hofstra, Brian Huen,Jeremy Rosa, BuntyNick Griffin, James Tsindis,Mahairhu, Greg Quickmire, Kieran Moore, Jeremy GibsonAli PervezSeeks to generate consistentpositive total returns with anemphasis on capitalpreservation and lowcorrelation to traditionalequity and fixed-incomemarkets.Seeks to provide income withlow volatility over a marketcycle regardless of marketconditions or general marketdirection, while targeting lowcorrelation to equity andtraditional income.Low-med0.80%10% (HWM)Low-med0.80%10% (HWM)Yield on FTSE Canada ShortTerm Govt Bond Index 1.00%CMEY & CMEY.UFTSE Canada All Corp BondIndexCRED & CRED.UFOR ADVISOR USE ONLY – NOT FOR DISTRIBUTION TO INVESTORSSeeks to achieve capitalappreciation and provideSeeks to generate highSeeks to generate positiveSeeks to provide positiveattractive risk-adjustedabsolute returns over therisk-adjusted, absoluteabsolute returns with lowreturns over an investmentlong-term, by balancing a returns through exposure tovolatility over a market cycle cycle by investing in debtcapital preservation mindset global growth equities overregardless of marketinstruments across the creditwith investing in quality,the medium to long term,conditions or general market spectrum, as well as equities,growth-oriented Northwhile maintaining a capitaldirectioncommodities and currencies,American equities.preservation mindset.in both domestic and foreignmarkets.Low-med0.80%10% (HWM)Low-med0.80%15% (HWM)10-Yr Govt of Canada BondYield 1.0%10-Yr Govt of Canada BondYield 1.0%CMAR & CMAR.UCMDO & CMDO.UMedium0.90%15% (HWM)Medium0.90%15% (HWM)Greater of 6% or 10-Yr Govt Greater of 6% or 10-Yr Govt ofof Canada Bond Yield 3.5% Canada Bond Yield 3.5%CNAO & CNAO.UCMAG & CMAG.U19
CI GAM is a leader in the liquid alternative spaceLiquid alternative net AUM by firm (in billions) 5 4.52 4 3.23 3 2.72 2.32 2 1.44 1.29 1.27 0.99 1 0.98 0.71 0CI Investments Picton MahoneyPurpose1832 AssetInc.AssetInvestments Inc. ManagementManagementL.P.CIBC AssetManagement3iQ Corp.EHP Funds Inc. Forge First Asset DesjardinsHorizons ETFsManagement Investments Inc. ManagementInc.(Canada) Inc.Source: IFIC, as of April 30, 2022. Includes crypto ETF assets.FOR ADVISOR USE ONLY – NOT FOR DISTRIBUTION TO INVESTORS20
Where do CI GAM’s liquid alts fit in a portfolio?CI Munro AlternativeGlobal Growth FundCI Marret Alternative AbsoluteReturn Bond Fund & CI AlternativeDiversified Opportunities FundAdd tactical asset allocation and activeduration and credit managementCI Alternative Investment GradeCredit Fund & CI Marret AlternativeEnhanced Yield FundOtherDe-risk long only global nhance portfolio yieldGovernmentbondsDomesticequitiesCI Alternative North AmericanOpportunities FundDe-risk long only North American equitiesExpansion of our line-up in September with: CI Alternative Multi-Strategy FundFOR ADVISOR USE ONLY – NOT FOR DISTRIBUTION TO INVESTORS21
Crypto solutions
Cryptos in Canada – Client & institutional demandApril 2020Feb 2021April 2021September 2021First closed-end bitcoinfund launched in CanadaFollowed by the world’sfirst bitcoin ETFCrypto ETFassets inCanadaBitcoin 7,778 6,687In millions ofdollars 2,615 6,510 2,358 5,872 1,999 2,064 1,815 4,800Multi-Crypto ETFs launched 4,026 4,649 5,377 4,408 0In less than 1-year, Canadian crypto ETF assetsreached 7.5 billionFYI: BOC Survey reports over 5% of Canadiansown bitcoinMix 7,452The world’s first EthereumETFs launchedFlows have primarily been driven byinstitutional investors & DIY investorsEtherJan-2021Dec-2021Jan-2022Feb-2022Feb Mar Apr May JunJulAug SepOct2021 2021 2021 2021 2021 2021 2021 2021 2021Bitcoin 546 467 2,572 684 335 (18) 103 (4) 278Ether–– 92 528 91 55 169 133 224Multi––––––– 3 26Total 546 467 2,664 1,212 426 37 272 132 528No. of ETFs 2310111111121313FlowsMar-2022Apr-2022Nov DecJanFeb Mar Apr2021 ‘21 2022 2022 2022 2022 245 230 (63) 303 342 (231) 333 (15) (54) 17 65 17 17 (3) 1 5 1 0.1 594 212 (115) 325 408 (214)171919202020Source: Investor Economics, IFIC, & Bank of Canada, “Bitcoin Awareness, Ownership & Use: 2016-20” – Staff Discission Paper, April 19, 2022.FOR ADVISOR USE ONLY – NOT FOR DISTRIBUTION TO INVESTORS23
Performance of Bitcoin versus other asset classesAsset class total local returns over the last 7 calendar yearsAsset ClassesBest Returning Asset Class*Worst Returning Asset Class*BitcoinNatural GasNasdaq CompositeU.S. Large CapsWTI OilGlobal Large CapsCanadian Large CapsU.S. Small CapsGoldCanadian Small CapsGlobal InfrastructureGlobal REITsEmerging Market EquitiesInternational Large CapsU.S. High Yield BondsU.S. Aggregate BondsU.S. TIPSU.S. DollarU.S. Long-Term Govt BondsEther7-year annualized data2022 YTD2021202020192018201720162015ReturnGrowth of 1KVolatilityNatural 6.4%-21.3%-47.1%BitcoinUS LT Gv itcoinU.S. 5.5%BitcoinNatural %U.S. .0%4.4%-4.2%n/aBitcoinNatural coinUS LT Gv I tcoinUS LT Gv %5.2%5.2%4.7%4.2%1.5%0.7%0.7%-0.7%n/a–– 137,149 3,083 2,556 2,239 1,902 1,810 1,704 1,641 1,543 1,502 1,433 1,430 1,425 1,379 1,335 1,109 1,051 1,050 .4%n/aOver a 7-year time frame, a 1,000 investment in Bitcoin would be valued at 137,149*Source: Morningstar & Bloomberg. Ranked by assets with 7 or more calendar year returns. 7-Year Annualized Return Period is from June 1, 2015 to May 31, 2022.FOR ADVISOR USE ONLY – NOT FOR DISTRIBUTION TO INVESTORS24
CI GAM’s crypto product suite – secure, lowest-cost, & liquidPassive strategies Rational to offer secure,industry leading low-cost,& liquid solution Partnered with a firm thatunderstands the cryptoecosystem – Galaxy Digital High-Return potential& sure typeManagement fee Allocations of 0.5% to 2.5%typically have greatest marginalimprovement on a portfoliorisk-adjusted returns*MERStorageMF version availableMomentumCI Galaxy Bitcoin ETFCI Galaxy Ethereum ETFCI Galaxy Multi-Crypto ETFBTCX.B (CAD Unhedged)BTCX.U (US )ETHX.B (CAD Unhedged)ETHX.U (US )CMCX.B (CAD Unhedged)CMCX.U (US )BitcoinEtherBitcoin and EtherPassive, long exposurePassive, long exposureSystematic, momentumdriven for lower volatilityPhysicalPhysicalIndirect, owns BTCXand ETHX (ETF-of-ETF)0.40%0.40%0.50%0.95% (capped)0.95% (capped)1.05% (capped)Offline, cold walletsOffline, cold walletsIndirect offline, cold walletthrough ownership of BTCXand ETHXYesYesNo*Galaxy Fund Management & Bloomberg – Cryptocurrencies: 27 Frequently Asked Questions and Answers for Curious InvestorsFOR ADVISOR USE ONLY – NOT FOR DISTRIBUTION TO INVESTORS25
Thematic ETFs providing exposure tothe blockchain & metaverseSample holdings*Passive strategiesCI Galaxy Blockchain ManagementFeeRisk RatingCIFSC AssetClassRebalancingRegisteredPlansMF versionavailableCI Galaxy Metaverse ETFCI Galaxy Blockchain ETFProvides efficient & targeted exposure to companiesthat are engaged in the development of digitalecosystems through interaction, enablement &connectivity of the metaverseAlerian Galaxy Global Cryptocurrency-Focused Alerian Galaxy Immersive Digital Worlds Hedge toBlockchain Equity Hedged to CAD Dollars IndexCAD Dollars IndexTSX Ticker: CBCXTSX Ticker: CMVXProvides efficient & targeted exposure tocompanies that seek to benefit from thedevelopment of blockchain & crypto technologiesCI Global Asset ManagementCI Global Asset Management0.50%0.50%HighHighGlobal EquityGlobal EquityQuarterlyQuarterlyYesYesNoNoCI Galaxy Metaverse ETF*Sample holdings for CBCX and CMCX as of May 6, 2022. Companies shown are for illustrative purposes only.FOR ADVISOR USE ONLY – NOT FOR DISTRIBUTION TO INVESTORS26
Enhancements to existing funds &options for today’s market realities
Challenges & solutionsToday’s market realities CI GAM solutions for considerationHighinflationRising interestratesFOR ADVISOR USE ONLY – NOT FOR DISTRIBUTION TO iticaluncertainty28
Challenges & solutionsCI GAM solutions for consideration CI GAM solutions for considerationCreditReal assetsFOR ADVISOR USE ONLY – NOT FOR DISTRIBUTION TO INVESTORSCashTactical balanced29
CI GAM select credit solutions – 49.8%44.8%56.5%6.6%14.9%CI Global InvestmentGrade Class CI CorporateBond FundCI Global UnconstrainedBond Private PoolCI Floating RateIncome FundCI High YieldBond Fund FundGrade A FundGrade A Refinitiv LipperInvestment Grade CorporatesHigh Yield CorporatesLoans & Floating BondsPreferred SharesEmerging Market BondsGovernment BondsCashRiskFor illustrative purposes only.Source: CI GAM, Morningstar Research Inc. Asset Mix and Morningstar Star Ratings (Overall) as of May 31, 2022, exceptpt for CI Global Unconstrained Bond Private Pool, which is as of April 30, 2022.FOR ADVISOR USE ONLYONLY –– NOTNOT DISTRIBUTEDFOR DISTRIBUTIONTO INVESTORSTO INVESTORS30
CI Floating Rate Income FundStrategy overviewProduct enhancementsA higher yielding credit strategy that provides exposure to a diversifiedset of floating rate securities like term loans, floating short-durationcorporate bonds and preferred shares. CI GAM reduces management fee to 0.35% on Series F Asset mix and portfolio statistics5.6%Term Loans7.8%3.0%3.9%12.7%Yield5.75%Floating BondsYield-to-Call High YieldFloating Preferreds54.7%Short-Term Inv. GradeBB-Duration0.4CashTrailing returns & quartile rankYTD-2.9%#61 Yr-0.6%#82 Yr6.7%#23 Yr3.4%#1CI GAM launches ETF Series – TSX Ticker: CFRT CreditQualityFixed-to-Float11.3%ReturnFund Rank² 4 Yr3.2%#1S.I.¹3.1%#1Lowest F class management fee in the Floating Rate Loancategory and 2nd lowest MER at 0.59% - fee reduction effectiveFeb 22, 2022Launched April 19, 2022Reasons to own Floating rate strategies may be suitable in a stable and rising rateenvironment Acts as a complementary investment within portfolios to diversifyand enhance yield Leverage an experienced team managing one of the bestperforming floating rate funds in Canada – 5-star Morningstarrating and FundGrade A Award winner¹Inception date is June 1, 2017. ²Excludes virtual class USD series funds given most base CAD floating rate products hedge most or all foreign currency exposure; therefore, USD series incorporate the returnof currency. Since we do not offer a USD fund series it is not appropriate to compare our funds returns to USD series from competitors. Source: CI Global Asset Management, Morningstar Research Inc. Assetmix and portfolio statistics as of June 6, 2022; fund performance as of May 31, 2022. Management fee and estimated MER effective February 22, 2022.FOR ADVISOR USE ONLY – NOT FOR DISTRIBUTION TO INVESTORS31
Historically infrastructure and real assets have outperformed inperiods of high inflation25%20%15%10%5%0%U.S.GlobalReal estate Real ge annual total returnsLow growth and low inflation environment25%20%15%10%5%0%U.S.GlobalReal estate Real ge annual total returnsLow growth and high inflation environmentAverage annual total returnsAverage annual total returnsHigh growth and high inflation environment25%20%15%10%5%0%U.S.GlobalReal estate Real estateGlobalinfraStocksGovernmentbondsIGbondsLow growth and low inflation environment25%20%15%10%5%0%U.S.GlobalReal estate Real e: Blackrock, Bloomberg, Barclays (investment grade: US Agg Bond; Gov’t Bonds: US Gov’t Agg TR), NCREF (U.S. Real Estate: NPI), MSCI (Global Real Estate); EDHEC (Infrastructure: All Equity) and S&P(Stocks: S&P 599) as of December 31, 2020 (annual data since 2001)FOR ADVISOR USE ONLY – NOT FOR DISTRIBUTION TO INVESTORS32
Protecting in an inflationary environment –CI GAM Real Asset solutionsInfrastructureReal EstateReal AssetsCI GlobalInfrastructure FundCI GlobalInfrastructurePrivate PoolCI Global REIT FundCI Global REIT ClassCI Global REITPrivate PoolETF seriesNoYes (dual-class)Ticker: CINFNoYes (dual-class)Ticker: CGREPortfolio ManagerKevin McSweeney, MBA, CFALee Goldman, MBA, CFAKate MacDonald, CFAChris Couprie, CFALee Goldman, MBA, CFAKate MacDonald, CFAChris Couprie, CFAGlobal infrastructure securitiesGlobal real estate securitiesCanadian-focused real estate securitiesPrivate pool has max 20% Canadian exposurePrivate pool is more concentratedPrivate pool has max 30% Canadian exposureRIT has ability to opportunistically invest up to 30% in Global securitiesMandateDifference in fundsCI CanadianREIT ETFCI CanadianREIT FundCI Global Real AssetsPrivate PoolTicker: RITNoMonthly, 0.0345 per unitYield: 4.04%Series F: 0.90%Monthly, fixed at 0.034per unitYield: 3.44%Series F: 0.70%Monthly,0.0725 per unitYield: 5.97%Series F: 0.90%Monthly, 0.043 per unitYield: 4.41%Series F: 0.70%Monthly, 0.0675 per unitYield: 4.29%0.75%Monthly, 0.0667 per unitYield: 3.14%Series F: 1.00%Series F: 1.23%Series F: 0.92%Series F: 1.23%Series F: 0.96%0.87%Series F: 1.26%Minimum 500 25,000 500 25,000N/A 500Risk ratingLow to mediumLow to mediumMediumMediumMediumMedium - – Distribution (Series F)Management feeMERMorningstar star ratingPredictable and steady cash flowsLong-term inflation hedgeFOR ADVISOR USE ONLY – NOT FOR DISTRIBUTION TO INVESTORSPortfolio diversification benefitsAn experienced and proven team33
CI GAM Real Asset Solutions have delivered strongreturns vs. peersYTD1 year3 years5 years10 lerankRet.QuartilerankRet.QuartilerankRet.CI Global Infrastructure FGlobal InfrastructureEquity2.1%310.9%37.9%17.0%110.1%CI Global Infrastructure Private Pl FGlobal InfrastructureEquity2.2%313.5%2CI Global REIT FReal Estate Equity-14.0%33.9%2CI Global REIT Private Pool FReal Estate Equity-12.9%26.6%1CI Canadian REIT ETFReal Estate Equity-9.5%16.9%17.1%18.2%19.6%CI Canadian REIT Fund FReal Estate Equity-9.5%17.1%17.9%18.4%110.2%Global Equity-5.9%18.8%1FundSince inceptionQuartile 22/2009 11.5%15/26/2020 12.5%17/28/20056.9%25/26/2020 11.8%2111/15/20010.4%4116/7/201012.2%15/26/2020 10.2%2REIT5.6%26.4%26.9%4Real AssetsCI Global Real Asset Private Pool FSource: CI GAM, Morningstar Research Inc., as May 31, 2022. Quartile ranks are for absolute returns.FOR ADVISOR USE ONLY – NOT FOR DISTRIBUTION TO INVESTORS34
CI High Interest Savings Fund & ETF –Earn more on cash savingsCI High InterestSavings FundFund codes/ TickerInception dateSeries A: CIG 2113Series F: CIG 4113TSX: CSAVJuly 30, 2019June 14, 2019Distribution frequencyInvestment team2.0%1.5%1.95%1.19%0.5%MonthlyRegistered tax plan statusGross yield on cash alternatives1.0%Series A: 0.24%Series F: 0.14%Management feeAsset classCI High InterestSavings ETF0.14%Eligible0.34%0.0%CSAVAverage 1-yearcashable GICAverage High InterestSaving Account1GrossCanadian Money MarketCI Global Asset Managementyield as at June 2. 2021. Source: CI Global Asset Management, Bank of Canada, BMO, CIBC,National Bank and Scotiabank. High Interest Savings Account (HISA) and one-year GlC rates arerepresented by the equally-weighted HISA and GIC rates for RBC, TD, BMO, CIBC, Scotiabank, andNational Bank. CSAV shown relative to some commonly used cash alternatives. This list is notexhaustive. Speak to your advisor.WHY INVEST IN THESE FUNDS?Greater earningspotential on cashbalances & low costFOR ADVISOR USE ONLY – NOT FOR DISTRIBUTION TO INVESTORSDaily liquidity& convenienceInvestment withConfidence – Safety &High-Quality Deposits35
One-Ticket active management solutions –CI Global Income & Growth FundCI Global Income & Growth FundAt-a-glanceOverviewAsset allocation*A holistic global balanced portfolio. The teamutilizes a multi-asset class framework, usingall sectors, anywhere in the world whileemploying tactical asset allocation & bottomup fundamental researchInception dateFebruary 22, 2007AUM 9.1 billionPortfolio ManagersDrummond Brodeur, SVP & Global StrategistGeof Marshall, SVP & Portfolio ManagerJohn Shaw, VP & Portfolio ManagerMatt Strauss, SVP & Portfolio ManagerRisk ratingLow-to-MediumDistributionsMonthly 0.025 Series ASeries & mgmt. feesSeries A 2.45%Series F 1.34%Real Estate Cash, 4.8%Equity, 4.1%Gold, 0.0%InfrastructureGovernment Bonds,Equity, 4.6%11.4%InternationalEquity, 18.0%Investment GradeCorp. Bonds, 6.2%High YieldBonds, 15.1%U.S. and Canadian Equity,35.5%Preferred Shares,0.4%FYI: CI Global Asset Allocation Private Pool is amore concentrated version with a lower fee andhigher minimum initial investment of 25,000*Source: CI Global Asset Management as of March 31, 2022.FOR ADVISOR USE ONLY – NOT FOR DISTRIBUTION TO INVESTORS36
CI Global Income & Growth Fund – Rolling tactical asset mix*100%CI GAM takes an active assetallocation approach shiftingthe fund’s portfolio asmarket dynamics andoutlooks change90%80%70%60%50%The fund combines a topdown and bottom- upapproach40%30%20%10%0%201220132014Developed Markets EquityInfrastructure EquityInvestment GradeCash201520162017EM EquityPreferred SharesGov. Bonds2018201920202021Real Estate EquityHigh YieldGoldSource: CI Global Asset Management, as of April 30, 2022. *Formerly Signature Global Income & Growth Fund renamed effective July 29, 2021.Asset Mix changes shown are from Dec 31, 2021 to April 30, 2022FOR ADVISOR USE ONLY – NOT FOR DISTRIBUTION TO INVESTORS37
Solid & consistent performanceCI Global Income & Growth Fund* Series FOverall Morningstar Rating 1-YR1-YRquartile3-
Lock-up period 3 Years starting when capital is called 3 Years starting when capital is called 3 Years starting when capital is called . ***Performance is of HarbourVest Adelaide Feeder the seed portfolio for the HarbourVest Infrastructure Income Cayman Parallel partnership L.P. . Returns are shown in USD. Global Hedge Funds HFRI Fund .