Transcription
Global Economic Damages from Climate Changeand the Gains from Complying with the ParisAccordTom KompasSchool of BiosciencesSchool of Ecosystem and Forest SciencesUniversity of MelbourneCrawford School of Public PolicyAustralian National University(co-authors: Pham Van Ha, Tuong Nhu Che and Quentin Grafton)February 7, 2019
Introduction: Dimension Matters!I It is not unusual to find numerical simulations that aredimensionally very large – and often impossible to solve –especially in studies that detail environmental impacts andclimate modelling or where optimization routines are required(the so-called ‘curse of dimensionality’).I Standard climate change economic models are either verysmall dimensionally and/or are not forward-looking orintertemporal (Nordhaus, 1991, DICE/RICE model; Rosonand Mensbrugghe, 2012, EVISAGE model; Tol, 2002, 2012)I Objective: Solve a VERY large Intertemporal GTAP GlobalTrade and Income Model to determine the local and globalimpacts of climate change at various temperature levels, alongwith the benefits of complying with the Paris Accord (at the2o C target).
The Effects of Climate Change on Growth and GDPI Using modified Roson and Satori (2016) climate changedamage ( /-) functions, we solve a large dimensionalintertemporal GTAP trade global model to account for thesome of the effects of global warming (e.g., loss in agriculturaland labour productivity, sea level rises impact on land area,and human health effects) for 140 countries, by decade andover the long term – where producers look forward and adjustprice expectations and capital stocks to account for futureclimate effects. (Fires, floods, drought, infrastructure damagefrom sea level rise, tropical storms, pollution, etc. not yetincluded.)I Results are generated in terms of losses in GDP for eachcountry and by various RCPs/SSPs, with overall results for1-4o C (SSP2 ‘business as usual’ baseline).
GTAP Model Database/DimensionI Example: GTAP database v7: The full database includes 112(extendable to 139) regions (countries) and 57 commodities.Table: GTAP model with different database/aggregation levels.ID123456Model Size112 regions, 3 commodities,47 periods112 regions, 4 commodities,47 periods112 regions, 5 commodities,47 periods112 regions, 26 commodities,47 periods112 regions, 34 commodities,47 periods112 regions, 57 commodities,47 periods Source: Authors’ calculation. Note:Number ofendogenousvariables13939336Number 5*109 Number ofnon-zeros58681307Number of non-zeros is an approximation.
The Effects of Climate Change on Growth and GDPI 57 commodity groups (with trade and spatial dimension),including paddy rice, wheat, cereal grains, vegetable, fruitsand nuts, bovine cattle, sheep, goats, horses, sugar cane, milk,wool, forestry, fishing, coal, oil, gas, meat products, vegetableoils and fats, dairy products, textiles, beverages and tobacco,wood products, paper products, chemical, rubber, leatherproducts, plastics, metal products, electronic equipment,machinery, manufactures, air transport, motor vehicles,electricity, construction, business services, defense, publicadministration, dwellings, communication, financial services,construction, transport, recreational and other services, etc.I Energy and power components in the IAM/GTAP-EP Model:Coal, oil, gas, oil products, fossil fuel electricity, renewables,non-fossil electricity, etc.
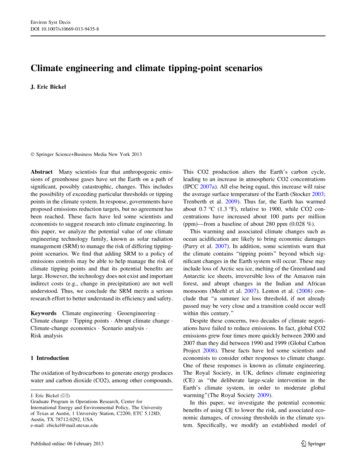
Climate Change Impacts – Long Run; 3o C Path, % GDPSource: Authors’ calculation.
Estimation of long term GDP loss per year in 2100 andforward under global warming scenarios ( US billion/year)World TotalSub-Saharan AfricaIndiaSoutheast AsiaChinaLatin AmericaRest of South AsiaMiddle East and North AfricaUnited States of AmericaJapanAustraliaSouth KoreaRussian FederationUnited KingdomGermanyFranceVietnam4o 4.4917.7823.8526.92-247.093o 87.11-106.02o .80-63.58
What do these BIG Numbers Mean?I Global long term economic damages in 2100 (albeit withlimited damage functions) at 3o C are US 9.5 trillion peryear and at 4o C losses are US 23 trillion per year.I US 23 trillion is (at least) 3 or 4 GFCs (2008) each year.I Some country losses are especially severe. GDP losses, forexample, at 4o C, for Cambodia, Sri Lanka, and Nicaragua areover 17%, for Indonesia 19%, for India 14%, Thailand 17%,Singapore 16%, the Philippines 20%, and for much of Africathe losses range from 18 to over 26% of GDP. Global losses inGDP during the Great Depression (1930s) were 15%. (China4.6%, USA 0.9%)I At 4o C, damages per person in Australia are projected to beAUD 4,886 or roughly AUD 13,945 per household, per year,every year, in the long run.
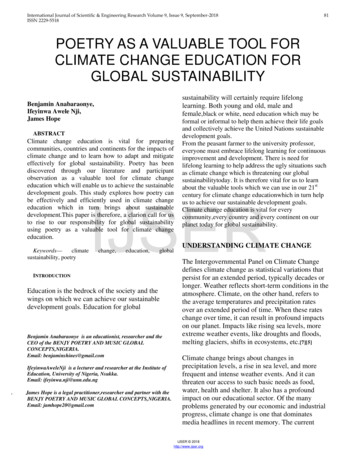
Distributional Effects of Climate Change at 4o C, % GDPFigure: Climate change impacts by country against income and % GDPimpact/damages (circle area country population WTBRASAUHKGBRNPAK 10ImpactMOZ THACRIINDHNDMean per capita GDPPRIBGDVNMQATARESGPMYSSENIDN 20PHLNGAGHATGO03000060000IncomeSource: Authors’ calculation.90000LUX
Gains from Complying with the Paris AccordI The successful achievement of the Paris Accord, which aimsto keep global warming at roughly 2o C (or RCP4.5), or less,allows us to calculate the potential benefit of the Accord asthe difference in losses between various temperature changesand 2o C scenario.I For example, comparing the 3o C and 2o C scenario: Thepotential gains of following the Paris Climate Accord foravoided global GDP losses are US 3,934 trillion a year in thelong term.I For the comparative case of RCP 8.5 (4o C), the global gainsfrom complying with the 2o C target (RCP 4.5), areapproximately US 17,489 trillion a year over the long term.
Cumulative Losses in GDP from 2017-2100 (bill. USD)World TotalSub-Saharan AfricaIndiaSoutheast AsiaChinaLatin AmericaRest of South AsiaMiddle East and North AfricaUnited States of AmericaJapanMexicoAustraliaVietnamSource: Authors’ calculation.4o 90-2898.86-7418.66Impacts (GDP)3o 097.39-3369.442o -2234.69
Comparing GTAP-IAM (SSP2) model results compared tosteady state GTAP-INT resultsTable: Long run impact: Heavily impacted countries and AUS (%/GDP)Rest of Southeast AsiaLaosRest of Western AfricaCambodiaBurkina FasoRest of South AsiaTogoPhilippinesRest of Central AmericaCote -21.11-14.37-15.82-18.35-1.70GTAP4o 18.23-25.25-1.58
Final Thoughts (1)I Model dimension matters: Averaging across countries andextremes in impacts distorts overall and country-specificdamages; severe damages occur even though standard damagefunctions are very limited in scope and impact (e.g., severeweather effects and ‘natural disasters’ that are climate changeinduced are excluded).I The severe falls in GDP in the long term will put manygovernments in fiscal stress. Tax revenues will fall dramaticallyand increases in the frequency and severity of weather eventsand other natural disasters, which invoke significantemergency management responses and expenditures, indicatethat pressure on government budgets will be especially severe.
Final Thoughts (2)I ’Three Great Myths in the Economics of Climate Change’:1. Total damages, long term and cumulative, are relatively smallboth in income levels and as a percentage of GDP. The severedamages in the Stern Report are mainly due to the lowdiscount rate. (In our work the discount rate is standard at5%)2. Poorer countries are not differentially affected, except perhapsat extreme parameter values and, in any case, they can bemore than compensated by countries on high emissionspathways with BAU.3. The costs of emissions reduction far outweigh the relativedamages from climate change.
Thank you!I Thanks for listening!I www.tomkompas.orgI tom.kompas@unimelb.edu.au
The E ects of Climate Change on Growth and GDP I Using modi ed Roson and Satori (2016) climate change damage ( /-) functions, we solve a large dimensional intertemporal GTAP trade global model to account for the some of the e ects of global warming (e.g., loss in agricultural and labour productivity, sea level rises impact on land area,