Transcription
#TC18Basic Stats with TableauTyler MartinSenior Software EngineerTableau Software
Tyler Martintmartin@tableau.com
Agenda Confidence intervalsHypothesis testingTrend linesForecastingQ&A
Confidence Intervals
Confidence Interval: DefinitionDefinitionFor 95% of samples, the confidence interval will contain the population averageFor a particular sampleThere is an 95% chance that the confidence interval contains the population average
Confidence Intervals Answer Questions Like What does my sample of mile-run times tell me about theaverage 2nd grader in Seattle?Is the average 2nd grader in Seattle likely to run a faster milethan me?
Hypothesis Testing
Hypothesis Testing: Test StatisticA value calculated from your dataThis value always follows the same distribution, regardlessof the distribution of your data*
Hypothesis Testing: Procedure1. State the hypothesis and the null hypothesis2. Choose an appropriate test statisticThis usually follows a well-known distribution3. Choose a threshold probabilityUsually small, we will use 0.005 (0.5%)
Hypothesis Testing: Procedure (continued)4. Calculate the p-valueThe probability under the null hypothesis of sampling a test statisticat least as extreme as what we observed.5. Accept or reject the hypothesisAccept: p 0.005Reject: p 0.005
Student’s t-testTest statistic follows Student’s t-distributionWe will use a two-sample location testTests the null hypothesis that the means of two populationsare equal
Hypothesis Testing Can Answer Questions Like Are CrossFit Games athletes stronger on average in 2018than they were in 2007? (t-test)Are observations of two groups independent of oneanother? (Chi-squared test)Is my sample drawn from a normally distributedpopulation? (Shapiro-Wilk test)
Trend Lines
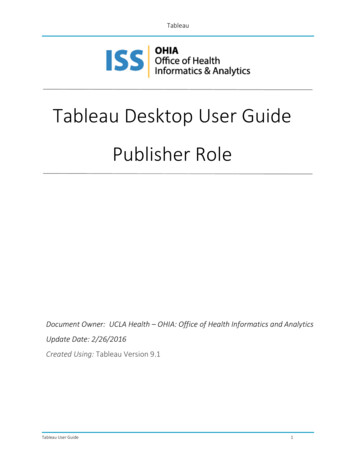
Trend Lines: Null HypothesisWhat if there is no relationship?
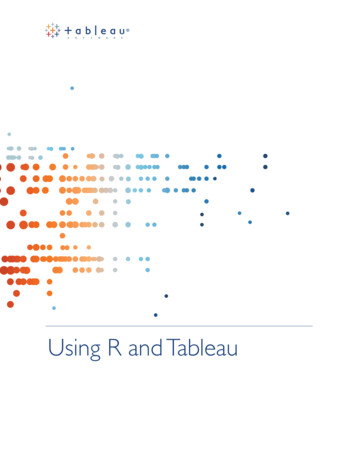
Trend Lines: Residuals
Trend Lines: OLS Questions1. Do I suspect there is a relationship between two variables? Whatdo I suspect that relationship is?2. Do the residuals have mean 0? Do they appear unrelated to theindependent variable?3. Are the residuals are unlikely to be correlated with one another?4. Does the spread of the residuals look roughly the same withchanges in the independent variable?
Trend Lines Answer Questions Like What is the relationship between profit and CEOcompensation?When wind speed changes, how does windmill poweroutput change?Does compensation change in a meaningful way when agechanges?
Forecasting
Forecasting: Model QualityWe will consider only Mean Absolute Scaled Error (MASE)MASE compares the error of your model with the error ofthe naïve forecastMASE is typically between 0 (good) and 1 (bad)
Forecasting: Naïve ForecastForecast values copied from the last observed value.For seasonal forecasts, values are copied from the lastobserved season.
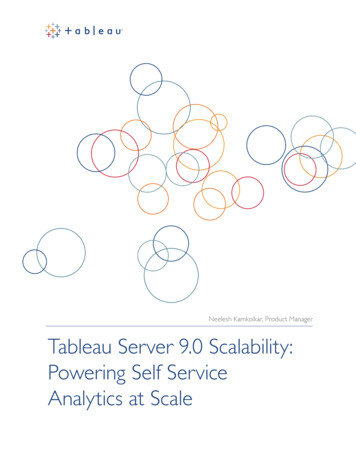
Forecasting: Unexpected and Poor Forecast1. Does it look like there is a structural break in my data?2. Is there a lot of short-scale variation at the current datelevel?
Forecasts Answer Questions Like How many visitors to my page can I expect in the future,given data on past visits?Based on past data, what will my inventory be in the future?How is the value of my collection likely to change in thefuture?
Questions
Please complete thesession survey from theSession Details screenin your TC18 app
Trend Lines: OLS Questions 1. Do I suspect there is a relationship between two variables? What do I suspect that relationship is? 2. Do the residuals have mean 0?